SIMULATION AND MEASUREMENT FOR INDOOR AIR FLOW
LIM DA PING
i
SUPERVISOR DECLARATION
“I hereby declare that I have read this thesis and in my opinion this report is sufficient in terms of scope and quality for the award of the degree of
Bachelor of Mechanical engineering (Design and Innovation)”
Signature: ………..
Supervisor: Dr. Tee Boon Tuan
ii
SIMULATION AND MEASUREMENT FOR INDOOR AIR FLOW
LIM DA PING
This Technical Report is submitted to
Fakulti Kejuruteraan Mekanikal, Universiti Teknikal Malaysia Melaka In partial fulfilment for
Bachelor of Mechanical Engineering (Design and Innovation) with honours
Faculty of Mechanical Engineering
UNIVERSITI TEKNIKAL MALAYSIA MELAKA
iii
DECLARATION
“I hereby declare that the work in this report is my own except for summaries quotations which have been duly acknowledged.”
iv
v
ACKNOWLEDGEMENT
Firstly, I would like to express my gratitude to my supervisor Dr. Tee Boon Tuan, who guides me throughout this project. Under his guidance, I had gained lots of knowledge and able to complete this final year project 1 report successfully.
Besides that, I would also like to send my gratitude to En. Muhammad Zulfattah Bin Zakaria for evaluating my final year project. Several inputs which were suggested earlier had given me an idea and guidance to improve my final year project.
Furthermore, I would like to thank Faculty of Mechanical Engineering (FKM), Universiti Teknikal Malaysia Melaka (UTeM) for giving a fully support and allows me to utilize the facilities equipment’s which are available in laboratories.
vi
ABSTRACT
vii
ABSTRAK
viii
TABLE OF CONTENTS
CHAPTER TITLE PAGE
SUPERVISOR DECLARATION i
DECLARATION iii
DEDICATION iv
ACKNOWLEDGEMENT v
ABSTRACT vi
ABSTRAK vii
TABLE OF CONTENTS viii
LIST OF TABLES xi
LIST OF FIGURES xii
LIST OF APPENDICES xiv
CHAPTER 1 INTRODUCTION 1
1.1 OVERVIEW 1
1.2 OBJECTIVES 3
1.3 SCOPE 3
1.4 PROBLEM STATEMENTS 3
1.5 EXPECTED OUTCOMES 4
CHAPTER 2 LITERATURE REVIEW 5
2.1 MECHANICAL VENTILATION IN ROOMS 5
2.2 GENERAL FLOW BOUNDARY CONDITION 7
2.3 COMPUTATIONAL FLUID DYNAMICS 9
2.4 TURBULENCE MODELING 9
2.4.1 STANDARD κ-ε MODEL 10
ix
2.4.3 REYNOLDS STRESS TURBULENCE
MODEL 12
2.4.4 LARGE EDDY SIMULATION
TURBULENCE MODEL 13
2.5 PREVIOUS STUDIES FROM OTHER
RESEARCHERS 14
2.5.1 SIMULATION AIR FLOW IN LECTURER
ROOM BY JOHNSON, ADNAN AND TEE 14
2.5.2 CFD VALIDATION OF THE THERMAL COMFORT USING DRAFT RATES BY
MIKA AND JOHN 17
2.5.3 NUMERICAL STUDIES ON THE
INDOOR AIR FLOW IN THE OCCUPIED ZONE OF VENTILATED AND AIR-CONDITIONED SPACE BY CHOW W.K
AND FUNG W.Y 18
CHAPTER 3 METHODOLOGY 21
3.1 RESEARCH METHODOLOGY 21
3.2 ROOM BOUNDARY CONDITION 23
3.3 INSTRUMENTATION 23
3.3.1 ROOM PHYSICAL DATA
MEASUREMENT 24
3.3.2 INDOOR AIR PARAMETERS
MEASUREMENT 24
3.3.3 ANSYS FLUENT SOFTWARE 25
3.4 PROCEDURES 25
3.4.1 MEASUREMENT PROCEDURES 25
3.4.2 SIMULATION PROCEDURES 26
3.4.3 DATA ANALYSIS 27
3.5 EXPERIMENTAL CONDITION ASSUMPTION 28
CHAPTER 4 RESULTS 29
x
4.2 MEASUREMENT RESULTS 29
4.3 SIMULATION RESULTS 33
4.4 STREAM PLOT FOR SIMULATION 34
4.5 COMPARISON RESULTS ANALYSIS 39
CHAPTER 5 DISCUSSION 41
5.1 DATA COMPARISION FOR MEASUREMENT
AND SIMULATION 41
5.2 COMPARISION WITH PREVIOUS STUDY 42
CHAPTER 6 CONCLUSION 44
6.1 CONCLUSION AND RECOMMENDATION 44
REFERENCES 46
APPENDIX A 48
xi
LIST OF TABLES
[image:12.595.113.521.202.596.2]NO TITLE PAGE
Table 2.1 Percentage of Results with AbsoluteDifference of Air Velocity
Value of Below 0.10 m/s 16
Table 2.2 Percentage of Results with Absolute Difference of Air Temperature
Value of Below 1⁰C (Johnson Lim, Adnan, & Tee, 2002) 16
Table 2.3 Average Velocity Values for Experiments and Simulations Cases
(Tinker, 2007) 18
Table 3.1 Description for Meeting Room Simulation in ANSYS FLUENT
Software 26
Table 4.1 Physical data of Meeting Room Dimension 29
Table 4.2 Measurement Data for the Meeting Room 30
Table 4.3 Average and Range of Measurement Parameter in Meeting Room 31
Table 4.4 Simulation Data for the Meeting Room 33
Table 4.5 Comparison for Air Velocity for Both Measurement and Simulation 39
Table 4.6 Comparison for Air Temperature for Both Measurement and
Simulation 40
xii
LIST OF FIGURES
NO TITLE PAGE
Figure 2.1
Schematized Representation of Mixing and Displacement Ventilation Principle; Flow Pattern (left) and Variable Gradient of the Height (right). At a given Height the Variable has been Averaged over the Total Horizontal Plane in the
Room 6
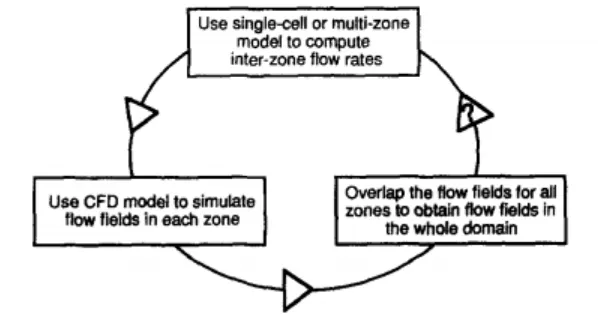
Figure 2.2
Specification of the General Flow Boundary Conditions Using
the Results of a Multi-zone Infiltration Model . 8 Figure 2.3 Stream Plots for RNG k-e Turbulence Model Simulation in
Lecture Room BK17 15
Figure 2.4 Stream Plots for RNG k-e Turbulence Model Simulation in
Lecture Room BK23 15
Figure 2.5 Test Room Plan and Dimensions from Z and X-directions 17 Figure 2.6 Location of the field measuring points at the occupied zone of
test sites (Office Room, Gymnasium, Railway Concourse) 19 Figure 2.7 Validation of the numerical results (all at the occupied zones
of the test sites) 20
Figure 3.1 Procedure Flow Chart 22
Figure 3.2 Overview of the Meeting Room 23
Figure 3.3 Air Velocity Meter Measuring Device 24
Figure 4.1 Graph of Air Velocity Versus Zone 31
Figure 4.2 Graph of Air Temperature Versus Zone 32
xiii
xiv
LIST OF APPENDICES
NO TITLE PAGE
A Zone Division and the Position of the Air Diffuser in the
Meeting Room 47
1
CHAPTER 1
INTRODUCTION
1.1 OVERVIEW
Nowadays, as majority people spend most of their time indoors, therefore the indoor air flows inside a building is very important. As we all know, people seems to be more productive and effective when they feel comfortable in their working place. A room which is well ventilated and temperature controlled will provide a better occupant environment compare to the one which is too cold, too hot or even poorly ventilated. Therefore, with the introducing of mechanical ventilation, it has become the primary mechanism which used to maintain the acceptable indoor air quality and provides a suitable thermal comfort inside a building.
2
approach by using a Computational Fluid Dynamics (CFD) is now been widely used to model the indoor air flows.
Computational Fluid Dynamics (CFD) is a type of fluid mechanics which uses mechanical method and algorithm to solve and analyzed the problems that related to fluid flows. It is used to replace the governing partial differential equations or integral equations of fluid flows with numbers, and use those numbers in either space or time or both to obtain a finalize numerical description of the completed fluid flow of interest. CFD has recently become the premier tool for fluid flow simulation due to the highly improve and growth in computer technologies. Its application not only specifically for modeling buildings but also include those aircraft aerodynamics, hydrodynamics of ships, meteorology, engineering in biomedical, pollutant effluents studies and etc.
3
1.2 OBJECTIVES
a) To conduct the measurement of indoor air flow patterns, with respect to accuracy, sensitivity and applicability.
b) To reveal current limitation in computational simulation for indoor air flow and also its sensitivity to input parameters. (Attention is put on the computational results rather than to improve the modeling)
c) To investigate a type of flow problem that subscribes to the current view in ventilation, for example task conditioning.
.
1.3 SCOPE
a) To conduct practical measurement involving air velocity, temperature and relative humidity by using available measuring equipment.
b) To perform a suitable simulation technique by using the available CFD software and comparing its validity and sensitivity with the measurement data.
1.4 PROBLEM STATEMENTS
4
1.5 EXPECTED OUTCOMES
a) Measurement of physical data by using available measuring device.
b) Set of measurement data of indoor air parameters by using suitable measuring device.
c) Results of analysis of the indoor air flow by the CFD simulation.
5
CHAPTER 2
LITERATURE REVIEW
2.1 MECHANICAL VENTILATION IN ROOMS
Basically, there are two types of mechanical ventilation used to ventilate the space of a room, which are mixing ventilation and displacement ventilation. Mixing ventilation is a traditional method of supplying air to ventilate the spaces in a room. In mixed flow ventilation, the cool air is supplied from the ceiling or through a higher place where the incoming air is supplied at a relatively high velocity to cause a high degree of mixing with the air in the room to take place.
However, displacement ventilation is a method where the low air velocity is supplied from the bottom of a room (floor level). The air which is from the lower part of the room is supplied upward by rising convection flows from heat sources in the room and will be removed at the upper level (ceiling level). The characteristics of this type of ventilation includes low location of supply opening and high location of return opening, free convection around heat sources, stratified flow in the room, vertical temperature and concentration gradient and also air movement is controlled by buoyancy.
6
[image:21.595.117.528.216.484.2]It is actually possible to ventilate a room naturally. This can be done by refreshing indoor air with outside air through openings in the windows or door. For meeting room, natural ventilation unable to maintain the high level of indoor air quality for a longer period. Therefore, mechanical ventilation is mostly used (Loomans, 1998).
Figure 2.1: Schematized Representation of Mixing and Displacement Ventilation Principle; Flow Pattern (left) and Variable Gradient of the Height (right). At a given Height the Variable has been Averaged over the Total Horizontal Plane in the Room
7
2.2 GENERAL FLOW BOUNDARY CONDITION
In the term of Computational Fluid Dynamics (CFD), the boundary conditions can be specified in three ways:
1) Dirichlet condition, e.g. on ∂C, where is the independent variable, C is the computational domain, and ∂C is the boundary.
2) Neumann (derivative) condition, e.g. ∂ /∂n or ∂ /∂s on ∂C, where n is the outward normal distance and s is the distance along the boundary. 3) Robin (mixed) condition, e.g. ∂ /∂n + on ∂C. The computational
algorithm (based on the governing equations) extrapolates these boundary conditions to provide the solution in interior, C.
8
[image:23.595.169.468.266.423.2]A number of single-cell and multi zone models have been developed since twenty years ago. These models generally consider the mechanical ventilation, tightness of the building, terrain and shielding conditions and also climate conditions. The predicted air flow rates across the envelopes, between the rooms, and through the mechanical ventilation system can be used as the boundary conditions in CFD simulation as shown in Figure 2.2.The specification of the general flow boundary conditions is complicated and difficult when specifying the area and position of the leakage or opening as found in formulating multi zone models (Yuguo Li, 1994).
9
2.3 COMPUTATIONAL FLUID DYNAMICS
Computational Fluid Dynamics (CFD) is used to predict and model the internal and external air flow inside a building. Many commercial CFD software which are available in market can be used to predict the air flow pattern ventilate by air distribution devices and thermal sources. From the perspective of CFD, air flows in a room can be considered complex. This is because in the reality, at a reasonable ventilation rates, the air flow is completely turbulent in the supply of air ducts, air conditioning system and downstream edges of the obstacles. Therefore, indoor air flow simulation use turbulence models to compute the mean values with the help of computers (Cao, 2006).
2.4 TURBULENCE MODELING