University of Southern Queensland
Faculty of Health, Engineering & Sciences
Design of a Portable Bushfire Attenuation
Fence
Dissertation Submitted By
Bradley Fell
In fulfilment of the requirements of
ENG4111 and ENG4112 Research Project
Towards the degree of
Bachelor of Mechanical Engineering (Hons)
Page | 2
Abstract
Bushfires are natural disasters that occur frequently in Australia, and are associated with
substantial economic and human costs. Currently, methods of combating bushfire
propagation rely predominantly on containment through the use of firebreaks; large open
areas devoid of fuel to sustain the fire. However, ignited embers (firebrands) are often
carried via wind across these spaces, leading to the fire spreading to the other side.
Additionally, accumulation of these firebrands around buildings are responsible for a vast
majority of homes destroyed in a bushfire event.
In this project, a novel new approach to preventing firebrand transmission is investigated.
Fine aperture wire mesh screen barriers have been demonstrated in laboratory experiments
to reduce the transmission of firebrand particles and prevent the subsequent accumulation
on and ignition of flammable fuel beds. Therefore, the concept of constructing a large,
portable fence comprising of this mesh material is investigated; with determination of
required parameters and specifications carried out before a prototype computational design
was developed and validated through the use of Finite Element Analysis.
In addition to the development of a preliminary design, an assessment criterion was
developed in which the performance of a bushfire attenuation fence design could be
evaluated, leading to the ability to qualitatively rank and refine designs based upon factors
such as weight per unit length; cost per unit length and assembly time per unit length.
Investigation into the conditions associated with both close proximity to bushfires and the
mechanics of their propagation lead to the selection of a maximum design wind speed of 28
m/s (100.8 km/h), a peak design temperature of 500oC and a required fence height of 10
metres.
Feasibility analysis on various assembly and grounding methods lead to the selection of a
combination of temporary ground screw anchors and guy wires as method of securing the
fence, with the maximum fence span with this configuration being 10 metres.
Detailed design of individual fence components was then carried out, with the final design
subjected to FEA validation under the imposed loads and conditions. The results of the final
design specified was then evaluated against the assessment criteria developed, with the
estimated results being 2.64 tonnes per 100 metres and assembly time estimates of between
Page | 3
University of Southern Queensland
Faculty of Health, Engineering and Sciences
ENG4111/ENG4112 Research Project
Limitations of Use
The Council of the University of Southern Queensland, its Faculty of Health, Engineering &
Sciences, and the staff of the University of Southern Queensland, do not accept any
responsibility for the truth, accuracy or completeness of material contained within or
associated with this dissertation.
Persons using all or any part of this material do so at their own risk, and not at the risk of the
Council of the University of Southern Queensland, its Faculty of Health, Engineering &
Sciences or the staff of the University of Southern Queensland.
This dissertation reports an educational exercise and has no purpose or validity beyond this
exercise. The sole purpose of the course pair entitled “Research Project” is to contribute to
the overall education within the student’s chosen degree program. This document, the
associated hardware, software, drawings, and other material set out in the associated
appendices should not be used for any other purpose: if they are so used, it is entirely at the
Page | 4
University of Southern Queensland
Faculty of Health, Engineering and Sciences
ENG4111/ENG4112 Research Project
Certification of Dissertation
I certify that the ideas, designs and experimental work, results, analyses and conclusions set
out in this dissertation are entirely my own effort, except where otherwise indicated and acknowledged.
I further certify that the work is original and has not been previously submitted for
assessment in any other course or institution, except where specifically stated.
Name: Brad Fell
Student Number: 0061042222
Page | 5
Acknowledgements
I would first like to give my sincere gratitude and appreciation to my project supervisor, Dr
Ahmad Sharifian, for not only offering me the opportunity to work on this project but also
for his generosity with his time throughout the development phase of this project; his
guidance has been invaluable to me during the course of the year.
I would also like to thank my parents, in particular my father, Russell Fell and his company
Communications and Computer Support for providing me with access to a high performance
computer to assist in the simulation phase of this project.
Finally, I would like to thank my friends and peers, for their help in bouncing ideas off of and
helping to solve problems; as well as just for making the past four years a bearable and a
memorable experience.
Page | 6
Contents
Abstract ... 2
Limitations of Use ... 3
Certification of Dissertation ... 4
Acknowledgements ... 5
List of Figures ... 9
1.0 Introduction ... 12
1.1 Project Background ... 12
1.2 Project Scope and Aim ... 14
1.3 Project Implications and Safety Considerations ... 15
2.0 Literature Review ... 16
2.1 Conditions Inside a Bushfire ... 16
2.2 High Temperature Effects on Structural Steel Properties ... 19
2.3 Types of Meshes ... 22
2.4 Fire Retardant Properties of Wire Mesh ... 24
2.4.1 Wire Mesh Defence Against Firebrand Transmission ... 25
2.4.2 Wire Mesh Reduction of Radiant Heat Flux ... 28
2.5 Drag Force on Wire Mesh Screens ... 29
2.6 Australian Standards for Temporary Fencing ... 33
2.6.1 Simulated Climbing Test... 34
2.6.2 Impact Loading Test ... 35
2.6.3 Infill Aperture Width Test ... 35
2.6.4 Infill Downforce Test ... 35
2.6.5 Wind Force Overturning Test ... 35
3.0 Project Methodology ... 36
3.1 Development of Design Specifications ... 36
3.1.1 Effectiveness at Preventing Firebrand Transmission and Radiant Heat Flux . 36 3.1.2 Portable Lightweight Construction Capable of Assembly with Minimal Tooling and Machinery ... 38
3.1.3 Fast Assembly to Maximize Protective Coverage Prior to Fire ... 39
3.1.4 Low Capital Cost to Attract Market Investment ... 39
3.2 Development of Design Assessment Criteria ... 40
Page | 7
3.2.2 Efficacy of Radiant Heat Flux Reduction ... 41
3.2.3 Measurement of Portability and Weight of Design ... 41
3.2.4 Measurement of Speed of Assembly ... 42
3.2.5 Measurement of Cost ... 43
3.3 Development Procedure of Fence Design ... 43
3.3.1 Idea Generation ... 44
3.3.2 Feasibility Analysis Through Fundamental Calculations ... 44
3.3.2 Modelling and Simulation Using Finite Element Analysis ... 44
4.0 Preliminary Design Parameter Development ... 45
4.1 Calculation of Mesh Drag Force ... 45
4.2 Implications of Drag Force on Fence Sizing ... 47
4.2.1 Total Drag Force and Overturning Moment for Various Fence Sizes ... 47
4.2.2 Analysis of Total Drag and Overturning Moment Estimations ... 49
4.3 Fence Support Footing Design Selection ... 50
4.3.1 Use of Weighted Blocks to Secure Fence Supports ... 50
4.3.2 Planting of Fence Supports into Ground via Post-Hole Digger ... 52
4.3.3 Restraint of Fence Supports with Ground Anchors ... 53
4.4 Support Spacing and Mesh Porosity Selection ... 55
4.5 Fence Construction Method Selection... 56
4.5.1 Entire Fence Assembled on Ground and Erected as Single Unit... 57
4.5.2 Assembly and Construction in Single Support Span Sections ... 58
4.5.3 Fence Post Construction Followed by Hoisting Mesh ... 59
4.5.4 Final Fence Construction Method Selection ... 60
4.6 Final Design Parameter Summery ... 60
5.0 Final Design Development and Validation ... 60
5.1 Fence Post Sizing and Selection ... 61
5.1.1 Fence Post Material Selection ... 61
5.1.2 Steel Properties at 500oC ... 62
5.1.3 Metal Fatigue Considerations ... 63
5.1.4 Fence Post SHS Sizing Methodology ... 65
5.1.5 Fence Post Sizing Results ... 67
5.1.6 Portability and Weight Requirements ... 73
5.1.7 Joining of Fence Post Sections ... 73
Page | 8
5.1.9 Evaluation of Buckling Load ... 80
5.2 Mesh Support and Fence Post Attachment ... 83
5.2.1 Mesh Attachment to Support Cables ... 83
5.2.2 Sizing of Mesh Support Cables ... 87
5.2.2 Design of Support Cable Post Attachment and Hoisting Mechanism ... 90
5.3 Fence Base Design ... 94
5.3.1 Determination of Base Specifications ... 94
5.3.2 Sizing of Base Ground Anchors ... 95
5.3.3 Base Geometry and Steel Section Sizing ... 97
5.3.3 Post Attachment Assembly Sizing ... 98
5.3.4 Design of Base Ground Anchoring Arrangement ... 100
5.3.5 Design of Base Legs ... 101
5.3.6 Design of Post Lifting Jig ... 105
6.0 Evaluation of Final Design ... 108
6.1 Fence Weight Per 100 Metre Length ... 109
6.2 Fence Assembly Procedure and Estimated Assembly Time... 109
7.0 Conclusions and Recommendations for Further Work ... 111
7.1 Summary of Work Undertaken ... 111
7.2 Summary of Results ... 112
7.3 Recommendations for Further Work ... 112
8.0 References ... 113
Appendices ... 118
Page | 9
List of Figures
Figure 2-1 Graph Showing Flame Temperature vs Time for Different Heights above Ground
Level in an Experimental Test (Poon, 2003) ... 17
Figure 2-2 Measured Heat Flux vs Time for ICFME Test (Cohen, J. 2000) ... 18
Figure 2-3 Image Showing Aftermath of a Victorian Bushfire (O’Neill, 2003) ... 18
Figure 2-4 Graph Showing Steel Strength Reduction at Elevated Temperatures (Chen et. al. 2006) ... 20
Figure 2-5 Figure Showing Reduction in Modulus of Elasticity at Elevated Temperatures (Chen et. al. 2006) ... 21
Table 2-6 Table Showing Typical Available Bushfire Mesh Sizes (SSWM 2016) ... 23
Figure 2-7 Graph Showing Strength of Stainless Steel Wire vs. Diameter (Kraft 2010) ... 24
Figure 2-8 Image Showing a Simulated Firebrand Attack Upon a Dwelling (Insurance Institute for Business and Home Safety, 2016)... 25
Figure 2-9 Image Showing Effect of Mesh Screen Upon Firebrand Ignition of Fuel Beds (Hashempour, J., pers. comm.) ... 27
Figure 2-10 Graph Showing Radiation Passing Ratio vs Mesh Porosity with Predicting Function (Hashempour et. al. 2016) ... 29
Figure 2-11 Graph Showing Cd values for Wire Mesh from Two Different Correlations ... 31
Figure 2-12 Graph Showing Cd values for Wire Mesh from Two Different Correlations ... 31
Figure 2-13 Graph Showing Cd values for Wire Mesh from Two Different Correlations ... 32
Figure 2-14 Diagram Showing Simulated Climbing Test Arrangement (Standards Australia 2009) ... 34
Figure 2-15 Diagram Showing Sites of Impact Testing (Standards Australia 2009) ... 35
Figure 4-1 Image Showing Basic Fence Configuration ... 47
Figure 4-2 Picture Showing Use of Concrete Blocks as Fence Support (McGinnis 2013) ... 50
Figure 4-3 Image of Several Temporary Earth Anchors (Rittenhouse, 2016) ... 54
Figure 5-1 Figure Showing Relationship Between Fatigue Surface Factor, Tensile Strength and Surface Finish (Juvinall & Marshek, 2012) ... 64
Figure 5-2 Image Showing Guy Wire Placement on Radio Tower (Zhejing Guanming Power Transmission Material Corp. 2016) ... 65
Figure 5-3 Absolute Bending Moment Diagram of Fence Post with Guy Wire Supports at 4m and 8m Respectively ... 68
Page | 10
Figure 5-5 Image Showing FEA Results for Total Deflection of Fence Post at 22oC ... 70
Figure 5-6 Image Showing FEA Results for Von-Mises Stress on Fence Post at both 22oC and 500oC ... 71
Table 5-7 Table Showing Force Reaction Results for 3D FEA Analysis of Fence Post at both 22oC and 500oC... 71
Figure 5-8 Image of Butt Plate Column Splice (Snijder and Hoenderkamp, 2006) ... 74
Figure 5-9 Picture Showing Type of Hook Used for Guy Cable Attachment to Post (All Lifting, 2016) ... 77
Figure 5-10 Image Showing Preliminary Guy Cable Attachment Point Design ... 78
Figure 5-11 Image Showing Stress Levels on Initial Guy Cable Attachment Point ... 79
Figure 5-12 Image Showing Final Design and Associated FEA Results for the Guy Cable Attachment Point ... 80
Figure 5-13 Image Showing Free Body Diagram of Euler Buckling (Kurt Gramoll, 2016) ... 81
Figure 5-14 Image Showing a Buckling Mode of Fence Post at 500oC ... 82
Figure 5-15 Image Showing a Buckling Mode of Fence Post at 500oC ... 82
Figure 5-16 Images Showing a Buckling Mode of Fence Post at 500oC ... 82
Figure 5-17 Picture Showing Mesh Clamp Connection (Crimsafe, 2016) ... 84
Figure 5-18 FEA Result of Wire Mesh Restraint Using Sheet Metal Seam ... 85
Figure 5-19 Pictures Showing Welding of Wire Mesh to Sheet Metal (Sunstone Engineering, 2015) ... 86
Figure 5-20 Image Showing Physical Meaning of Cable Equation Variables (Engineering Toolbox, 2016) ... 87
Figure 5-21 Graph Showing Relationship Between Tension, Cable Length and Fence Sag ... 88
Figure 5-22 Picture Showing Turnbuckle with Jaw and Eyelet Ends Similar to the one Specified in the Design (Lifting Rigging, 2015) ... 89
Figure 5-23 Picture of a Portable, Hand Operated 'Cable Puller' Type Winch (Harbor freight, 2016) ... 90
Figure 5-24 Image Showing Track and Runner Design... 90
Figure 5-25 Image of Runner Hoisting Arrangement ... 91
Figure 5-26 FEA Stress Results for Post, Runner and Track ... 92
Figure 5-27 FEA Deformation Results for Post, Track and Runner at 22oC ... 93
Figure 5-28 FEA Deformation Results for Post, Track and Runner at 500oC ... 93
Figure 5-29 Image Showing 'X' Style Base Design ... 97
Page | 11 Figure 5-31 FEA Stress Results of Fence Base Model Under Maximum Loading Conditions
... 103
Figure 5-32 FEA Deformation Results of Fence Base Model at 22oC Under Maximum Loading
Conditions ... 103
Figure 5-33 FEA Deformation Results of Fence Base Model at 500oC Under Maximum
Loading Conditions... 104
Figure 5-34 Close-up of FEA Stress Concentration in Pin ... 104
Page | 12
1.0
Introduction
1.1
Project Background
Bushfires are large scale fire events that occur frequently in Australia and other parts of the
world with fuel dense forests and hot, dry climates. They are capable of causing widespread
destruction of property, infrastructure, livestock and in extreme events have resulted in
dramatic loss of life; as was seen in the 2009 Black Saturday Bushfires in Victoria, which killed
173 people and had an estimated economic impact of over a billion dollars (CFA
2012)(Australian Institute of Criminology 2009). With climate change anticipated to cause
hotter and dryer conditions in bushfire prone areas, the occurrence and severity of future
fires is likely to increase (Balston and Williams 2014). Therefore, there is significant interest
from many parties in developing more effective methods of controlling and containing these
natural disasters.
Due to the large size and intense heat generation of bushfires they cannot be directly
extinguished through either smothering (removing available oxygen supporting combustion)
or removing the generated heat. Instead, firefighters aim to contain large bushfires through
techniques such as back burning and the construction of firebreaks. These measures are
designed to reduce the available fuel in the path of the advancing fire, thus limiting its
progress. However, bushfires can and often do jump these containment lines, posing a
serious threat to the surrounding region.
The mechanism through which bushfires propagate and escape containment is multifaceted.
In addition to fire spread through direct flame contact with new fuel, burning embers are
also lifted by the fires convective effect and blown by the prevailing wind downstream of the
main blaze. These ‘firebrands’ land on suitable fuel beds and can ignite new spot fires;
complicating firefighting efforts and causing containment breaches. This phenomenon, also
known as ‘Ember Attack’ is the primary cause of building ignition in bushfire events
(Hashempour and Sharifian 2015).
Further affecting bushfire propagation is the intense heat radiated off from the fire, referred
to as Radiant Heat Flux (RHF). The level of RHF in a large bushfire can reach as high as 100
kW/m2, with values between 10 kW/m2 and 80 kW/m2 considered typical (Hashempour,
Sharifian & Billingsley 2015). Such extreme heat flux assists the bushfire spread by
Page | 13 causing spontaneous combustion above certain intensity levels. Radiant heat also prevents
close access to the fire front, hampering combative measures. The majority of deaths that
occur in bushfires are as a result of being trapped in close proximity to excess RHF.
Due to the abovementioned factors, controlling and containing bushfires is a difficult task
fraught with danger. This has led to interest in developing new methods of approaching
fighting bushfires. Recent research conducted at the University of Southern Queensland into
a way of controlling bushfires has yielded promising results. Small aperture wire mesh has
been investigated for its potential to reduce windborne firebrands and shield against excess
levels of RHF.
The use of metal wire mesh as a protection measure against bushfires is currently used on a
small scale. After the 2009 Black Saturday Bushfires in Australia, the Australian Standard AS
3959-2009, ‘Construction of buildings in bushfire-prone areas’ was revised, with one of the
additions being the requirement of 2 mm or smaller aperture wire mesh screens to be
installed across windows and other openings for the purpose of preventing the passage and
subsequent accumulation of firebrands inside structures. Other jurisdictions in areas which
experience wildfires have similar requirements mandated.
This project seeks to extend the concept of small aperture wire mesh as a bushfire defence
measure through the construction of large fences using low porosity wire mesh. By placing
such fences in the path of the bushfire, in conjunction with firebreaks, significant attenuation
of the major causes of fire propagation could be achieved. Currently, there is no available
Page | 14
1.2
Project Scope and Aim
This project aims to further develop the concept of the use of wire mesh as a method of
retarding bushfire progress and better protecting man-made structures from bushfire attack.
As this idea has not been trialled in a real bushfire situation, the concept has not been shown
to be effective as of yet, although experimental results are promising.
As such, it is the aim of this project to investigate, through the use of computational
simulation, the feasibility and consequently the design parameters for such a fence to be to
be viable. However, as the concept is untested, the primary outcome of the project is not to
develop the most effective fence. Rather, a design that is lightweight, easy to construct and
requires low initial capital investment is the focus. Such a design could then be prototyped
and tested on a small scale, and the effectiveness of the concept tested. As an initial trial,
this project will focus on designing a fence capable of being erected on reasonably short
notice without significant equipment, for the purpose of aiding the defence of a dwelling or
individual building against bushfire attack.
Therefore, the objectives of this project can be summarised as such:
Review the current research into the use of mesh screens as a barrier against fire embers and radiation to understand the relationship between mesh properties and
potential fire protection properties.
Investigate conditions created by bushfires in order to develop an understanding of the environmental limitations and subsequent design limitations faced.
From the information compiled in the literature reviews, develop a series of design aims which address the factors which were identified as being important for the
success of the bushfire fence.
Develop a series of assessment criteria against which any particular design can be evaluated to quantify its adherence to the design aims from the previous point, in
addition to developing a framework with a relevant benchmark future projects can
measure against.
Through the use of relevant engineering theory and data, evaluate the feasibility of various fence design options, determine the most appropriate and develop a
Page | 15
Develop a computation model using the Finite Element Analysis Software ANSYS to determine design parameters such as maximum stress, deflection and support
forces and reactions, refining and detailing the preliminary design further.
Evaluate the final design developed against the assessment criteria previously created to assess the success in which the final design met the design goals.
List recommendations for the direction which further work in this area should be directed, based upon the findings and information gained through the course of the
research project.
1.3
Project Implications and Safety Considerations
Due to the nature of the area of research and the project aims; the preliminary design of a
large mesh screen fence for use in bushfire events, there are significant implications in the
outcome of the project to be considered. Due to the inherent danger associated with large
fires, the extreme environment they create, and the dangers presented by structural failure
of such a large object, care must be taken at each stage of design to ensure no oversights
occur.
Thought must also be given not only to the direct factors affecting the effectiveness and
structural integrity, but also to secondary issues that may be posed by the erection of a large
impassable object. For example, while it is necessary for the fence to be effective to seal
entire sections of land with mesh screens, this will also have the negative effect of preventing
movement from one side to the other. This could have disastrous consequences for both
wildlife and humans who may find themselves trapped between a fire and an impassable
wall. Evidently, this should be taken into consideration during the design process to ensure
that this danger is minimized for both animals and humans alike.
In a similar strain, the fence itself should never impair efforts to combat a bushfire. Its
construction should be in such a way that its presence does not interfere with the speed in
which firefighters and their equipment can be deployed to the necessary areas.
This project in itself however, does not pose any significant safety risks. As the methodology
used in testing and designing is through the use of computer modelling and FEA, there is no
Page | 16
2.0
Literature Review
This section of the report will explore the current literature available in the areas which have
been deemed to be relevant to the design and implementation of a bushfire attenuation
fence. The information presented in this section should provide the reader with a fair
understanding of the knowledge which is applied in the development of the design in later
chapters.
2.1
Conditions Inside a Bushfire
In order to successfully design a fence to aid in the defence against bushfire attack, the
conditions that the structure will likely be subjected to must be identified. Without sufficient
knowledge of the conditions, no useful design work can be undertaken.
The main issue presented in developing any design for use in close proximity to a bushfire is
the extreme temperatures which are developed at the fire front. Elevated temperatures
alter the mechanical properties of many materials, generally resulting in reduced stiffness
and strength values; structural and stainless steels included. Therefore, a maximum
temperature likely to be reached by the materials in the fence should identified to ensure
the structural integrity of the fence in operation.
The heat released during a bushfire is transferred to the surroundings through two main
methods; radiation and convection, with conduction having a near negligible effect in
bushfires (Anderson 1969). However, due to the large temperature difference between the
ambient air and the flame temperatures, much of the convective heat is directed vertically.
Because of this, convection only plays a significant role in heat transfer to objects when direct
flame contact occurs.
Like all heat transfer, radiation and convection is driven by a temperature difference
between two objects (Kreith, Manglik & Bohn, 2011). As this temperature difference
decreases, the rate of heat transfer between them also decreases, and reaches zero when
the objects have the same temperature. Therefore, the maximum temperature which the
materials in the fence could theoretically reach is equal to that of the flame temperature of
Page | 17 Research into the flame temperatures that occur in large scale bush and forest fires reveal
that the observed temperatures are typically less than the adiabatic flame temperature
(Poon, 2003). Additionally, the peak temperatures recorded in any given position often only
lasted for between 10 to 30 seconds (Poon, 2003). Elevated temperatures remained for
longer, on the order of around several minutes for test with higher fuel loading. Below is a
figure taken from the results of a test consisting of a 56 200m x 200m plot of dense
shrubbery. Measured heat flux during this test exceeded 7 MW/m (Poon, 2003).
Figure 2-1 Graph Showing Flame Temperature vs Time for Different Heights above Ground Level in an Experimental Test (Poon, 2003)
From the figure above, which shows the recorded temperature vs time at a series of heights
above ground level, it can be seen that the flame temperature only exceeded 500oC for
around 17 seconds, with elevated temperatures remaining around 200oC to 300oC for several
minutes afterwards.
Other experiments yielded similar results, with Mendez-Lopez reporting in his 2003 paper
‘Flame characteristics, temperature–time curves, and rate of spread in fires propagating in a
bed of Pinus pinaster needles’, that small scale trials conducted observing flame
temperatures did not exceed 600oC for greater than 30 seconds in any test. Additionally, the
International Crown Fire Modelling Experiment (ICFME) conducted a large scale experiment
using a 150m x 150m plot of 12m high Jack Pines. They recorded that 10m away from the
[image:17.595.134.462.225.484.2]Page | 18 flux of above 20 kW/m only lasting on the order of 1 minute. The figure below is shows the
recorded heat flux vs time in the ICFME experiment.
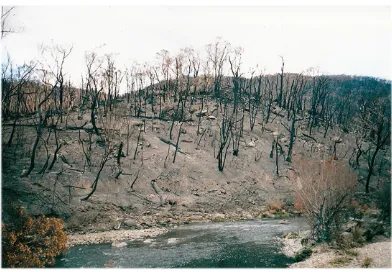
In the 2003 review ‘Predicting Radiation Exposure from an Advancing Bushfire Flame Front’
conducted by Poon, it was explained that the reason for the short duration of peak flame
temperature in any given location is due to the rapid consumption of fine fuels such as foliage
and small branches. These fuels rapidly burn, releasing substantial amounts of heat quickly
but do not last for long, whereas the denser fuels such as branches and trunks release heat
at a slower rate. This explanation is in agreement with the aftermath of bushfires in
Australia, where all of the foliage and small fuels are burnt but trunks and branches remain.
[image:18.595.77.469.475.747.2]This is illustrated in the picture below.
Figure 2-2 Measured Heat Flux vs Time for ICFME Test (Cohen, J. 2000)
Page | 19 From the above literature, it can reasonably be predicted that the maximum temperature
the fence is likely to reach will always be less than the peak flame temperature. This is based
upon two reasons.
Firstly, as the window of peak temperature is rather small, the fence is unlikely to have
sufficient time in any one location to reach a steady thermal state. Secondly, excluding
conditions in which the flames are engulfing the fence, the surrounding air temperature is
going to be at a lower temperature than the fence. This will result in convective cooling of
the fence, assisting in limiting the temperature rise of the fence.
In order to fully characterise the thermal behaviour of the fence in a bushfire, computational
modelling of the fence design should be performed. To proceed with the design of the fence
however, a conservative value will be chosen. As figure 1 shows and the associated studies
show, the peak temperatures of fires typically do not exceed 500oC for greater than around
30 seconds. Therefore, a maximum design temperature of 500oC will be selected.
2.2
High Temperature Effects on Structural Steel Properties
Designing a structure to reliably withstand the conditions outlined in section 2.1 above
requires a detailed understanding of how the mechanical properties of the construction
materials change with elevated temperature. A literature review was then begun to identify
suitable materials which could withstand the design temperature identified. This quickly
revealed that many of the lightweight type materials commonly available were unsuitable,
either due to poor high temperature performance such as in the case of aluminium and
common fibre composite materials, or prohibitively expensive such as in the case of various
specialized high temperature fibre composite resins. Remaining materials that met the
required criteria were various grades of structural steel.
The effects of high elevated temperatures on structural steel have been well investigated,
primarily for the same reason as this literature review; to understand the behaviour of
structural members in the event of a building fire. The findings of several relevant
documents on the mechanical properties of various grades are detailed below.
In a 2006 paper titled ‘Behaviour of high strength structural steel at elevated temperatures’,
Page | 20 steel and mild structural steel at temperatures ranging from 20oC up to 940oC, and compared
their findings with the Australian, American and British Standard models of mechanical
properties reduction in steel structures at elevated temperatures.
The ‘high strength structural steel’ used in their testing was BISPLATE 80, a steel with a
guaranteed minimum 0.2% Proof Strength of 690 MPa and ultimate tensile strength of 790
MPa. The ‘mild structural steel’ used in the paper was XLERPLATE Grade 350, with a
guaranteed minimum yield stress of 360 MPa and ultimate tensile stress of 450 MPa. Both
of these steels are manufactured in Australia and are in common use in Australian
construction, and as such are a good representation of the grades of steel actually available
for the fence construction.
The investigation found that the strength reduction factor (the ratio of elevated temperature
stress divided by room temperature stress) for a 0.2% Proof Load was extremely similar for
both the high strength steel and mild steel up to a temperature of 540oC. A comparison of
their results with the models used in the various standards is shown in figure 2-4 below. Note
the conservative nature of the AS4100 and ASCE standards in the temperature range of
[image:20.595.76.464.452.676.2]300oC to 700oC.
Page | 21 A more interesting result was found when the behaviour of the modulus of elasticity was
investigated. The reduction of the modulus of elasticity of the high strength steel was
dependent upon whether the applied load was steady state or transient. The steady state
reduction factors for both the high strength and mild steels were again very similar, and were
in fact over predicted by the models used in the standards as can be seen in figure 2-5 below.
However, when a transient load was applied to the heated samples of the high strength steel,
the measured modulus of elasticity reduction factor was noted to be much less than the
steady state reduction at the same temperature. In fact, in the region between 100oC and
around 500oC, the reduction in the modulus of elasticity was under predicted by all of the
models used in the standards. Transient testing was not performed on the mild steel so it
was not determined if this also occurs in this metal. This can also be seen in figure 2-5 below.
As the likely loading case of the steel used in the construction of the fence is going to be
transient, this result should be noted and care taken to account for this effect in the design.
Knowing the accuracy and limitations of the models used in the standards in predicting the
reduction factors for the material properties; the equations given by the Australian Standard
AS4100 ‘Steel Structures’, are given below:
Page | 22 The variation of yield stress with temperature should be taken as the following:
Where fy (T) is the yield stress of the steel at a given temperature ToC, fy (20) is the yield stress
of the steel at 20oC and T is the temperature of the steel in degrees Celsius.
The variation of the modulus of elasticity should be taken as follows:
Where E(T) is the modulus of elasticity of the steel at a given temperature ToC, E(20) is the
modulus of elasticity of the steel at 20oC and T is the temperature of the steel in degrees
Celsius.
2.3
Types of Meshes
In Australia, the meshes used in bushfire protection applications must comply with AS
3959-2009; which mandates an aperture size of less than 2mm and must be corrosion resistant
(AS3959-2009). Therefore, the most common material used in these meshes is Stainless
Steel, usually grade 304 or 316. These grades of Stainless Steel exhibit good corrosion, high
temperature properties and affordable cost, making them well suited to this type of
application.
An assessment of the currently available suitable meshes found three main sizes. While the
Page | 23 area’, or porosity, of the meshes available (SSWM 2016). A table showing typical dimensions
of the types of meshes available are shown below.
Type Nominal Aperture (mm) Wire Diameter (mm) Approx. Open Area (%)
Low Porosity 1.64 0.9 42
Medium Porosity 1.67 0.45 62
High Porosity 1.23 0.18 76
Table 2-6 Table Showing Typical Available Bushfire Mesh Sizes (SSWM 2016)
Note that the aperture size of a mesh is different to its porosity, and meshes with large
apertures can have low porosities and vice versa. For example, in the available meshes
above, the lowest aperture mesh had the largest porosity. Mesh porosity is a measure of
the open area of a mesh, and is a function of the mesh aperture and wire diameter. This
relationship is shown below.
𝑝 = (1 −
𝑑𝐿
)
2 2.3.1
Where p is the mesh porosity, d is the wire dimeter and L is the span of the wires from centre
to centre across one cell, i.e. the aperture plus the wire diameter.
While Stainless Steel meshes are the most common type of material used for these meshes,
other materials could also work and may offer advantages over Stainless Steel in a bushfire
attenuation fence application, such as weight, handling and storage. Glass fibre is one such
example which is currently being investigated in a separate project.
An interesting property to note which is relevant when investigating meshes comprising of
fine wires is that the wire material strength tends to increase as the diameter of each
individual wire decreases. For wires made of 316L, an austenitic stainless steel, a correlation
between wire diameter and ultimate tensile strength is shown below (Kraft, 2010).
𝑆𝑢𝑡 = 𝐴𝑑−𝑚 2.3.2
Where Sut is the ultimate tensile strength of the wire, A and m are material properties
(1623.7MPa-mmm and 0.149 respectively for SS316L) and d is the diameter of the wire.
The graph below shows the relationship between wire diameter and ultimate tensile
Page | 24 From the graph it can clearly be seen that at a wire diameter of less than 1 mm, which all of
the bushfire meshes listed in table 2-4 are, the ultimate tensile strength is around the order
of 1600 to 2000 MPa. This is a useful property, particularly in this proposed application due
to the likelihood of large stress concentrations due to the large wind loading.
2.4
Fire Retardant Properties of Wire Mesh
There are two main ways in which small aperture wire mesh can act to reduce bushfire
propagation. These are:
Reducing the transmission of airborne firebrands to potential fuel beds.
Reducing the level of radiant heat flux that the bushfire emits, which subsequently reduces the amount of preheat and drying of available fuel in the path of the fire.
The effectiveness and performance of both these are dependent upon the physical
properties of the mesh, and are further discussed below.
Page | 25
2.4.1
Wire Mesh Defence Against Firebrand Transmission
The creation, transfer and build-up of firebrands against flammable materials during bushfire
events is a significant issue, and is responsible for the ignition of the majority of buildings
lost along with contributing to the spread fire through the creation of additional spot fires
(NIST 2016). An image depicting a simulated firebrand attack against a building is shown
below.
The rationale behind using mesh screens to protect buildings and prevent the spread of
bushfires is quite simple. By creating a barrier in the form of a small aperture mesh screen,
the firebrands which would normally be able to move freely and accumulate are unable to
pass through the openings of the mesh.
The performance of a mesh against firebrand attack is a complex phenomenon and depends
upon wind speed, mesh geometry, average firebrand size and composition, e.g. wood, leaf,
mulch etc.
Several papers have been published which investigate the behaviour of different wire mesh
configurations and sizes against various firebrand attacks. The findings of these papers is
discussed below.
Page | 26 Described in a personal communication, Hashempour and Sharifian used a specially designed
wind tunnel to test the effect of various mesh parameters, including aperture size, on the
transmission of myrtle leaf firebrands.
At the test wind speed of 14.5 m/s second used in the experiments, they noticed an
interesting phenomenon. In contrast with the expected results, the penetration ratio was
larger than one for all the meshes tested, showing a peak value of 3.65 at a mesh aperture
of 2.8 mm before decreasing again as the mesh openings grew larger.
Upon reviewing their results, they identified that the cause of this effect was the fracturing
of the approaching firebrands when they impacted upon the mesh. Rather than remain stuck
in place on the mesh until they had reduced in size enough to allow them to pass through
the mesh; the typical behaviour that had been observed in earlier, lower velocity trials such
as the one by Manzello et. al. in 2011, they found that firebrands which were structurally
weaker or which impacted the mesh at higher speeds had a tendency to break apart into
smaller pieces that could pass through the mesh easily.
However, despite the presence of the mesh increasing the amount of firebrands leaving the
mesh, they are of significantly smaller size after having passed through the mesh. In addition
to contributing to an earlier burn out time due to a reduction in available fuel; Ellis, in his
2012 paper ‘review of empirical studies of firebrand behaviour’, states that the main method
of heat transfer from glowing embers is via conduction. Therefore, a significant reduction in
size of the firebrands is very likely to reduce the chance of ignition of fuel beds.
This result was confirmed by Hashempour in a secondary personal communication detailing
further experiments into fuel bed ignition. Hashempour described two fuel beds consisting
of oven dried cotton cloth was positioned approximately 4.5 m away from various mesh
screens as they were subjected to firebrand attack in a similar manner to the above study,
although at a lower speed of 10 m/s.
Again in this study, an increase in penetration ratio of between 1.23 to 1.28 was found to
occur with mesh with an aperture of 1.61 mm. However, the percentage of firebrands that
was recorded to impact upon the fuel beds was reduced from 74.7%, the result without any
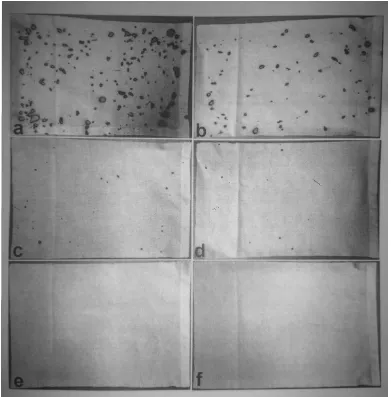
Page | 27 Tests with 1 mm aperture mesh yielded even greater results, completely eliminating the
impact of any firebrands on the fuel beds in one test. Figure 6, taken from the paper is shown
below, revealing state of the fuel beds after one of the tests. Image A and B was with no
mesh, C and D was with the 1.61 mm aperture and D and E was with 1 mm aperture mesh.
From the above results, the authors concluded that the ability of the mesh screens to reduce
firebrand transmission was dependent upon the aperture of the mesh. They also noted that
the mesh alone did not completely prevent firebrands reaching the fuel beds, and that the
mesh exhibited the best firebrand reduction when used in conjunction with a buffer zone
clear of combustible materials, around the order of at least 4.5m; the buffer zone used in the
[image:27.595.125.516.162.559.2]study.
Page | 28 Therefore, it can be concluded that the effectiveness of the design of a bushfire attenuation
fence at reducing firebrand transmission is likely to increase as the aperture size decreases,
regardless of the porosity of the mesh. As the fence is intended to be erected in clear areas,
the requirement of a buffer zone is not a large concern, although should be noted.
2.4.2
Wire Mesh Reduction of Radiant Heat Flux
Wire mesh screens also serve to reduce the amount of radiant heat flux that is transmitted
from the fire front. Primarily, this is achieved by reducing the view factor of objects behind
the mesh to the fire via the obstruction provided by the mesh wires.
Therefore, it follows that the lower the porosity of the mesh, the greater the reduction in
radiant heat flux that would be achieved. This result has been verified by experimental
models in the work of Hashempour et. al (2016).
An interesting result that was identified in their paper ‘Experimental measurement of direct
thermal radiation through single-layer square-cell plain woven screens’ was that the level of
radiation measured to be passing through the mesh was actually less than that indicated by
the porosity of the mesh. This was attributed a ‘tunnel vision’ phenomenon. As the incident
angle relative to normal increases, the wires of the mesh cells come into alignment. This
limits the amount of radiation that can pass each mesh cell, as incident radiation outside of
this view angle is blocked.
Hasempour and Sharifian demonstrated, both analytically and experimentally, that for a
simplified woven wire mesh this view angle is only a function of the mesh porosity, with low
porosity meshes having a smaller view angle. This indicates that the advantage of the tunnel
vision effect in reducing radiant heat flux is more prevalent at lower porosities. The
experimental results of Hashempour et. al. (2016) confirms this; finding that the ‘Passing
Ratio’ of incident radiation (the ratio of measured radiation through a mesh screen vs.
without a screen) for each mesh porosity was always less than the porosity itself, although
Page | 29
2.5
Drag Force on Wire Mesh Screens
A major issue affecting the design of such a fence is the impact of drag force on the mesh
screen. Due to the potential for very high wind speeds around bushfires, as mentioned in
section 2.1, it is important to know the order of magnitude of the force that will be imposed
on the fence by the wind loading.
Drag force of a fluid on an object is defined as the component of force that acts on a body
parallel to the direction of relative motion, caused by the fluids interaction with the body.
(Fox, Pritchard, & McDonald, 2010). Dimensional analysis shows that this force is a function
of a bodies area relative to the flow, the density of the fluid and the velocity with which it is
moving relative to the body. The derived formula for calculating drag force can be found in
any Fluid Mechanics Textbook and is presented below:
𝐹𝐷 = 1
2 𝐶𝑑. 𝜌 . 𝐴. 𝑉
2 2.5.1
Where FD is the drag force, Cd is a dimensionless number called the drag coefficient, ρ is the
fluid density, A is the area of the body and V is the fluid velocity relative to the object. By
[image:29.595.93.503.73.318.2]dividing both sides of this equation by the object area, an expression for the drag force per
Page | 30 unit area can be found. This is a more useful value as it allows for easy comparison
between meshes for design purposes. The formula is:
𝐹𝐷
𝐴 = 1
2 𝐶𝑑. 𝜌 . 𝑉
2 2.5.2
In order to accurately calculate the drag force on the mesh screens using this formula, the
value of the coefficient of drag for each configuration must be known. This number is difficult
to determine for complex shapes and is often done by experimentation or simulation. The
results of two papers that investigated the calculation of drag coefficients for wire mesh
screens are examined below.
In their 2007 paper ‘Computational Simulation of the Wind-force on Metal Meshes’, Sharifian
and Buttsworth used the CFD package FLUENT to simulate fluid flow at various Reynolds
numbers around meshes of different sizes. Three mesh sizes were used, varying the
Reynolds number between 10 and 1000. By calculating the drag coefficients for the meshes
in each flow and comparing them to the theoretical drag coefficient for a single cylinder of
the same respective diameter, they found that the Cd values for the wire mesh were related
to, but always greater than that of the single cylinder. This was explained as a result of the
constraining nature of the additional wires reducing the cross-sectional area available for
airflow (Sharifian and Buttsworth 2007).
Consequently, they showed that the larger the mesh opening, the closer the drag force
approached that of the single cylinder. From this, Sharifian and Buttsworth (2007) proposed
the following correlation for the drag coefficient on a wire mesh as a function of Reynolds
number and mesh porosity:
𝐶𝑑 = −0.491 + 0.47
𝑝1.773 −
7.49 𝑅𝑒0.661+
6.475
𝑝2.244𝑅𝑒0.661 2.5.3
Where Cd is the drag coefficient, corrected for overall mesh cross-sectional area, p is the
mesh porosity and Re is the Reynolds number for the flow. The correlation is reported to be
accurate to 6.5 % within the range of 10 ≤ Re ≤ 1000 and 0.27 ≤ p ≤ 0.82.
Another paper which addresses the prediction of drag coefficient imposed on mesh screens
due to restriction of airflow is ‘The Flow of Air Through Wire Screens’, authored by G. De
Vahl Davis. The paper, published in 1957, experimentally determined the drag coefficient of
wire meshes with different porosities at different Reynolds numbers ranging from
Page | 31 Davis also noted the relationship between porosity and drag coefficient, in addition to noting
that the Cd value begins to approach a constant value as the Reynolds number increases,
much the same way to a cylinder in the range of 400 ≤ Re ≤ 200 000 (Fox, Pritchard, &
McDonald, 2010). From this he proposed the following correlation:
𝐶𝑑 − 𝐶𝑑0= 55
𝑅𝑒 2.5.4
Where Cd is the drag coefficient of the wire mesh, Cd0 is the limit that Cd approaches as
Reynolds number is increased, and Re is the Reynolds number of the flow through the mesh.
To approximate Cd0, Davis assumed the flow to similar in behaviour to sudden expansion in
a pipe flow. By estimating the pressure difference through the momentum equation and
neglecting viscous effects, he found:
𝐶𝑑0= [ 1−𝑝.𝐶
𝑝.𝐶 ] 2
2.5.5
Where Cd0 is the limit Cd approaches, p is the porosity of the mesh and C is a contraction
coefficient to correct for the flow through the constrained area. Davis reports that the value
of C was experimentally determined to be approximately 0.95, steady within the range of
100 ≤ Re ≤ 100 000.
In order to assess the level of agreement of these two correlations, and thus subsequently
determine the most appropriate one to use in the estimation of drag force on the wire mesh
screens, the drag coefficients for the three sizes of wire mesh discussed in section 2.2 was
calculated for a series of Reynolds numbers which corresponded to a range of wind speeds
from 1 to 28 m/s.
0.0 0.5 1.0 1.5 2.0 2.5 3.0 3.5 4.0 4.5 5.0
0 50 100 150 200 250 300 350
Coe ff ice n t o f Dra g Reynolds Number
Comparison of Cd Predictions for 0.18 mm Diameter
76% Porosity Wire Mesh
Davis
Sharifian et. al.
Page | 32 As the three charts above show, there is a reasonable level of agreement between the two
models. While there is significant divergence at lower Reynolds numbers, most noticeable
for the 76% porosity mesh, this large difference begins to disappear at a Re value of between
75 to 150. This discrepancy at low Re values is not of great concern however. As the drag
force formula shows, drag force scales with the velocity squared; meaning that the greatest
drag forces on the mesh will be encountered at high velocities and therefore higher Re
values.
For the 76% and 62% porosity meshes, the correlation proposed by Sharifian and Buttsworth
shows a higher Cd value than the one by Davis in the Re range of 150 onwards, with a
0.0 0.3 0.5 0.8 1.0 1.3 1.5 1.8 2.0 2.3 2.5
0 150 300 450 600 750 900
Coe ff ie ce n t o f Drag Reynolds Number
Comparison of Cd Predictions for 0.45 mm Diameter
62% Porosity Wire Mesh
Sharifian et. al. Davis 0.0 0.5 1.0 1.5 2.0 2.5 3.0 3.5 4.0 4.5
0 300 600 900 1200 1500 1800
Coe ff ice n t o f Dra g Reynolds Number
Comparison of Cd Predictions for 0.9 mm Diameter 42%
Porosity Wire Mesh
Sharifian et. al.
[image:32.595.71.481.76.328.2]Davis
[image:32.595.69.484.315.531.2]Figure 2-12 Graph Showing Cd values for Wire Mesh from Two Different Correlations
Page | 33 maximum percentage difference of 17.6% and 29.0% respectively at a wind speed of 28 m/s.
However, the result of the 42% porosity shows the correlation proposed by Davis to be larger
for Re values greater than approximately 400. The maximum percentage difference again
occurred at 28 m/s, and was found to be 16.1%.
However, it should be noted that the correlation proposed by Davis was only drawing upon
data for Reynolds numbers up to approximately 300. Therefore, the extrapolation of the
formula is done under the assumption that the Cd value does indeed approach a constant
value in the 300 ≤ Re ≤ 1800 range. Likewise, the correlation of Sharifian and Buttsworth
was only trialled within the 10 ≤ Re ≤ 1000 range; while the range of Re for the 41% porosity
mesh was up to 1725 for a wind velocity of 28 m/s.
Therefore, in order to maintain a conservative approach, for any given mesh the larger of the
two Cd values will be used when estimating the drag force. This will ensure a greater level
of confidence in the results of the simulations used in the design process.
2.6
Australian Standards for Temporary Fencing
Before any design work can be undertaken, any standards that are applicable to the
proposed design need to be identified and assessed. This will ensure that no oversights occur
during the design process that could invalidate the outcome of the project. The primary
standard that has been identified as most relevant to the project is AS 4687-2007, Temporary
fencing and hoardings. However, it is quite obvious that the intended application for this
standard is much smaller fences designed for typical fencing type applications. Due to the
requirements for effectiveness against bushfires outlined in the above sections, it is unlikely
that all of the points mentioned below can be reliably met, although it was found to be a
good reference to guide in the design.
The general requirements of the standard can be summarised as follows:
The temporary fencing should remain stable and erect at all times.
Movement and assembly of the fencing should be carried out by a competent and trained person in compliance with the manufactures directions.
The design of any temporary fencing must take wind loading, impact loading and stability into account.
Page | 34 Design specific requirements listed in the standard are summarised below:
Fence infill materials, i.e. mesh screens must comply with their applicable Australian Standards.
The material used in for the fencing frames must comply with AS 1163; Cold Formed Structural Steel Products.
The maximum aperture, i.e. opening size of the fence infill material must be less than 75 mm.
All clamps, hinges and other fittings used must comply with their relevant Australian Standards.
Bracing must be manufactured and installed on the fence when necessary to prevent collapse and misalignment.
Counterweights and base plates used should be designed for the life of the fence, and designed appropriately to withstand the performance requirements above.
Also included in the standard is the testing requirements and procedures that the design of
any temporary fencing must meet. There are six tests that need to be performed to meet
the requirements of the standard. These are detailed in the following subsections.
2.6.1
Simulated Climbing Test
The temporary fencing design must be shown to
be able to withstand the forces and moments
imposed by a person attempting to climb the
fence. The standard stipulates that to test this,
three ‘panels’ of fencing must be assembled,
and a 65 kg load hung from the centre of the
fence at the top, offset perpendicular from the
fence by 400 mm. A diagram showing the
arrangement is shown at right. The fence must
be able to withstand the test for a period of 3
[image:34.595.311.476.451.679.2]minutes.
Page | 35
2.6.2
Impact Loading Test
In this test, a single panel of the fence will be
subjected to a series of impact tests to assess the
fences resistance to overturning, cracking,
excessive deflection and other methods of failure
in the event of a sudden impact. A 37 kg projectile
with a kinetic energy of 150 J (2.85 m/s) must be
impacted against four sections of the fence infill
material, as shown in the diagram at left.
For the fencing to pass the test, the infill material must not show any signs of penetration or
cracking, failure at the joint to the frame, deflect more than 300 mm at the site of impact or
overturn the fence.
2.6.3
Infill Aperture Width Test
To pass this test, the aperture size of the fence infill material must not allow a 76mm x 76mm
block through. As the mesh required to stop firebrands is many orders of size smaller, this
test is not particularly relevant.
2.6.4
Infill Downforce Test
In this test, a downwards load of 1 kN is to be applied to the centre of the infill material and
maintained for a minimum of 60 seconds. For the fencing to pass the test, the infill material
must not deflect greater than 35 mm from its original position.
2.6.5
Wind Force Overturning Test
In this final test, which is arguably the most important criteria for this particular project, the
fence must be subjected to a simulated wind force to ensure that it does not overturn. A
single panel of the fencing must be subjected to the minimum calculated wind force at its
centroid and must resist overturning.
Page | 36 The minimum wind velocity used in the calculation corresponds to the wind speed region in
which the fence is to be deployed, and ranges from 15 m/s for region A to 24 m/s for region
D.
3.0
Project Methodology
This chapter will examine in detail the methodology used throughout the duration of this
project; covering aspects such as the basis of deciding the design criteria, development of
the performance metrics against which the final design will be measured and the analysis
methods used to validate the design.
3.1
Development of Design Specifications
Before any design work could begin, a series of decisions had to be made on how the design
could best meet the specified project aims of:
Reasonable effectiveness in preventing firebrand transmission and radiant heat flux from an approaching bushfire.
Portable, lightweight construction that is capable of being assembled with minimal tools or machinery.
Fast assembly to maximize protective coverage installed prior to fire approach.
Low manufacture cost to create an attractive investment option.
As with any design project, different aims are often contraindicative of one another. In order
to better understand the requirements posed by each design aim, the factors affecting each
of the specific aims are examined in the relevant sections below. Where two aims were in
direct conflict with one another, a decision was made as to which should be prioritized.
3.1.1
Effectiveness at Preventing Firebrand Transmission and Radiant Heat
Flux
From section 2.4 in the literature review section, it is clear that the performance of wire mesh
against firebrand transmission depends upon the opening size of the mesh used, along with
the actual area blocked by the fence. This indicates that in order for the fence to
Page | 37 size should be chosen. Additionally, the fence should be of a such a height that lofted
firebrands and those generated by foliage from nearby trees in a bushfire are adequately
constrained by the mesh.
While opening size is not necessarily related to porosity; meaning opening size is somewhat
independent of drag, increasing the height of the fence does effect the drag force, increasing
the frontal area of the mesh, while also shifting the centre of pressure further away from the
base. This would result in higher stresses in the structural members by creating a larger
bending moment.
In order to insure the effectiveness of the fence at limiting firebrand transmission, it was
reasoned that the design height should be similar to that of the surrounding trees in order
to prevent embers created in crown fires from passing over the fence. However, as the
primary tree type in Australia and many other parts of the world where wildfires are a serious
concern, e.g. California, are Eucalyptus (Gum Trees); and many species of eucalyptus tree
can grow to heights of in excess of 20 metres, it was unlikely that this could practically be
achieved.
In a document detailing fire risks in blue gum plantations, it was stated a fire hazard was not
particularly posed by the trees in the plantation until around 3 to 4 years, when the trees
were considered ‘mid rotation’ in the plantation cycle. Trees at age 4 years had an average
height of 7 to 9 metres and those at 6 years which posed an even greater fire hazard had an
average height of 14 to 18 metres (Mar & Adshead, 2011). Therefore, a minimum design
height of 10 metres was chosen as this would offer a compromise between fire protection
and the other listed design aims.
Also indicated in section 2.4 is that the effectiveness of wire mesh at blocking incident radiant
heat flux is dependent upon the porosity of the mesh used, with lower porosity meshes
offering an increasing protection through the reducing view factor.
However, the literature indicates that the drag force coefficient of the mesh grows quite
substantially with decreasing porosity. This creates an issue as higher drag forces require
stronger supports and structural members; making the aims of high portability, lightweight
and ease of construction difficult to realize.
Given the evidence identified in the literature review suggesting that the main cause of fire
spread and house fire ignition is the accumulation of firebrands and not radiant heat flux,
Page | 38 radiant heat flux. Given the short duration of the radiant heat associated with the fire front
versus the persistent nature of the firebrands, this was considered a pragmatic approach.
3.1.2
Portable Lightweight Construction Capable of Assembly with Minimal
Tooling and Machinery
As this method of combating bushfires is still in its infancy, the aim of this project is to
develop a serviceable design capable of being deployed in a variety of conditions and
locations in order to field test the concept against actual bushfire conditions. Due to the
often remote location of bushfires and the properties they threaten, portability and ease of
construction are extremely important factors for allowing both testing of the overall concept
and the defence of property. If the concept gains sufficient evidence in actual situations to
support its widespread use, more permanent and elaborate designs requiring a higher level
of mechanized equipment may be justified.
Portability in this case has been taken to mean the ability to both transport the components
to and from the required location and assemble the design without necessitating any
specialized vehicles, e.g. a crane or similar machine. The vehicles that are considered to be
readily available are those such as utes, trailers and flat-bed trucks. Therefore, the design
should not be larger or heavier than which would allow a reasonable sized section of fence
to be easily carried by one of these vehicle types.
A logical extension of the requirement for portability is the minimization of the tools or
machinery required in the assembly of the fence. Where possible, design decisions have
been made to eliminate the necessity of equipment that is large, difficult to transport,
prohibitively expensive or requiring additional infrastructure. Permitted was hand held tools
which could be easily be carried; powered either through individual battery packs,
connection to a vehicle fitted with an inverter, or a small portable generator.
Additionally, no single part of the design should be heavier than can safely be carried by a
two-man team. Currently, under the Australian Work Health and Safety legislation there is
no upper limit to the weight that a person or persons can carry, stating that this depends
upon the physical capabilities of the individuals (Worksafe Australia, 2016). Therefore, as
guidance on what could be considered as a reasonable weight, Piyush G. Chapla’s 2004 paper
‘How Much Weight is Too Much for Manual Lifting: Determining a Weight Limit Guideline for
Page | 39 The final guidelines reported state that: up to 30.8 kg (68 lb) is the recommended maximum
weight for a single person, between 31.3 kg to 72.6 kg (69 lb to 160 lb) is the recommended
range for a two-person lift, between 73 kg to 90.7 kg (161 lb to 200 lb) the recommended
maximum for 3 people and anything over 90.7 kg (200 lb) lifting in any team arrangement
was not recommended.
Taking the middle of the range given for the maximum two man-team lift means that a
maximum weight limit of approximately 50 kg should be should be applied to any given part
of the design. However, where possible the weights of components will be minimized to
reduce the effort required to assemble the fence.
3.1.3
Fast Assembly to Maximize Protective Coverage Prior to Fire
Due to the unpredictable and rapid way in which bushfires can develop, any defensive
strategy must be able to respond in a quick manner to changing conditions and posed
threats. Therefore, the proposed design for a bushfire defence fence must be such that an
adequate level of coverage can be established in the relatively short period between the
issue of a bushfire alert and the approach of the fire front, without endangering those people
installing the fence.
This requirement is very hard to quantify as the factors affecting it are highly variable. The
period between the issuing of a bushfire alert to its impending approach can vary between
hours and days. What might be deemed an acceptable level of coverage depends upon the
specific application for the fence. For the defence of a single property, a perimeter of
approximately 200 metres may suffice, while for a more organized effort for fire containment
by firefighters may require a stretch of fencing along a firebreak of up to several kilometres.
As this project is the first of its kind, and aims to develop a design suitable for use as a proof
of concept, the fence design must be capable at least of being installed as a defensive
measure for a single property; or several properties in close proximity. This should be
capable of being achieved within the period of a single day, at most 6 to 8 hours.
3.1.4
Low Capital Cost to Attract Market Investment
Given the financial and human costs that are associated with bushfires, significant interest is
anticipated in wire mesh fencing as a bushfire defence strategy once its efficacy has been
Page | 40 however, there may be some hesitation to invest large sums of money into such a project
with no guaranteed success.
The design should keep this in mind and aim to minimize costs associated with the fence
materials, manufacture and related equipment in order to maintain appeal to investors and
other interested parties. This will encourage widespread testing of this bushfire defence
concept and pave the way for more involved designs requiring higher levels of organization
and investment.
3.2
Development of Design Assessment Criteria
Given the listing of the specific design aims above, a series of performance metrics was
established in order to measure how well the final design met these design aims and to
create a baseline assessment against which potential future designs could be compared.
3.2.1
Efficacy of Firebrand Transmission Prevention
As the primary purpose of the fence is to retard bushfire progress through re