Contents lists available atScienceDirect
Powder Technology
j o u r n a l h o m e p a g e : w w w . e l s e v i e r . c o m / l o c a t e / p o w t e c
Discrete element simulation and experimental study of powder
spreading process in additive manufacturing
S. Haeri
a,*
, Y. Wang
b, O. Ghita
b, J. Sun
caDepartment of Mechanical and Aerospace Engineering, University of Strathclyde, Glasgow G1 1XJ, UK
bCollege of Engineering, Mathematics and Physical Sciences, University of Exeter, North Park Road, EX4 4QF, UK
cSchool of Engineering, University of Edinburgh, Edinburgh EH9 3JL, UK
A R T I C L E I N F O
Article history:
Received 26 July 2016
Received in revised form 10 October 2016 Accepted 5 November 2016
Available online 9 November 2016
Keywords:
Additive manufacturing Discrete element method Laser sintering 3D printing Powder spreading
A B S T R A C T
Powders used in additive manufacturing (AM) are spread onto a compact layer of particles for sintering and this process is repeated layer by layer to form the final products. Spreading of rod-shaped particles in realistic AM settings is simulated using the discrete element method (DEM) to investigate the effects of particle shape and operating conditions on the bed quality, characterised by its surface roughness and solid volume fraction. It is discovered that larger particle aspect ratios, Ar, or higher spreader translational
velocities result in a lower bed quality, i.e. a larger surface roughness and a smaller volume fraction. The surface roughness increases monotonically with Ar. However, the volume fraction exhibits a maximum at
Ar = 1.5 for randomly packed powder beds that are formed by the roller type spreaders moving at low
translational velocities. It is also found that a roller outperforms a blade spreader in terms of the quality of the prepared bed at the same operating conditions. The micro-structural analysis of the beds also shows particle alignment in response to the induced flow, which is qualitatively confirmed by a set of purposely-designed experiments. In addition, a shape segregation is documented for powders with mixed aspect ratios (Ar) such that particles with larger Artend to accumulate on the upper layers of the bed.
© 2016 The Authors. Published by Elsevier B.V. This is an open access article under the CC BY license (http://creativecommons.org/licenses/by/4.0/).
1. Introduction
Additive manufacturing has recently been exploited by various industries, such as automotive, aerospace and medical, as a novel production technology. Powder bed laser sintering (LS) or laser fusion is one of such promising AM techniques. It uses polymeric or metallic particles, heated to just below their melting temperature and spread on a fabrication piston to form a thin particle bed using a counter-rotating roller or a blade. A laser beam is then focused onto the bed and scans a raster pattern of a single layer of the final part. After sintering the fabrication piston lowers the part slightly and a new layer of powder is applied. The process is repeated until the product is successfully fabricated[1].
The technology offers substantial benefit for rapid production of prototypes and more recently for weight-sensitive/multi-functional final parts at small-volumes, with almost arbitrary complexity[2]. There is a growing demand for adoption of the technology. However, insufficient understanding of the multi-physics processes involved
*Corresponding author.
E-mail addresses:[email protected](S. Haeri),[email protected] (Y. Wang),[email protected](O. Ghita),[email protected](J. Sun).
in the LS which comprise granular flow (spreading), heat transfer, phase change and surface phenomena, is hindering further develop-ment of the technology and introduction of new materials[3]. Such limitations result in expensive trial-and-error calibrations, uncer-tainty in the quality of final products and slow production rates due to interrupted builds.
The spreading process has a major impact on the characteristics and quality of the final product. The determining parameters are the solid volume fraction of the bed and smoothness of its sur-face since higher porosity or large roughness can lead to weaker bonding between layers and hence a poor mechanical performance. The importance of the layer smoothness and compactness has been demonstrated by Berretta et al.[4]using a new grade of Poly-Ether Ether Ketone (PEEK) in various spreading experiments. Ziegelmeier et al. [5] also reported strong connection between the powder volume fraction and the porosity of the sintered parts. They also demonstrated that the part’s surface quality is highly dependant on the roughness of the powder bed.
The first analytical model, close to the LS method of operation, was developed by Johanson[6]to predict the behaviour of granu-lar materials undergoing continuous shear between two rollers (see T-Dec et al.[7]for a review), and has been extended to compaction between a roller and a flat plate[8]. These models, however, treat
http://dx.doi.org/10.1016/j.powtec.2016.11.002
46 S. Haeri et al. / Powder Technology 306 (2016) 45–54
powder beds as continuous media described by macroscopic conser-vation equations to calculate quantities such as stress distribution or bulk density within the bed. Therefore, the effects of particle shape and micro-structure on bed quality cannot be directly evaluated.
The development and performance of new material for the LS have also been the subject of a few experimental studies without linking to the spreading process itself. For instance, Wang et al.[9] studied the mechanical and thermal properties of graphite platelet reinforced PEEK (PEEK/GP). They showed that despite a higher poros-ity, the tensile strength of the composites is improved (maximum 36% improvement for 5 wt.% GP). Wang et al.[10]also studied the laser sintered glass bead filled Polyether ketone (GB/PEK) composites and showed up to 7% increase in hardness can be achieved without reducing its tensile strength.
Recently the DEM has been applied to the spreading problem to investigate the effects of particle level phenomena on the bed quality. Partelia and Pöschel[11]performed full device DEM simula-tions and found that the larger translational velocity of the roller and broader particle size distribution lead to larger surface roughness. Xiang et al.[12]simplified the process by considering an assembly of 4000 spherical particles undergoing three processes in their DEM simulations: random packing, layering and compression. Focusing on the effects of particle size distribution and considering mono-sized, bimodal and Gaussian distributions of spherical particles, they showed that the solid volume fraction increases with layer thickness regardless of the size distribution type.
In this paper, the spreading of non-spherical particles in AM is studied using DEM simulations. A commercial grade and two types of custom-milled PEK/PEEK powder particles are characterised experimentally. Based on these experiments rod-shaped particles are chosen for the simulations. The effects of spreading devices (roller or blade), their translational velocity and the bed thickness on the surface roughness and bed volume fraction are identified. It is found that a larger translational velocity generally reduces the bed quality and hence a lower value is suggested. This will how-ever, adversely affect the production rate. In addition, it is found that the rollers produce powder beds with significantly better qualities and this is related to the contact dynamics between the spreader and the bed. The bed micro-structure in terms of particle orientation is analysed and an alignment phenomenon is observed and related to the bed response to the particle shape and the spreader velocity. Spreading experiments with rod particles are performed to qualita-tively validate the particle alignment phenomenon. Finally, a mixture of rod-shaped particles with different aspect ratios is considered to study the shape segregation phenomenon. This analysis show that mixing particles with different shape/size distributions to control the bed quality may not be effective due to particle segregation in different layers of the bed.
It is also important to note that Parteli and Pöschel[11]earlier used similar DEM techniques to simulate the same process – admit-tedly with more realistic particle shapes. However, in this paper we have performed extensive parametric studies to characterise the process. Several adjustable parameters, available to device users, which are commonly used for tuning the process are considered and their effects on the bed quality are documented. In addition, we believe this is the first study that uses detailed micro-structural analysis to explain the complex dependence of bed quality on the aforementioned adjustable parameters and also on particle shape (at least for elongated particles).
2. Particle shape characterisation
PEK, PEEK and their composites have received significant atten-tion in AM recently due to their good strength, stiffness, thermal, mechanical and chemical resistance[4,9,13-17]. This motivated us to
characterise the shape of three different variations of these particles. This will also provide the basis for choosing the particle shapes in our numerical simulations. The commercial grade EOS HP3 PEK in addi-tion to disk- and impact-milled 450G PEEK particles are considered. A cryogenic pulveriser (Powder King PKA-18) composed of a station-ary and a rotating (at 30 Hz) disk with their gap set to 0.127 mm and its chamber cooled to−50◦C was used to disk-mill the grade 450G PEEK granules supplied by Victrex Plc. A 100 UPZII Universal Impact Mill (Hosokawa, Germany) operating at room temperature with a 2 mm sieve size and a blade rotation speed of 14,000 rpm was used for the impact milling.
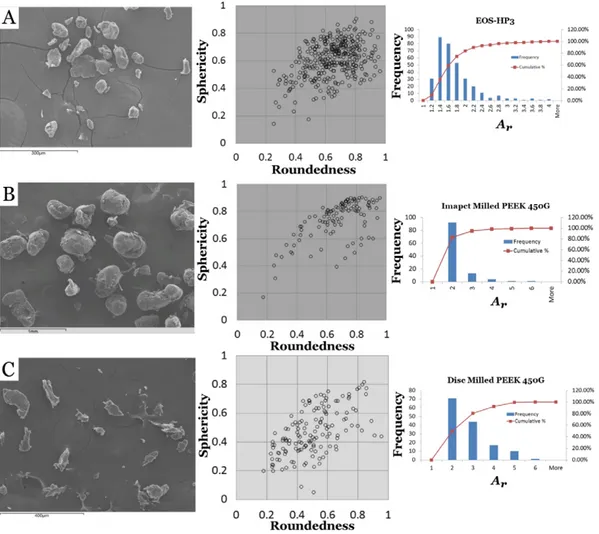
The shape characterisation was performed in ImageJ software [18]analysing images obtained using a Scanning Electron Micro-scope (SEM) device (Hitachi S-3200N) under 20 kV acceleration voltage and with all samples coated with a 10 nm gold/palladium layer.Fig. 1shows the results of this analysis. For the EOS HP3 PEK, both sphericitySand roundednessRare accumulated in the inter-val [0
.
6, 0.
8] showing properties of elongated particles with round edges. Aspect ratios are concentrated around Ar= 1.
5 with a notabletail extending to a Ar= 3
.
0. Impact milled PEEK particles have thehighest degree of sphericityS≈0
.
9 and regularity with nearly 90% of particle having Ar ≈2. The disk-milled particles are quiteirregu-lar with the sphericity and roundedness spread between 0
.
2<
S<
0
.
85 and 0.
15<
R<
0.
95 respectively. However, accumulation on a diagonal line still characterises elongated particles and in fact the aspect ratio histogram shows a wide log-normal like distribution with mean value Ar≈2.
5 and a tail extending to Ar= 5.The results of these analyses show that elongated particles with a major axis and round edges are good approximations to the milled PEK/PEEK particles. Therefore, rod-shaped particle generated with a multi-sphere approach are chosen for the simulations (see Section 3.1).
3. Methodology
In this section the DEM technique is discussed first. Then the simulation and post-processing procedures are specified and their parameters are discussed in the relevant sections in detail. Never-theless, a summary of important simulation/post-processing param-eters is provided inTable 1for reference.
3.1. Discrete element method
The Large-scale atomic/molecular massively parallel simulator (LAMMPS) code[19]is used for all the DEM simulations in this paper. Firstly, note that a distinction between a sphere and a particle is made since we will consider non-spherical particles created with a set of spheres. Therefore, a spherical/non-spherical particle is formed from one/or more spheres. A linear Hookean spring-dashpot contact force model is applied to each pair of spherespandqwhenever the two spheres overlap, i.e. whendpq = Rp+Rq−rpq
>
0, where rpq=rpq,i=rp,i−rq,i1, and•represents the Euclidean norm(magnitude) of any vector. In addition,Rk,k ∈ {p,q}, is the radius
of thekth sphere andrk,iis the position vector of its centre of mass
(CoM). The normal and tangential components of spring-dashpot force are given by
Fn
pq,i=jndpqnpq,i−cnm∗vnpq,i (1)
Ft
pq,i=−jtutpq,i−ctm∗vtpq,i, (2)
1 A tensor notation is adopted throughout this paper. For examplerp ,iwithi∈
Fig. 1. Characterisation of particle shapes for (A) EOS HP3 PEK, (B) impact-milled PEEK and (C) disk-milled PEEK. For each particle type a representative SEM image, sphericity versus roundedness and also the aspect ratio distribution is presented.
wherejn,cn,jtandctare spring elastic and damping constants in
normal and tangential directions respectively. In addition,vn pq,i and vt
pq,iare relative normal and tangential velocities. The effective mass
is defined asm∗ = mpmq
/
(mp+mq) wheremk,k ∈ {p,q}, is themass ofkth sphere. The unit normal vector in the direction of the line connecting a pair of sphere centres is presented bynpq,i and
elastic shear displacement byut
pq,i. The tangential force is limited to
Ft
pq,i≤lcFpqn,iwherelcis the Coulomb friction coefficient.
Simi-larly, a normalFn
pw,iand a tangential forceFnpw,iare defined between
spherepand the bottom wallw.
The spring-dashpot model is chosen in this study due to its low computational costs. Despite the simplicity of the model, Di Renzo and Di Maio[20]showed that if the parameters of the model are accurately chosen, the model performs as well as the full Hertz-Mindlin and Deresiewicz model – and better than the simpler ver-sions of this model – as long as the details of collision forces are not relevant (for example in particle breakage). In this study we are only considering the dynamics of the bed and hence the use of linear model is justified. The details of calculating model parameters are discussed later in this section.
The DEM is traditionally formulated for spherical particles which is due to the availability of efficient collision detection algorithms and well defined tangential and normal contact forces (Eqs. (1) and (2)). However, shape effects are considered in this paper and hence, a versatile multi-sphere technique is used, seeFig. 2. The contacts are still detected between sphere pairs in this technique. However,
instead of integrating the Newton’s laws of motion for each sphere, a total force and torque around the CoM of each non-spherical (here rod-shaped) particle is calculated by adding-up individual contact
Table 1
A summary of simulation and post processing parameters with a short description. This is provided only for reference and the parameters are explained in detail in the text. In addition, all the dimensional parameters are reported in SI units.
Parameter Description Value
jn Normal Spring Constant 1500 E Coefficient of Restitution 0.5
cn Normal Dash-pot Constant Eq. (5)
jt Tangential Spring Constant 2/7jn
ct Tangential Dash-pot Constant 1/2cn
lr Rolling Friction Constant 0.005 Dsph Sphere diameter (for rods) 10−4
qrod Particle Density 1300
Sphere Overlap 0.5 (in simulations)
msph Sphere’s Mass Eqs. (6) and (7)
Ar Aspect ratio ∈ {1.0, 1.5, 2.0, 2.5} Lx,Ly,Lz Domain size inx,y,z 2.46×10⁻³, 0.04, 0.03
dinit Layer thickness (before spreading) 10Dsph Dr
sph,Dbsph Sphere diameter (roller/blade) 5.026×10⁻⁵
dspreader Spreader Displacement ∈ {4, 5}Dsph
Droller Roller Diameter 200Dsph
zmin Bottom Plane Location Not relevant ymin,ymax Min/Max Particle Location iny Sim. Dependent
48 S. Haeri et al. / Powder Technology 306 (2016) 45–54
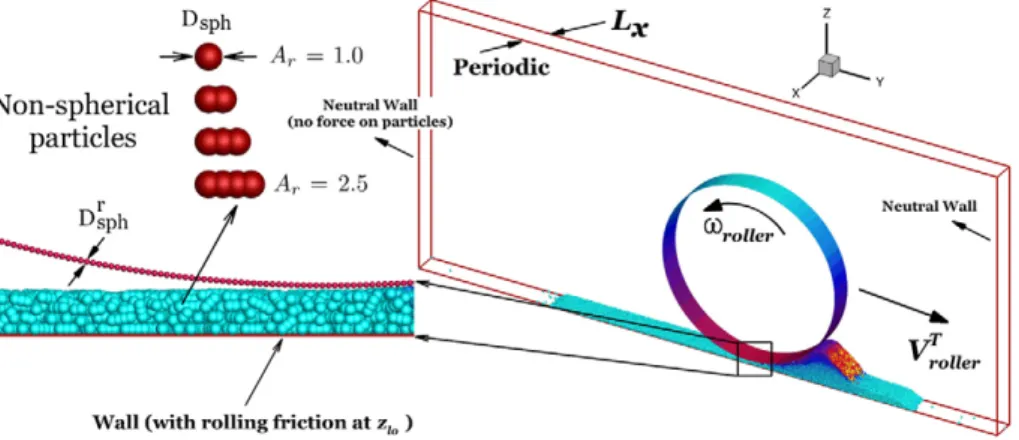
Fig. 2. A representation of the device simulation set-up. The non-spherical (rod-shaped) particles with different aspect ratios Ar, which are approximated using a multi-sphere
technique are presented. The particles are coloured in the representative simulation (on the right) with their velocity magnitude. A section of the spreader with a widthLxis simulated.
forces of its constituent spheres. The CoM position of each rod is then updated using Newton’s laws of motion and the location of individual spheres is updated assuming rigid-body dynamics.
The simulation set-up is depicted inFig. 2. The bottom bound-ary is a rigid wall that exerts a normal and a tangential force on the spheres (equivalent to assuming an infinity large sphere in Eqs. (1) and (2)). To prevent unbounded rotation of particles on the bottom wall, a rolling friction model is implemented. The adopted model constantly applies a resistive torque to the spheres in contact with the bottom wall, which is given by[21–23]
Tpw,i=−lrRpFpwn ,i yrel
i yrel
i
.
(3)In Eq. (3)yrel
i is the relative angular velocity between particlep
and the bottom wallwandlr= 0
.
005 is used for all the simulations.This value is chosen based on the analysis of Zhou et al.[21]to yield a travelling distance of approximately 10Dsph. Particles are usually spread on previous layers which are not smooth. Therefore, it is not expected that particles freely roll for long distances. In the absence of experimental measurements this is a reasonable assumption. In addition, this parameter mainly affects the characteristics of the bed on the edges – where significant rolling may take place – which are excluded from post-processing (seeSection 3.3.)
The elastic spring constantjn, in Eq. (1) is set according to[20]
jn=16
15 √
R∗Y∗
15m∗V2 c
16√R∗Y∗ 1
5
, (4)
and the dash-pot constant is calculated as
cn=
4jn(lnE)2
m∗[p2+ (lnE)2], (5)
where 1
/
R∗ = 1/
Rp + 1/
Rq, 1/
m∗ = 1/
mp+ 1/
mq, 1/
Y∗ =1−m2 p
/
Yp+1−m2 q
/
Yq. In addition,Y,E,mandVcare the Young’smodulus, coefficient of restitution, Poisson ratio and a characteristic velocity respectively. The coefficient of restitution is set to 0.5. The values of Young’s modulus and Poisson ratio are set to 3.7 GPa and 0.4 for all particles which are typical values for PEEK polymeric par-ticles [24]. AssumingVc = VrollerT orVbladeT , Eq. (4), yields jn ≈
1500N/m depending on the roller velocity. Therefore, a constant value of jn = 1500 is adopted for all the simulations.
Tangen-tial force constants jt and ct are respectively set to 2
/
7jn and1
/
2cn(see Shäfer et al.[25]for details). Note that the mass of each individual sphere is adjusted in the simulations bymsph=qrodVrod
/
Nsph, (6)such that the density of all particles shapes remain equal toqrod=
1
.
3 gr/cm3, (i.e. the PEEK density[24]). The analytical volume ofrod-shaped particles is derived as
Vrod=
NsphpD3 sph
6 −
2(Nsph−1)ph2
3
3D sph
2 −h
, (7)
where,h=
Dsph
/
2,Dsphis the sphere diameter andNsphis the num-ber of spheres that constitute the rod andis the amount of overlap relative toDsphbetween the spheres (
= 0
.
5 for all rod-shapedpar-ticles use in the simulations, seeFig. 2). Due to this adjustment of masses,cn values in Eq. (5), are calculated for rods with different
aspect ratios based on their correspondingm∗.
3.2. Simulation set-up
Rods with various aspect ratiosAr= 1
.
0, 1.
5, 2.
0, 2.
5 are createdby overlapping spheres with
= 0
.
5 (Fig. 2). The initial configura-tion (before the spreading starts) is prepared by pouring randomly generated particles within a simulation box with dimensionsLx =2
.
46×10−3,Ly = 0
.
04 andLz = 0.
03 on the bottom wall. Notethat all values are in SI units except otherwise stated. The geomet-ric parametersLx,LyandLzare the width, length and height of the
simulation box (red boundaries inFigs. 2and3). The box size in flow-directionLychanges to accommodate all particles as they are spread
and the left and right walls (iny-direction) exert no force on the particles. The number of rods in each simulation is adjusted to sup-ply an initial thickness ofdinit≈10Dsphfor all particle types. During
the spreading process the height of the powder heap accumulated in front of the spreader may reach to half its diameter/height or slightly more. The value ofdinit is chosen such that the height of the front
particle heap remains bounded to 1
/
2Droller.The spreader is simulated using a set of rigidly moving spheres. A roller is created using 61250 spheres withDrsph= 5
.
026×10−5thatmove with predefined translationalVT
rollerand rotationalyroller =
2VT
roller
/
Droller velocities. Similarly, a blade is created with 98,000particles Db
sph= Drsph
and a thickness of 10Dbsph (Dsphb=Dsphr)
which moves with a constant translational velocityVT
blade. This set-up
Fig. 3. Definition of parameters used in the post processing. The bed thickness,drollerand the geometric parametersymin,ymax,ylo,zhi,zloare presented. The ray’s locations and
the domain extent in y- and z-directions (Ly,Lz) are shown in this figure. These parameters are defined similarly for the cases with a blade spreader.
(i.e. different Ar). The simulations are performed for mono- or
poly-dispersed particles where rods withAr = 1
.
5, 2.
0, 2.
5 are mixedwith fractions 0
.
5 : 0.
35 : 0.
15. It is worth mentioning that in this paper we are only considering shape effects. Therefore, the term “poly-disperse” refers to particles with different aspect ratios.3.3. Post-processing
The particle volume fraction,0, and surface roughness4of the bed are investigated in this paper and used as a measure for effectiveness of the spreading process. This is defined by a high0(close to the crit-ical volume fraction) and a low4value (smooth surface). It is in fact, possible to incorporate both parameters in a single variable. If the particles bounded by the bottom wall and a plane tangent to the top particle layer (i.edspreader=zhi, where spreader∈ {roller, blade}) are
considered, a larger roughness would be equivalent to a smaller0. However, here the first approach is taken since a single value will be too sensitive to how the tangent plane is defined. Therefore, to calcu-late0those particles that are bounded in a box defined byzlo=zmin,
zhi=zmin+dspreader−Dsph,ylo=ymin+Drollerandyhi=ymax−Droller
are selected. Here,dspreaderis the roller displacement from the bot-tom (required layer thickness), seeFig. 3. For consistencyyloandyhi
are defined withDrollerfor both types of spreaders. Also,yminandymax
are the minimum and maximum locations of particles on the bot-tom wall along y-direction. Definingyloandyhieffectively limits the
analysis to only a subset of particles away from the edges and sup-presses the end effects. In fact, this is a reasonable assumption since the full extent of the bed in not normally used for fabrication.Table 2 summarises the effects ofylo location on the value of0. Near the edges0is a strong function ofyloas expected. However, by adding a displacement ofDrollerthe edge effects are satisfactorily suppressed.
It is worth mentioning that to manage the computational costs, a
Droller
/
Dsph= 200 is adopted withDsph= 0.
1 mm which is smaller,but of the same order of magnitude of the typical ratioDroller
/
Dsph≈500−1000 used in a LS device. The chosen ratio is also tested to confirm that it is large enough to guarantee independence of the results.
The surface roughness4 is measured using a ray-tracing tech-nique where 10 rows (in x-direction) of light sources are evenly
Table 2
Independence of the results from the choice ofylo. The results are obtained for the case
with Ar= 2.0,VrollerT = 0.03 anddroller= 4Dsph. The cut-off length is defined with
reference toymin; e.g. a cut-off of 0.25Drollermeansylo=ymin+ 0.25Droller. The value ylo=ymin+Drolleris used for all the simulations. Similarlyyhi=ymax−Drolleris used
to bound the post-processing box as explained inSection 3.3.
Cut-off 0 0.25Droller 0.5Droller 0.75Droller Droller 1.25Droller
0 0.4123 0.4385 0.4683 0.5023 0.5109 0.5099
distributed on the top plane. Each row consists of 500 equally dis-tanced sources (seeFig. 3) in y-direction which provides 5000 data points in total. Each ray intersects the bed at a specific heighthand the standard deviation ofhnormalised byDsph, is defined as a
rough-ness i.e.4=(h− h)2
/
Dsphwhere averages are calculated over
all data points.
For micro-structural analysis inSection 4.2an orientation vector – a unit vectorgi, in the direction of particle’s major axis – is defined, seeFig. 6a. In addition, a probability density function (PDF) for spatial distribution of orientation vectorsgican be defined according to[26]:
P(gi) =
1 4p
D+Dijgigj+Dijkgigjgkg+· · · , (8)
where equations forDi0···in tensors of ordern= 0· · ·6 can be found
in[26]. For the current analysis,P(gi) has been reconstructed up to
the fourth-order.
4. Results and discussions
4.1. Bed quality
In this section, the effects of particle shape on the bed solid vol-ume fraction 0 are investigated. The results of these simulations are presented in Fig. 4a. First note that for all roller simulations a maximum volume fraction is observed at Ar = 1
.
5 which isindependent ofdrollerand is more pronounced at lowerVT roller. This
behaviour closely follows the predictions of the random-packing the-ory for spherocylinders[27]. Similar dependency of0on Arare also
observed in experiments on random-packing of ellipsoids[28]. After this peak,0declines consistent with the trend of the random close packing density against aspect ratio. For a given particle shape, the key control parameter is found to beVT
rollerwhich can significantly
influence the bed quality. It is shown that a higher roller translational speed yields a bed with higher imperfections on the surface and a smaller density (Fig. 4). These are the indications of a poor spreading which ultimately results in poor mechanical performance. Of course, the smallest possibleVT
rollercannot practically be applied since there
is a trade-off between the production rate and the quality. There-fore, optimal values should be chosen depending on the operational constraints.
The4values are plotted onFig. 4b. Interestingly, for spherical par-ticles,4is a weak function ofVT
rollerbut by increasing Arthis
function-ality becomes much stronger. The investigation of micro-structural characteristics of the system is provided in the next section which illuminates the complex response of4to the investigated parame-ters. The same behaviour is observed fordrollerwhich has negligible
effects on the roughness for Ar≤1
.
5 but the effects become strongeras Arincreases.
Two different cases are also considered for a blade spreader with
VT
50 S. Haeri et al. / Powder Technology 306 (2016) 45–54
(a) Volume Fraction
(b) Bed Roughness
Fig. 4. The effects of particle shape,VT
spreader,dspreaderand the spreader type on the bed quality. The quality is quantified by a volume fraction0and a roughness parameter4.
Firstly, note that the0curve does not show a similar maximum at Ar= 1
.
5 and also a significantly larger4is observed, seeFig. 4a andb, compared to the roller at the same operating conditions. The large surface disturbances generated by the blade penetrate as deep aszhi
(Fig. 3) and hence, in the volume selected for the calculation of0, close packing characteristics are not observed. Secondly, note that the bed quality is seriously degraded (lower0and larger4) using a blade compared to a roller at same operating conditions.Fig. 5shows a snapshot of both spreaders in contact with the bed. Clearly, the roller provides a large contact area and allows for gradual particle rearrangement. Conversely, the blade, mainly interacts with the bed at a single point (its edge), dragging the particles as it moves which leads to greater roughness4. A larger Ar exacerbates the problem
(seeFig. 4b) and a thicker blade does not solve the single point con-tact problem. Finally note that, an increase inVT
bladeand reduction
ofdblade, similar to the roller case, significantly reduce the volume fraction0but have a milder effect on4. This is perhaps due to the dominant dragging effect as explained earlier. Note that, for example for Ar = 2
.
5, the roughness reaches a value of 0.
59Dsphandphysi-cally this can not be substantially increased except if there are deep and wide cracks in the structure of the bed.
4.2. Microstructural analysis
4.2.1. Simulation results
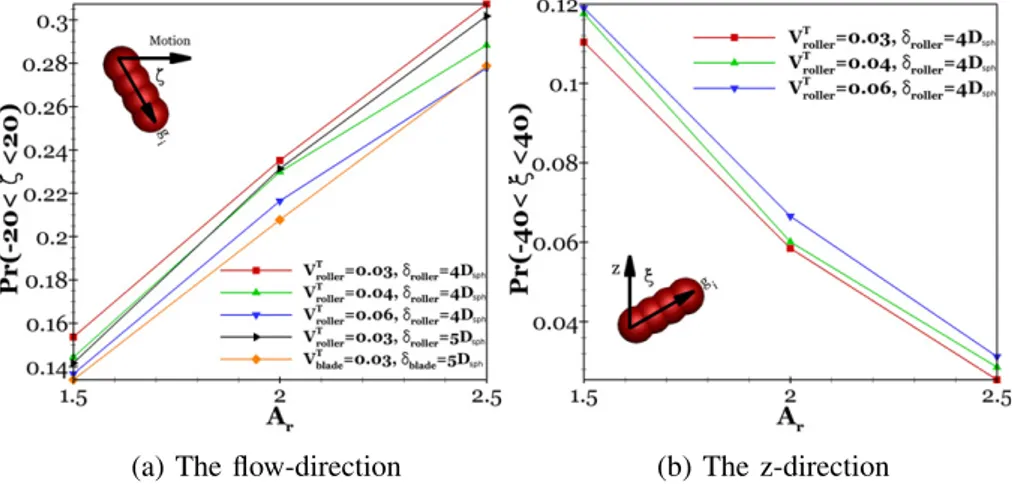
In this section the micro-structural behaviour of particles undergone the spreading process is discussed. Fig. 6a shows the
probability of finding the vector representing a rod’s major axis within a 20◦ deviation from e2 = (0, 1, 0) (i.e. the particle
flow/spreading direction). Note that for an isotropic distribution of
gi, PrI(f
<
|a|) can be analytically derived as 1−cos(a). Now,set-tinga= 20◦, one obtains PrI(f
<
|a|)≈0.
06.Fig. 6a clearly showsthat PrI(|f|
<
20◦)<
Pr(|f|<
20◦) for all aspect ratios and hence,particles are aligned in flow direction. To show that this alignment occurs during the process the value of Pr(|f|
<
20◦) is calculated for the initial particle configuration.Table 3shows the result of this calculations. The initial Pr(|f|<
20◦) values are smaller than all the values reported inFig. 6a, which confirms that the spreading process increases the alignment in the spreading direction. Similar alignment to the flow direction has also been reported in numerical simula-tions of simpler flow systems. For instance, Guo et al.[29,30]showed that elongated particles align in the flow direction in a simple shear flow.The PDF ofgiexpanded according to Eq. (8) is presented inFig. 7. It should be noted that these surfaces are not probabilities (but proba-bility densities) and are not directly comparable to the plotted values inFig. 6a. Nevertheless, an alignment, specially from z-direction to the flow direction is evident. This anisotropy can clearly be observed in all cases but a planar isotropy (circular shape of the distribution on thex−yplane) is somewhat maintained for Ar= 1
.
5 but iscom-pletely broken for Ar
>
1.
5 which results in a unique director in thedirection of roller’s motion.
Fig. 6a shows that the alignment is a strong function of particle shape. The above analysis also indicates that two different types of
(a) The flow-direction
(b) The z-direction
Fig. 6. The alignment of particle assemblies subjected to the spreading process. Probabilities in the flow- and z-direction are shown. To obtain meaningful statistics for the calculation of Pr(n<|b|), a larger thresholdb= 40◦is used since only a very small fraction of particles remain in this direction.
alignment take place. A first rotation (referred to as Type 1 hereafter), projects particles from thez−xplane onto the x−y plane but preserves the planar isotropy. The second one (Type 2), however, projects particles onto the flow direction. Particles with larger Ar
experience a higher intensity of Type 2 rotations. The degradation of the bed quality with aspect ratio is believed to be related to the Type 2 rotations. These in-plane rotations can significantly disturb the nearby particles resulting in larger4.
Fig. 6a shows that Pr(f
<
|a|) is a weak function of VT rollerand decreases by increasing it. According to our argument, type 2 rotations result in higher4. Here however, Pr(f
<
|a|) decreases by increasingVTroller while it is already observed that higherVrollerT
degrades the bed (Fig. 4). A distinction should be made between the two different types of rotation. This effect is related to the type 1 rotations; at highVT
rollervalues a small fraction of particles simply do
not have enough time to respond to the motion and do not align with the rest of particles onx−yplane. This causes defects in the micro-structure resulting in higher4and negating the effects of reduced Pr(f
<
|a|) values.Fig. 6b shows probability of finding particles in the proximity ofz-axis, Pr(|n|<
40◦). The slight increase of Pr(|n|<
40◦) by increasingVTrollerproves the argument.
The bed thickness,dspreader(only tested for the roller configura-tion) seems to result in a slightly less alignment in flow direction for all aspect ratios (less Type 2 rotation). This has an effect on the higher quality of the bed in line with the arguments in this section. However, largerdspreader is believed to also reduce the probability of particle congestion beneath the spreader and hence may have a mixed effect.Fig. 4shows that the declination rate of0increases after Ar = 2
.
0 for droller = 4Dsph whereas, a constant slope isobserved fordroller= 5Dsph. Based on this observation, it is believed
that a largerdspreaderprovides more space for smooth arrangement
of particles beneath the spreader which becomes more significant at Ar
/
dspreader ≥ 0.
5. It should be emphasised however, that thisTable 3
The probability of finding a particle in alignment with the spreading direction in the initial configuration. Three initial configurations are prepared for different aspect ratios which are then used for all the corresponding simulations.
Ar 1.5 2.0 2.5
Pr(|f|<20◦) 0.0878 0.0968 0.1097
argument is based only on the limited available data and has not been investigated further in this study.
InFig. 6a a curve for the blade case is also presented. Here again although the slightly lower alignment in flow direction may have a positive effect on the bed quality it is overshadowed by the particle dragging effect due to inefficient contact dynamics as explained in Section 4.1.
4.2.2. Experimental results
The particle alignment is also explored experimentally. The experimental rig, consisting of a tray-roller system and rod-shaped particles are prepared using the LS process. The particle shape is equivalent to those presented inFig. 2but with
= 0
.
25. The man-ufacture of particles used in this experimental part was carried out using the EOSINT P100 system at a chamber temperature of 169◦C. The particles were manufactured from the EOS PA2200 (poly-amide) powder using a 16 W CO2lasers at 1500 mm/s scanning speed forpost contour, and a 21 W CO2 lasers at 2500 mm/s for hatching.
The particles were then cooled down to room temperature before removal from the powder bed.
It should be noted that the experiments were mainly performed to support our simulations by showing that at a micro-structure level, the reported particle behaviour is also observed experimen-tally. We did not perform the experiments within a Laser Sintering device in this paper since other parameters would come into play, making the comparison even harder. Although we tried to build our experimental rig to operate as close as possible to the simula-tions/device conditions, the results are only qualitatively compared to the simulations.
A series of tests are carried out in the roller-tray system by spreading particles with either a roller or a blade. The tray was ini-tially filled with white rod-shaped particles with Ar = 2
.
5 and 4.0.A mixed shape case with Ar = 1
.
75, 4.
0 is also considered. Severalblack-coloured rods are manually placed on top of the bed, perpen-dicular toe2onx−yplane (assuming a coordinate system similar
to the simulations). The spreading, was then carried out by moving the spreader withVT = 0
.
05. The procedure is presented inFig. 8. After exposing the buried black-coloured particles the particle ori-entation is measured and those with a maximum 20◦deviation from e2are considered as being aligned in the flow direction.Fig. 9shows52 S. Haeri et al. / Powder Technology 306 (2016) 45–54
(a) A
r
= 1 .5
(b) A
r
= 2 .0
(c) A
r
= 2 .5
Fig. 7. The PDF of distribution of orientation vectors forVT
roller= 0.03 anddroller=
5Dsph. The projected PDF on thex−yplane is also presented. A flat surface indicates
a rotation onto thex−yplane (Type 1). The Type 2 rotations cause the particles to align in the flow direction. This is evident in (b) and (c) where the surface is shrunk in the mid-section and forms two distinct lobes. Note also that they-axis scaling is not identical in the three figures otherwise the effect would have been even more pronounced.
The experimental results inTable 4show that the particle align-ment is indeed a strong function of Ar. However, the effect of the
spreading device is not conclusive. For mixed particles and forAR= 4
.
0, slightly larger alignment is observed for the blade whereas forAr = 2
.
5, the roller generates a larger alignment. Thediscrep-ancy between values obtained from the experiments and simulations can be attributed to the differences in operating conditions and that only a specific sub-set of particles are tracked. Nevertheless, the experimental results, qualitatively confirm that the alignment indeed occurs and support the simulation results.
4.3. Shape segregation
So far only mono-disperse particle beds were considered for the parametric studies. In practice however, a distribution of different shapes is present. For rod-shaped particles this can be reduced to a distribution for Aras presented inFig. 1. A series of simulations are
performed withVT
roller= 0
.
03, 0.
04, 0.
06 for a mixture of threepar-ticle types Ar = 1
.
5, 2.
0, 2.
5, blended with the fractions 0.5, 0.35and 0.15 respectively. Two major objective are pursued here: (1) to illuminate the effects of a shape distribution on characteristics of the final bed and (2) to explore whether the bed quality can effec-tively be controlled by manipulating the shape distributions, noting the non-linear response of the volume fraction to particle shape. For these simulations, the bed is prepared initially using the same pro-tocol as mono-dispersed particles. The ratios are chosen to resemble the shape (parametrised with Ar) distribution of PEK/PEEK particles
as discussed inSection 2.
Similar micro-structural behaviour is observed for the cases with a shape distribution to the mono-dispersed case. In fact, Pr(|f|
<
20◦) = 0
.
205, 0.203 and 0.189 for VTroller = 0
.
03, 0.04 and 0.06.The particle alignment in beds composed of mixed shape particles is qualitatively confirmed with the experimental results, seeTable 4. Also interestingly, the values of Pr(|f|
<
20◦) can be estimated accurately by a number density weighted average of the values of mono-shape particles at correspondingVTroller. These probabilities are
calculated from the values presented inFig. 6a, forVT
roller= 0
.
03, 0.04and 0.06 as 0.204, 0.195 and 0.185 respectively.
To fully characterise the bed however, the particle spatial dis-tribution should be quantified. Our preparation protocol ensures an initial homogeneous distribution of different shapes in each layer. We defined 3 slabs over the bed thicknessdrollercentred at (1
/
6, 1/
3, 5/
6)drollerand calculate a probability for finding a certain particle type in each slab Prslab. This is then normalised by a globalnumber density Prgfor each Arwhich is calculated considering the
entire bed. This normalisation is necessary to make the comparison possible and is defined such that a Prslab
/
Prg= 1 indicates no shapesegregation.Fig. 10show the distribution of Ar at three different
slabs. It is clear that the probability of finding Ar= 2
.
5 in the bottomslab is only 0
.
75Prgwhereas, at the top slab it is increased to 1.
24Prg.Conversely, for Ar = 1
.
5 the probability decreases from 1.
12Prgto 0
.
9Prg. This is a clear indication of shape segregation during thespreading process for the rod-shaped particles. It should be noted that, the particle shape is not isolated from its size and this in fact may be a mixed shape/size effect (since various shapes have different sizes). Nevertheless, this suggests that using particle shape manipu-lation to control volume fraction, may be ineffective since although the average solid volume fraction can be increased, it may not be dis-tributed uniformly in different layers of the bed after the spreading.
5. Concluding remarks
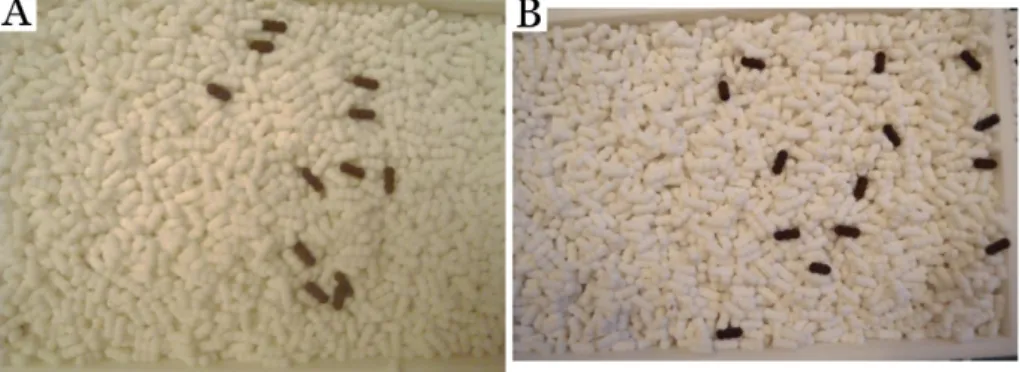
Fig. 8. A demonstration of the particle spreading experiments. After the spreading is complete, top particles are manually removed to expose the buried coloured particles.
Fig. 9. Alignment of particles subjected to the spreading process. Two different spreader types are used: (A) roller, (B) blade.
composite powders will become of interest. Very often the powders and fibres are added together in a dry mix. No knowledge is cur-rently available on optimal fibre size, length and aspect ratio for a high quality sintering process. This study provides insights into how new powders are going to perform in laser sintering.
To address these shortcomings, the effects of particle shape and spreading conditions on the powder bed characteristics, which are important factors determining the final product quality, are investi-gated. It is discovered that generally, particles with larger Arresult in
a lower density powder bed with higher surface roughness and hence lower mechanical performance of the fabricated parts. An effective control parameter, considering the production time constraints, can be the spreader translational velocityVT
spreader, the lower of which the
better powder bed quality. It is also found that in the same operating conditions a roller type spreader significantly outperforms a blade. This has been attributed to inadequate contact of a blade with the bed, which causes particle dragging and degrades the bed quality.
A non-linear response of the volume fraction to the particle shape (with a maximum at Ar = 1
.
5) can also be exploited to control theTable 4
Average and standard deviation of measured probability of particle alignment in the flow direction. The statistics are calculated for 10 separate experiments.
Particle shape Ar= 2.5 Ar= 4.0 Mixed, Ar= 1.75, 4.0
Spreading device Blade Roller Blade Roller Blade Roller Pr(|f|<20◦) 0.447 0.464 0.618 0.615 0.510 0.500
sDEV(Pr) 0.057 0.044 0.014 0.015 0.083 0.089
bed quality by using non-spherical particles with an average Aras
close as possible to 1.5. However, it is found that for a mixture of particles with different Ar a mild shape segregation occurs which
may negate such advantages gained by manipulating particle shape distribution.
Fig. 10. Particle shape segregation after the spreading process. Only the results for
VT
54 S. Haeri et al. / Powder Technology 306 (2016) 45–54
Acknowledgement
The authors gratefully acknowledge the support from the UK Engineering and Physical Sciences Research Council (EPSRC) for the present work under EP/L017318/1 and EP/L017539/1. We also acknowledge the use of the ARCHER UK National Supercomputing Service (Projects D111, E504) for conducting the simulations (http:// www.archer.ac.uk). All data created during this research are openly available from the University of Strathclyde Pure/KnowledgeBase at http://doi.org/10.15129/c5993a8f-812d-46cf-bef5-92e985d12446.
References
[1] X. Yan, P. Gu, A review of rapid prototyping technologies and systems, Comput. Aided Des. 28 (1996) 307–318.
[2] I. Gibson, D.W. Rosen, B. Stucker, Additive Manufacturing Technologies, Springer. 2010.
[3] T.I. Zohdi, Additive particle deposition and selective laser processing - a com-putational manufacturing framework, Comput. Mech. 54 (2014) 171–191. [4] S. Berretta, O. Ghita, K. Evans, Morphology of polymeric powders in laser
sin-tering (LS): from polyamide to new peek powders, Eur. Polym. J. 59 (2014) 218–229.
[5] S. Ziegelmeier, P. Christou, F. Wöllecke, C. Tuck, R. Goodridge, R. Hague, E. Krampe, E. Wintermantel, An experimental study into the effects of bulk and flow behaviour of laser sintering polymer powders on resulting part properties, J. Mater. Process. Technol. 215 (2015) 239–250.
[6] J. Johanson, A rolling theory for granular solids, ASME J. Appl. Mech. 32 (1965) 842–848.
[7] R. T-Dec, A. Zavaliangos, J. Cunningham, Comparison of various modeling meth-ods for analysis of powder compaction in roller press, Powder Technol. 130 (2003) 265–271.
[8] Y. Shanjani, E. Toyserkani, Material spreading and compaction in powder-based solid freeform fabrication methods: mathematical modeling, 19th Annual International Solid Freeform Fabrication Symposium, SFF 2008, 2008, pp. 399–410.
[9] Y. Wang, D. Rouholamin, R. Davies, O. Ghita, Powder characteristics, microstructure and properties of graphite platelet reinforced poly ether ether ketone composites in high temperature laser sintering (HT-LS), Mater. Des. 88 (2015) 1310–1320.
[10] Y. Wang, E. James, O. Ghita, Glass bead filled polyetherketone (PEK) composite by high temperature laser sintering (HT-LS), Mater. Des. 83 (2015) 545–551. [11] E. Parteli, T. Pöschel, Particle-based simulation of powder application in
addi-tive manufacturing, Powder Technol. 288 (2016) 96–102.
[12] Z. Xiang, M. Yin, Z. Deng, X. Mei, G. Yin, Simulation of forming process of powder bed for additive manufacturing, J. Manuf. Sci. Eng. 138 (2016) 081002. [13] M. Schmidt, D. Pohle, T. Rechtenwald, Selective laser sintering of PEEK, CIRP
Ann. Manuf. Technol. 56 (2007) 205–208.
[14] M.A. Beard, O.R. Ghita, J. Bradbury, S. Flint, K.E. Evans, Material characterisation of additive manufacturing components made from a polyetherketone (PEK) high temperature thermoplastic polymer., Innovative Developments in Virtual and Physical Prototyping, 2011, pp. 329–332.
[15] O.R. Ghita, E. James, R. Trimble, K.E. Evans, Physico-chemical behaviour of poly ether ketone (PEK) in high temperature laser sintering (HT-LS), J. Mater. Process. Technol. 214 (4) (2014) 969–978.
[16] M. Vaezi, S. Yang, Extrusion-based additive manufacturing of PEEK for biomed-ical applications, Virtual Phys. Prototyping 10 (2015) 123–135.
[17] P. Peyre, Y. Rouchausse, D. Defauchy, G. Régnier, Experimental and numerical analysis of the selective laser sintering (SLS) of PA12 and PEKK semi-crystalline polymers, J. Mater. Process. Technol. 225 (2015) 326–336.
[18] C.A. Schneider, W.S. Rasband, K.W. Eliceiri, NIH Image to ImageJ: 25 years of image analysis, Nat. Methods 9 (2012) 671–675.
[19] S. Plimpton, Fast parallel algorithms for short-range molecular dynamics, J. Comput. Phys. 117 (1995) 1–19.
[20] A. Di Renzo, F. Di Maio, Comparison of contact-force models for the simula-tion of collisions in DEM-based granular flow codes, Chem. Eng. Sci. 59 (2004) 525–541.
[21] Y. Zhou, B. Wright, R. Yang, B. Xu, A. Yu, Rolling friction in the dynamic simulation of sandpile formation, Physica A 269 (1999) 536–553.
[22] J. Ai, J. Chen, J. Rotter, J. Ooi, Assessment of rolling resistance models in discrete element simulations, Powder Technol. 206 (2011) 269–282.
[23] C. Wensrich, A. Katterfeld, Rolling friction as a technique for modelling particle shape in DEM, Powder Technol. 217 (2012) 409–417.
[24] A comprehensive review of the materials properties of VICTREX®PEEK™ high performance polymer, Technical Report, VICTREX. 2016.
[25] J. Shäfer, S. Dippel, D. Wolf, Force schemes in simulations of granular materials, J. Phys. I 6 (1996) 5–20.
[26] K. Kanatani, Distribution of directional data and fabric tensors, Int. J. Eng. Sci. 22 (1984) 149–164.
[27] A. Baule, R. Mari, L. Bo, L. Portal, H.A. Makse, Mean-field theory of random close packings of axisymmetric particles, Nat. Commun. 4 (2013) 2194.
[28] W. Man, A. Donev, F.H. Stillinger, M.T. Sullivan, W.B. Russel, D. Heeger, S. Inati, S. Torquato, P.M. Chaikin, Experiments on random packings of ellipsoids, Phys. Rev. Lett. 94 (2005) 198001.
[29] Y. Guo, C. Wassgren, B. Hancock, W. Ketterhagen, J. Curtis, Granular shear flows of flat disks and elongated rods without and with friction, Phys. Fluids 06334 (2013) 1–25.