DOI 10.1007/s10646-017-1762-y
The use of minimum selectable concentrations (MSCs) for
determining the selection of antimicrobial resistant bacteria
Sadia Khan 1,2●Tara K. Beattie1●Charles W. Knapp1
Accepted: 11 January 2017
© The Author(s) 2017; This article is published with open access at Springerlink.com
Abstract The use of antimicrobial compounds is indis-pensable in many industries, especially drinking water production, to eradicate microorganisms. However, bacter-ial growth is not unusual in the presence of disinfectant concentrations that would be typically lethal, as bacterial populations can develop resistance. The common metric of population resistance has been based on the Minimum Inhibitory Concentration (MIC), which is based on bacteria lethality. However, sub-lethal concentrations may also select for resistant bacteria due to the differences in bacterial growth rates. This study determined the Minimal Selective Concentrations (MSCs) of bacterial populations exposed to free chlorine and monochloramine, representing a metric that possibly better reflects the selective pressures occurring at lower disinfectant levels than MIC. Pairs of phylogen-etically similar bacteria were challenged to a range of concentrations of disinfectants. The MSCs of free chlorine and monochloramine were found to range between 0.021 and 0.39 mg L−1, which were concentrations 1/250 to 1/5 than the MICs of susceptible bacteria (MICsusc). This study indicates that sub-lethal concentrations of disinfectants could result in the selection of resistant bacterial popula-tions, and MSCs would be a more sensitive indicator of selective pressure, especially in environmental systems.
Keywords Minimal selective concentration (MSC)●
Minimum inhibitory concentration (MIC)● Disinfectant●
Drinking water
Introduction
Overuse and misuse of antimicrobials during the last cen-tury have created issues related to the emergence and enrichment of resistant bacteria (Carlet et al. 2012), espe-cially antimicrobial resistant pathogens that could con-taminate water supply systems and survive their disinfection (Khan et al.2016b; Xu et al.2016). Almost every antibiotic has bacteria that have shown resistance to it (Kummerer
2009b), and these bacteria have been found in water,
sani-tation and agricultural industries (Kummerer2009a; Li et al.
2016) and could be attributed to selective pressures exerted by environmental concentrations of antimicrobials (Tello et al.2012; Sandegren2014). There are concerns that these selective pressure will increase the evolution and spread of antibiotic resistant pathogens (Baquero et al. 1998; Bengtsson-Palme and Larsson 2016), and that the driving forces behind the development and selection of resistance are not fully understood due to the complexity of the interactions between bacteria, antimicrobials and environment.
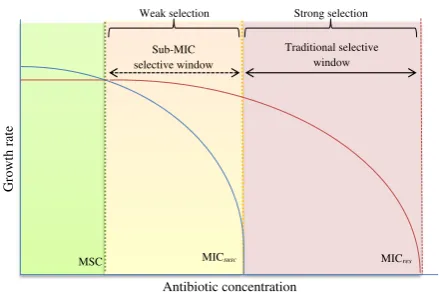
Minimum Inhibitory Concentration (MIC) has been used widely to understand the susceptibility and resistance of bacteria to antimicrobials; this was derived in the clinical setting to represent population lethality. Basically, resistant populations become selected at environmental concentra-tions higher than the MIC of susceptible bacteria (MICsusc), while sub-MIC levels allow the continued growth of both * Sadia Khan
1 Department of Civil and Environmental Engineering, University
of Strathclyde, James Weir Building, 75 Montrose Street, Glasgow, Scotland G1 1XJ, UK
2 Department of Environmental Engineering, NED University of
susceptible and resistant genotypes (Andersson and Hughes
2014, Bengtsson-Palme et al. 2014a). Traditionally, it has been presumed that resistant bacteria have a competitive advantage at concentrations greater than the MIC (San-degren2014).
However, concentrations below the MIC could favour highly resistant bacteria (Li et al. 2016). As such, micro-biologists have defined minimum selective concentrations (MSC), which represents the lowest concentration of anti-microbials that gives the resistant strains a competitive advantage based on growth rates (Fig.1) (Andersson and Hughes2014). This better reflects enrichment possibilities of resistant bacteria in environments where low levels of antimicrobial are present, for example in soils and drinking water sources (Baquero et al.1998,2008; Fram and Belitz
2011; Jiang et al. 2013; Khan et al.2013).
The MSC represents the point at which the benefit in growth exceeds the cost (fitness cost) of carrying the resistance trait vs. a non-resistant strain (Gullberg et al.
2011), and as such, there is a competitive advantage for having the resistance trait at concentrations greater than MSC (Sandegren2014). The difference in fitness between susceptible and resistant organisms at sub-MIC values could result in toxicological endpoints (MSC) much lower than MIC against some antimicrobials (Liu et al.2011).
The resistant populations selected at sub-MIC con-centrations could pose greater challenges to manage than those selected at greater than MIC (Andersson and Hughes
2012). They increase complications in infection treatment (Andersson and Hughes2010) and remain a public health concern (Capita et al.2014). They do not lose their resis-tance traits in the absence of antimicrobials, are more stable, and promote enrichment of resistance (Andersson and Hughes2010, 2012). At lower concentrations, the risk of
emergence of resistant populations in the environment not only increase (Knapp et al.2008; Couce and Blazquez2009), but the problem of horizontal gene transfer to other popula-tions could intensify (Couce and Blazquez2009; Canton and Morosini2011; Johnson et al.2015), which includes induced transfer of plasmids and transposons (Barr et al. 1986; Doucet-Populaire et al.1991), and enhanced recombination (Lopez et al. 2007; Lopez and Blazquez 2009). Increased rates of replication (Andersson and Hughes2009,2011) and mutation (Cortes et al.2008; Morero et al.2011; Thi et al.
2011; Gutierrez et al.2013; Chow et al.2015) have also been evidenced. Moreover, low concentrations contribute to sig-nalling molecules for biofilm formation and gene expression (Andersson and Hughes2014; Aka and Haji2015; Ebrahimi et al. 2015). As such, sub-lethal concentrations could sti-mulate the spread of resistance in the environment and increase the likelihood of multi-resistant bacteria through genetic changes (Sandegren2014).
There are multiple factors that can influence the MSC of disinfectants. In the presence of a complex microbial community, selective forces that can change the select-ability of any population at sub-MIC levels include nutrient concentrations, pH, and predation (Quinlan et al. 2011; Bengtsson-Palme et al. 2014b). A MSC model works best for planktonic bacteria growing in suspension form, rather than biofilm bacteria, as the presence of extracellular matrix interferes with chemical concentrations in the biofilm (Canton and Morosini 2011). Furthermore, selection of resistance does not depend on the initial number of resistant organisms in the system, and any resistant organism could become enriched in a community (Gullberg et al.2011).
While sub-lethal concentrations of antibiotic have been studied (e.g., Bengtsson-Palme and Larsson 2016), the impact of disinfectants and their residuals has not been extensively investigated (Li et al.2016). The purpose of this study is to examine the selection of resistant bacteria (Khan et al. 2016a) versus susceptible bacteria at specific sub-inhibitory concentrations of chlorine, either as free chlorine or monochloramine. Growth rates of susceptible and resis-tant bacteria were compared at different concentrations of disinfectants below the MICs of susceptible and resistant bacteria. We examined the merit of using minimum selectability concentration (MSC) as a toxicological approach to assess the emergence of antimicrobial resistant bacteria in the environment.
Materials and methods
Bacterial strains
Eight bacteria, belonging to four genera: Bacillus, Paeni-bacillus,AcidovoraxandMicrococcus—previously isolated
Growth rate
Weak selection Strong selection
Traditional selective window Sub-MIC
selective window
Antibiotic concentration
MSC MICsusc MICres
[image:2.595.60.280.54.202.2]from drinking water environments (Khan et al. 2016b)— were chosen for this study. These bacteria were previously classified into three groups: resistant (R), intermediate (I), and susceptible (S) on the basis of size of zone of inhibition against disinfection with 14.5% standard sodium hypo-chlorite by disk diffusion method (Khan et al. 2016a). Closely related bacteria were paired together and used irrespective of their antibiotic resistance (Table1).
Bacteria were cryo-preserved (Cryo vials TS/71-MX, Technical Service Consultants Ltd. UK) and stored at−80 °C. For each experiment, a single bead of inoculum was asep-tically removed from the cryovials, grown in LB broth (Oxoid, UK) overnight, and streaked on Nutrient Agar (Oxoid, UK) plates to generate isolates, which were used in the experiments. All bacteria were identified by 16S-rRNA gene sequencing (Khan et al.2016a), exceptBacillus sub-tilis (R2), which was acquired from culture collection (National Collection of Type Cultures, UK; NCTC 10400).
Viable cell count by turbidity (OD600) measurement (Standard growth curve)
Cell concentrations were determined by spectro-photometrically, measuring the turbidity of solutions at 600 nm. To determine the relationship between OD600
(spec-trophotometric optical density) and bacterial cell count (another microbiological measure of population), each bacterial isolate was grown overnight for maximum cell viability in 50-mL LB broth at 200 rpm on a shaker (Bench top Standard Analog, Orbital Shaker, VWR, UK) at 20 °C. Next day, the culture was concentrated by centrifuging (refrigerated centrifuge, Eppendorf, UK) three times at 3500 rpm for 10 min, and suspended in 0.1% PBS in a total volume of 5 mL. This culture was used to make ten-fold serial dilutions from 1:10 to 1:10,000, and two-fold serial dilutions from 1:2 to 1:128. OD600 of each dilution was
recorded with a UV-VIs spectrophotometer (Helios Zeta, Thermo Scientific, UK) by taking 4 mL from each dilution tube in a 1 cm wide cuvette. Sterile PBS (0.1%) was used as blank. For the determination of number of bacteria (cfu mL−1) at a specific OD, the dilution tubes were further diluted up to 1:10,000 in 10 mL PBS whenever required, and 100µL from the last dilution tube was transferred to Mueller Hinton Agar plates (Oxoid, UK) in duplicate, spread with a sterile spreader and incubated for 24 h at 35±2 °C for the devel-opment of colonies. After 24 h, colonies were counted on each plate and cfu mL−1was calculated for each OD600and
dilution. Ln(OD600) vs. ln(cfu mL−1) graph values were
used for plotting and for the calculation of number of bacteria present at a specific OD in further experiments (Hall et al.2014).
MIC determinations for free chlorine
Experiments were performed in 50-mL screw- capped glass vials in a total volume of 10-mL PBS, pH 7.0. Glass vials were pre-treated with 10% HNO3 (prepared from
69%, AnalaR NORMAPUR, Prolabo VWR BDH) over-night, soaked in 1% NaOCl (Alfa Aesar, UK), rinsed with nano-pure water (18Ώ), and sterilized before use. Bacterial strains were grown overnight in LB broth with continuous shaking at 200 rpm at 20 °C, and washed three times with PBS (pH 7.0) to remove organic material. Bacterial stock culture was suspended in the same buffer, and diluted to a turbidity between 0.08–0.13 at OD600, equivalent to a
[image:3.595.160.544.53.207.2]bacterial concentration of 1–1.5×10⁸cfu mL−1. Chlorine solutions were prepared freshly at the time of each experiment, having concentrations of 0.001 L−1to 10 mg L−1 from a standard stock solution of 14.5% sodium hypochlorite (Alfa Aesar, UK) in chlorine-demand free PBS. Bacterial stock culture was diluted, added at a con-centration of 1×10⁵cfu mL−1in the vials, and vials were
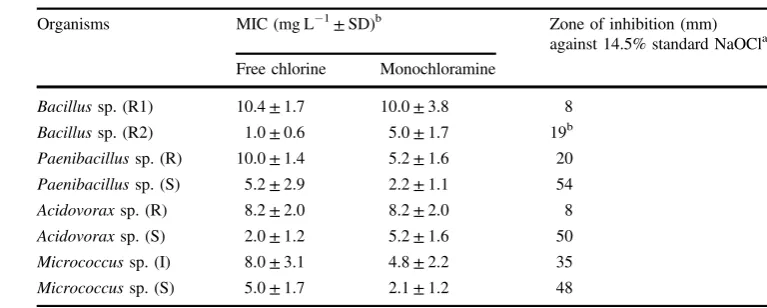
Table 1 Mean minimum
inhibitory concentrations of test micro organisms against free chlorine and monochloramine (n=3)
Organisms MIC (mg L−1±SD)b Zone of inhibition (mm) against 14.5% standard NaOCla Free chlorine Monochloramine
Bacillussp. (R1) 10.4±1.7 10.0±3.8 8 Bacillussp. (R2) 1.0±0.6 5.0±1.7 19b
Paenibacillussp. (R) 10.0±1.4 5.2±1.6 20 Paenibacillussp. (S) 5.2±2.9 2.2±1.1 54 Acidovoraxsp. (R) 8.2±2.0 8.2±2.0 8
Acidovoraxsp. (S) 2.0±1.2 5.2±1.6 50 Micrococcussp. (I) 8.0±3.1 4.8±2.2 35
Micrococcussp. (S) 5.0±1.7 2.1±1.2 48
Rresistant,Iintermediate,Ssusceptible
aUnless otherwise stated, values were from Khan et al. (2016a)
incubated for 24 h at 37 °C. After incubation, 1 mL of the solution from each vial was spread with a sterile spreader on to Mueller Hinton Agar plates (Oxoid, UK) in dupli-cate, and plates were incubated for 24–48 h at 37 °C for the development of colonies. The lowest concentration of free chlorine without any sign of growth on representative plates after 48 h was considered as the MIC of free chlorine against that organism (Clinical and Laboratory Standards Institute 2012). With this measure, the centrations with the appearance of colonies were con-sidered non-inhibitory for the organism. The experiments were run in triplicate on three different days to determine the minimum inhibitory concentration (MIC) of disinfectant.
MIC determinations for monochloramine
For monochloramine experiments, PBS of pH 8.0 was used. Monochloramine solutions were prepared by mixing the appropriate volume of 1.91% NH4Cl (Sigma-Aldrich, UK)
and 14.5% NaOCl (Alfa Aesar, UK) solutions. A series of monochloramine concentrations from 0.001 to 10 mg L−1 were prepared in PBS. The remaining protocol was the same as that used for chlorine (described above).
Selection of medium for growth rate experiment
For the determination ofµmax (ultimate population growth
rate) and appropriate growing media, experiments were carried out in different concentrations of LB broth, 0.1, 1.0, 5.0, 10, and 100%, and 10 mM PBS (pH: 7.0; representing 0% LB) in sealed serum vials. Hundred millilitre broths and PBS were inoculated with overnight grown cultures of Bacillus(R1 and R2) andPaenibacillus(R and S) species at a concentration of 1×10⁶cfu mL−1, and allowed to grow with continuous shaking at 20 °C. Optical densities (OD600)
were measured over 96 h (6 h intervals) with a UV-VIs spectrophotometer (Helios Zeta, Thermo Scientific, UK). Growth rate was calculated from the plots ofln(OD600) vs.
time. Media was selected on the basis of bacterial growth and low chlorine demand, while bacteria were selected on the basis of oxygen requirement; two genera were used. Bacillus, Micrococcus and Acidovorax are aerobic, so Bacilluswas selected as representative, whilePaenibacillus was the only facultative anaerobe, so it was included in this experiment. PBS had minimum chlorine demand but tested bacteria showed negative growth rate so they were not used for further experiment. LB broth (0.1%) was selected as a medium for growth for further experiments of MSC of disinfectants as it had low chlorine demand and bacteria grow well in the broth.
Preparation of bacterial inoculum for growth rate experiments
Cryo-preserved culture, previously stored at −80 °C, was grown in LB broth overnight, and streaked on Mueller Hinton Agar plates (Oxoid, UK) to verify culture purity. A single colony was transferred to 20 mL LB broth in a sealed glass bottle and grown overnight at 20 °C to obtain log phase culture with a high viable count. The oxygen envir-onment in the glass bottle was representative of conditions in water distribution pipes and allowed relatively rapid growth in fresh medium without excessive chlorine demand. This culture was washed three times with chlorine demand free 0.1% LB, and suspended in the same broth for growth rate experiments (Berney et al. 2006; Hall et al.
2014). Chlorine demand of the broth was calculated by the formula; chlorine demand=chlorine added concentration (mg L−1)—chlorine residual concentration (mg L−1) after 30 min contact time (HACH methods 10069 and 10223, DPD reagent, HACH, UK).
Growth rate experiments with disinfectants for MSC
Experiments were performed in 0.1% LB broth in 100 mL sterile sealed serum vials to avoid the evaporation of chlorine. Free chlorine solutions of 10 different concentra-tions 0.01, 0.02, 0.03, 0.04, 0.05, 0.1, 0.5, 1.0, 5.0 and 10 mg L−1were prepared as target concentrations in dilute LB. Overnight grown culture (as describe above) was diluted and added at a concentration of 1×10⁸cfu mL−1 in the final volume of 100 mL, and vials were sealed immediately and mixed well. The vials were incubated at 20 °C with continuous shaking at 200 rpm for 24 h, and OD600 were
taken with a UV-VIs spectrophotometer at 2 h time intervals by removing 4 mL medium from each vial.
The growth rate constant (µ) was calculated for each bacterium from the previously determined growth curve (OD600vs. cfu mL−1, previous section) by converting the
OD600into cfu mL−1and calculating theµ by the slope of
the graph between ln(cfu mL−1) vs. time. The experiments were run in triplicate for each concentration and mean growth rate constant was determined.
Data analysis
Concentrations were log transformed before analysis. Sta-tistical analysis was carried out using Minitab-v17. Corre-lations were determined between concentrations of the two disinfectants and growth rates by Pearson’s Correlation test (p=0.05) (Table 2). Minimum selectable concentrations (MSCs) were determined from growth rates vs. concentra-tions (log10 transformed) plots where the growth rate of
population. Non-linear regression was performed using GraphPad Prism version 7.01 for Windows (GraphPad Software, La Jolla, CA, USA) to calculate the MSC values from standard curves at 95% confidence interval.
Results
Zone of inhibition by selected bacterial strains
Eight bacteria (four different genera) were selected for this study. They were divided into three groups on the basis of size of zone of inhibition (in diameter); Resistant (R)≤20 mm, Intermediate (I)=21–40 mm, and Susceptible (S)≥ 41 mm, as described previously (Khan et al. 2016a). One
member of each pair had a zone<20 mm, while the second member had a zone ≥41 mm, except for Bacillus and Micrococcus spp.; both Bacillus produced <20 mm zones and were differentiated by R1 and R2, while Micrococcus spp. produced 35 and 48 mm zones of inhibition and were differentiated by I and S, respectively. Other bacteria included Paenibacillus spp. having 20 and 54 mm zones, and Acidovorax having 8 and 50 mm zones, respectively (Table 1).
MIC of the bacterial strains against chlorine and monochloramine
Bacteria were tested by dilution method against a series of concentrations of free chlorine and monochloramine from 0.01 to 100 mg L−1to determine the MICs of these disin-fectants against the eight microorganisms. The MICs of free chlorine and monochloramine were in the ranges from 1–10.4 mg L−1, and 2.1–10 mg L−1, respectively (Table1). Bacillussp. (R1) showed the highest MICs for free chlorine and monochloramine, which were 10.4±1.7 and 10.0± 3.8 mg L−1, respectively. Bacillus sp. (R2) showed lowest MIC 1.0±0.6 mg L−1for chlorine, whileMicrococcussp. (S) had lowest MIC 2.1±1.2 mg L−1for monochloramine (Table 1).
Selection of suitable medium for growth rate experiment
[image:5.595.50.290.301.534.2]Growth rates ofBacillusandPaenibacillusspp. were tested at six different concentrations of LB broth, and were observed in the range of−0.076 to 0.462 h−1in these media (Table3). PBS (10 mM) showed minimum growth rate and chlorine demand, but Paenibacillus sp. (S) did not grow well in PBS, so 0.1% LB broth was selected for the further experiments; it had lowest chlorine demand, whilst sup-porting bacterial growth.
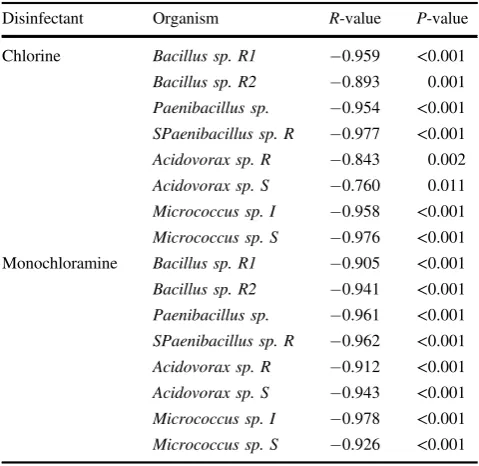
Table 2 Correlation between growth rates and concentrations (log transformed) of free chlorine and monochloramine by Pearson correlation test (α=0.05)
Disinfectant Organism R-value P-value
Chlorine Bacillus sp. R1 −0.959 <0.001 Bacillus sp. R2 −0.893 0.001
Paenibacillus sp. −0.954 <0.001 SPaenibacillus sp. R −0.977 <0.001 Acidovorax sp. R −0.843 0.002
Acidovorax sp. S −0.760 0.011 Micrococcus sp. I −0.958 <0.001
Micrococcus sp. S −0.976 <0.001 Monochloramine Bacillus sp. R1 −0.905 <0.001
Bacillus sp. R2 −0.941 <0.001 Paenibacillus sp. −0.961 <0.001 SPaenibacillus sp. R −0.962 <0.001
Acidovorax sp. R −0.912 <0.001 Acidovorax sp. S −0.943 <0.001
Micrococcus sp. I −0.978 <0.001 Micrococcus sp. S −0.926 <0.001
Table 3 Growth rates of selected bacteria in different growth medium
Organisms Growth rates in growth medium (h−1)
10 mM PBS 0.1% LB 1% LB 5% LB 10%LB 100% LB
Bacillussp. (R1) 0.035±0.01b 0.261c 0.224c 0.424c 0.181±0.20a 0.304±0.14a Bacillussp. (R2) 0.099±0.10b NT NT NT 0.462±0.34b 0.237±0.03b
Paenibacillussp. (R) 0.028±0.00b 0.197c 0.218c 0.283c 0.326±0.16a 0.343±0.28a Paenibacillussp. (S) −0.076±0.18b NT NT NT 0.015±0.21b 0.127±0.13b
NTnot tested
an=3 bn=2
[image:5.595.177.548.561.650.2]Minimum selectable concentration (MSC) of disinfectants
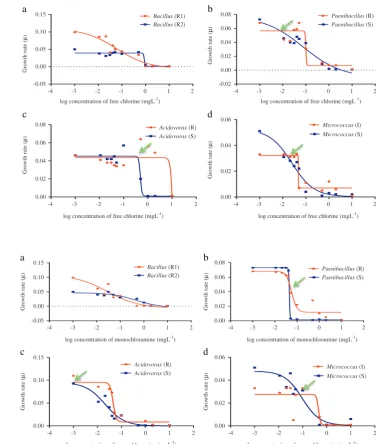
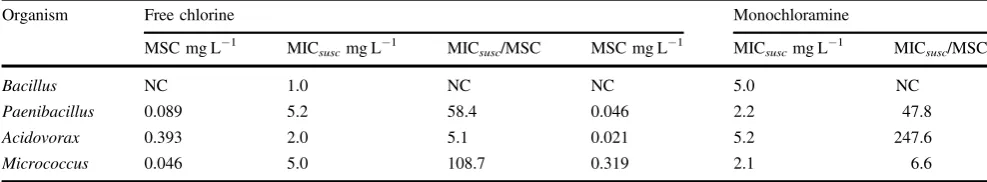
Bacteria, in their log phase of growth, were exposed to a series of concentrations (0.01–10 mg L−1) of free chlorine and monochloramine, and their growth rate constants (µ) were compared (Figs 2 and 3). Minimal selectable con-centration (MSC) represented the sub-MIC concon-centration at which the more resistant organism’s growth exceeded its competitor. Each bacterial pairing showed different behaviour with the different disinfectants—free chlorine and monochloramine. TheMicrococcusassay showed the greatest difference between MIC (5.0±1.7 mg L−1) and MSC (0.046 mg L−1), which was 110 fold lower than the MIC of the susceptible strain against chlorine (Table4).
While with monochloramine, Acidovorax assay MIC/ MSC was more than any other bacteria. MSC was 0.021 mg L−1 which was 1/250th the MIC value of the sus-ceptible organism. The non-linear regressions fitted data point well, with consistent R2>0.90 and S (Standard Error of Regression)<0.010; exceptions wereAcidovorax (S) in the chlorination experiment (R2=0.64;S=0.011), and Micrococcus (I) (R2=0.72; S=0.009) in the chlor-amine experiment. Details of MSC and its ratio with MIC can be found in Table 4. The MSC for Bacillus against chlorine and monochloramine could not be calculated from the data, since the results suggested that the resistant strain had competitive advantage at much lower con-centrations used in this study making determination difficult.
Bacillus (R1) Bacillus (R2)
log concentration of free chlorine (mgL-1)
-4 -3 -2 -1 0 1 2
Growth rate (
µ
)
Growth rate (
µ ) -0.05 0.00 0.05 0.10 0.15 0.00 0.02 0.04 0.06
0.08 Acidovorax (R) Acidovorax (S)
log concentration of free chlorine (mgL-1)
-4 -3 -2 -1 0 1 2 a
c
log concentration of free chlorine (mgL-1) -4 -3 -2 -1 0 1 2
Paenibacillus (R) Paenibacillus (S)
log concentration of free chlorine (mgL-1)
Growth rate (
µ
)
Growth rate (
µ
)
-4 -3 -2 -1 0 1 2 -0.02 0.00 0.02 0.04 0.06 0.08 0.00 0.02 0.04 0.06 Micrococcus (I) Micrococcus (S) b d
Fig. 2 Minimum selectability concentrations (MSC) of Bacillus(a),Paenibacillus(b), Acidovorax(c), and
Micrococcus(c) species for free chlorine Bacillus (R1) Bacillus (R2) -0.05 0.00 0.05 0.10 0.15
Growth rate (
µ
)
log concentration of monochloramine (mgL-1) -4 -3 -2 -1 0 1 2 a
0.00 0.05 0.10 0.15
Growth rate (
µ
)
Acidovorax (R) Acidovorax (S)
-4 -3 -2 -1 0 1 2 c 0.00 0.02 0.04 0.06 0.08
Growth rate (
µ
) Paenibacillus (R)
Paenibacillus (S)
-4 -3 -2 -1 0 1 2 b
Micrococcus (I) Micrococcus (S)
-4 -3 -2 -1 0 1 2 0.00
0.02 0.04 0.06
Growth rate (
µ
)
d
log concentration of monochloramine (mgL-1)
log concentration of monochloramine (mgL-1) log concentration of monochloramine (mgL-1)
Fig. 3 Minimum selectability concentrations (MSC) of Bacillus(a),Paenibacillus(b), Acidovorax(c), and
[image:6.595.167.547.54.499.2]Discussion
Sub-lethal concentrations of antimicrobials can create con-ditions that selectively favour more resistant organisms (Chow et al.2015). The enrichment of resistant bacteria can occur at concentrations many fold below the MICsusc (Hughes and Andersson2012). In this study, the bacteria pairings had similar growth rates at very low chlorine and chloramine concentrations. Once chemical concentrations exceeded a particular threshold (the MSC), the growth rate of the more susceptible population declined as compared to resistant population.
The relevance of the study suggests that we should also be concerned about the MSC than just the MIC when examining antimicrobial resistance. Natural environments, which can be exposed to relatively low concentrations of antimicrobials, are also prone for the enrichment of resis-tance (Drlica2003; Drlica and Zhao2007), as well as high-concentration exposures (Myers2008). This is also relevant along concentration gradients from a point of high-exposure (e.g., over time for a degrading compound, or spatially when dispersed). For example, in drinking water treatment plants, high concentration i.e. 0.5 mg L−1or more of resi-dual disinfectant is applied to the system, but by the time the water reaches the point of use, the concentration may have reduced to sub-inhibitory levels i.e. less than 0.1 mg L−1, as found in this study because of the short half-life of these disinfectants. This concentration gradient could increase the selection of resistant populations (Zhou et al.
2000) if bacterial contamination is allowed to enter the system. This could also become relevant to downstream areas where chlorinated water supplies discharge into the natural environment. Thus, the presence of sub-lethal con-centrations of disinfectants increases the risk of dispersion of resistant bacteria through water distribution systems.
In this study, a series of concentrations of chlorine and monochloramine were used and enrichment of disinfectant resistant populations was observed in several cases (Figs2
and 3), supporting the idea that low concentrations of chlorine and monochloramine could selectively enrich resistant bacteria. Similar results were obtained in a
previous study where the selection of multidrug resistantPs. aeruginosa was observed after treatment with sub-optimal concentration of chlorine (Shrivastava et al.2004).
Several mechanisms could be responsible for resistance development against chlorine-based disinfectants at sub-MIC levels (Moen et al. 2012): increased surface hydro-phobicity (Hostacka et al.2003), changes in exopolymeric matrix (Dynes et al. 2009), detoxifying efflux genes (Mc Cay et al. 2010; Moen et al. 2012), differential expression of outer-membrane porin genes (Moen et al. 2012), mor-phological modifications, high enzyme activities (Gao and Liu 2014), transfer of conjugative plasmid carrying resis-tance traits (Johnson et al. 2015), and regeneration path-ways (Drazic et al.2015; Jozefczuk et al. 2010). A recent study showed that not only disinfectants, but their by-products, could also enrich resistant bacteria at sub-lethal concentrations through chromosomal genetic mutation in water (Lv et al.2014; Li et al. 2016). Environmental con-ditions could also have multiplicative effects in the enrichment process; sub-inhibitory concentrations of ben-zalkonium chloride selects adaptive variants ofPs. aerugi-nosa in magnesium limited medium, but not in organic-carbon rich conditions (Mc Cay et al.2010).
[image:7.595.50.544.70.161.2]Different methods could be used for determination of minimal selective concentrations, such as use of mutant and wild type bacteria with different resistant markers and use of different fluorescence proteins to distinguish between sensitive and resistant populations (Gullberg et al. 2011). The growth rate approach offers an advantage over other techniques by not requiring additional markers to verify resistant populations. Comparing bacterial growth rates is considered an important tool for understanding microbial physiology (Hall et al.2014). Bacterial growth rate data can be used in environmental studies for quantifying pheno-types (Warringer and Blomberg2003), and their adaptation to environmental changes (Lindsey et al. 2013). In this study, growth-rate data were applied to determine minimal selective concentrations of disinfectants which lead to increased resistance traits. It has been considered that the disinfectant resistance could enhance antibiotic resistance in environment and contribute to increased public health risk
Table 4 Minimum selectable concentrations (MSC) of free chlorine and monochloramine for bacteria isolated from water distribution systems
Organism Free chlorine Monochloramine
MSC mg L−1 MICsuscmg L−1 MICsusc/MSC MSC mg L−1 MICsuscmg L−1 MICsusc/MSC
Bacillus NC 1.0 NC NC 5.0 NC
Paenibacillus 0.089 5.2 58.4 0.046 2.2 47.8
Acidovorax 0.393 2.0 5.1 0.021 5.2 247.6
Micrococcus 0.046 5.0 108.7 0.319 2.1 6.6
(Al-Jailawi et al.2013; Capita et al. 2014; Seier-Petersen et al.2014).
Conclusion
Seven drinking-water isolates and a single culture-collection strain were exposed to varying levels of chlori-nated disinfectants. Results found that lower than expected concentrations (i.e.,<MIC, a conventional metric for bac-terial resistance) showed selective bias by providing resis-tance strains a competitive advantage in population growth. It is important to recognise sub-lethal effects of disinfectants on resistant strains because of their potential impact on drinking water contamination and human health. In the environment, sub-MIC levels of disinfectants are present as residuals which could select resistant bacteria and poten-tially facilitate the dissemination of resistant determinants among bacteria. There is a need for further investigation to understand the ecological responses of bacteria in the pre-sence of sub-MIC level of disinfectants (and antibiotics) to overcome the problem of enriched antimicrobial-resistant (antibiotic resistant) populations that have become a con-cern on a global scale. Broadening ecotoxicological studies to strategically include selectivity metrics, e.g., MSC, would be an important step forward.
Acknowledgements Schlumberger Foundation Faculty for the Future provided the fellowship for SK’s Ph.D.
Compliance with ethical standards
Conflict of interest The authors declare that they have no com-peting interest.
Open Access This article is distributed under the terms of the Creative Commons Attribution 4.0 International License (http:// creativecommons.org/licenses/by/4.0/), which permits use, duplica-tion, adaptaduplica-tion, distribuduplica-tion, and reproduction in any medium or format, as long as you give appropriate credit to the original author(s) and the source, provide a link to the Creative Commons license, and indicate if changes were made.
References
Aka ST, Haji SH (2015) Sub-MIC of antibiotics induced biofilm formation ofPseudomonas aeruginosain the presence of chlor-hexidine. Braz J Microbiol 46(1):149–154. doi: 10.1590/S1517-838246120140218
Al-Jailawi MH, Ameen RS, Al-Jeboori MR (2013) Effect of disin-fectants on antibiotics susceptibility ofPseudomonas aeruginosa. J Appl Biotechnol 1(1):54–63. doi:10.5296/jab.v1i1.4038 Andersson DI, Hughes D (2009) Gene amplification and adaptive
evolution in bacteria. Annu Rev Genet 43:167–195. doi:10.1146/ annurev-genet-102108-134805
Andersson DI, Hughes D (2010) Antibiotic resistance and its cost: is it possible to reverse resistance? Nature Rev Microbiol 8(4): 260–271. doi:10.1038/nrmicro2319
Andersson DI, Hughes D (2011) Persistence of antibiotic resistance in bacterial populations. FEMS Microbiol Rev 35(5):901–911. doi:10.1111/j.1574-6976.2011.00289.x
Andersson DI, Hughes D (2012) Evolution of antibiotic resistance at non-lethal drug concentrations. Drug Resist Updat 15(3): 162–172. doi:10.1016/j.drup.2012.03.005
Andersson DI, Hughes D (2014) Microbiological effects of sublethal levels of antibiotics. Nature Rev Microbiol 12(7):465–478. doi:10.1038/nrmicro3270
Baquero F, Martinez JL, Canton R (2008) Antibiotics and antibiotic resistance in water environments. Curr Opin Biotechnol 19(3): 260–265. doi:10.1016/j.copbio.2008.05.006
Baquero F, Negri M-C, Morosini M-I, Blazquez J (1998) Antibiotic-selective environments. Clin Infect Dis 27(Suppl 1):S5–S11. doi:10.1086/514916
Barr V, Barr K, Millar MR, Lacey RW (1986)β-Lactam antibiotics increase the frequency of plasmid transfer in Staphylococcus aureus. J Antimicrob Chemother 17:409–413. doi:10.1093/jac/ 17.4.409
Bengtsson-Palme J, Boulund F, Fick J, Kristiansson E, Larsson DG (2014a) Shotgun metagenomics reveals a wide array of antibiotic resistance genes and mobile elements in a polluted lake in India. Front Microbiol 5:648. doi:10.3389/fmicb.2014.00648
Bengtsson-Palme J, Larsson DG (2016) Concentrations of antibiotics predicted to select for resistant bacteria: proposed limits for environmental regulation. Environ Int 86:140–149. doi:10.1016/j. envint.2015.10.015
Bengtsson-Palme J, Rosenblad MA, Molin M, Blomberg A (2014b) Metagenomics reveals that detoxification systems are under-represented in marine bacterial communities. BMC Genomics 15:749–765. doi:10.1186/1471-2164-15-749
Berney M, Weilenmann HU, Ihssen J, Bassin C, Egli T (2006) Spe-cific growth rate determines the sensitivity ofEscherichia colito thermal, UVA, and solar disinfection. Appl Environ Microbiol 72 (4):2586–2593. doi:10.1128/AEM.72.4.2586-2593.2006 Canton R, Morosini MI (2011) Emergence and spread of antibiotic
resistance following exposure to antibiotics. FEMS Microbiol Rev 35(5):977–991. doi:10.1111/j.1574-6976.2011.00295.x Capita R, Riesco-Pelaez F, Alonso-Hernando A, Alonso-Calleja C
(2014) Exposure ofEscherichia coliATCC 12806 to sublethal concentrations of food-grade biocides influences its ability to form biofilm, resistance to antimicrobials, and ultrastructure. Appl Environ Microbiol 80(4):1268–1280. doi:10.1128/AEM. 02283-13
Carlet J, Jarlier V, Harbarth S, Voss A, Goossens H, Pittet D, Parti-cipants of the 3rd World Healthcare-Associated Infections F (2012) Ready for a world without antibiotics? The pensieres antibiotic resistance call to action. Antimicrob Resist Infect Control 1(1):11–23. doi:10.1186/2047-2994-1-11
Chow L, Waldron L, Gillings MR (2015) Potential impacts of aquatic pollutants: sub-clinical antibiotic concentrations induce genome changes and promote antibiotic resistance. Front Microbiol 6:803–812. doi:10.3389/fmicb.2015.00803
Clinical and Laboratory Standards Institute (2012) Methods for dilu-tion antimicrobial susceptibility tests for bacteria that grow aerobically, 9th edn. Clinical Laboratory Standards Institute, Wayne, PA, Approved Standard-Ninth Edition CLSI document M07-A9. 32(2)
Couce A, Blazquez J (2009) Side effects of antibiotics on genetic variability. FEMS Microbiol Rev 33(3):531–538. doi:10.1111/j. 1574-6976.2009.00165.x
Doucet-Populaire F, Trieu-Cout P, Dosbaa I, Andremont A, Courvalin P (1991) Inducible transfer of conjugative transposon Tn1545 from Enterococcus faecalis to Listera monocytogenes in the digestive tracts of gnotobiotic mice. Antimicrob Agents Che-mother 35(1):185–187. doi:10.1128/AAC.35.1.185
Drazic A, Kutzner E, Winter J, Eisenreich W (2015) Metabolic response ofEscherichia coliupon treatment with hypochlorite at sub-lethal concentrations. PLoS ONE 10(5):e0125823. doi:10. 1371/journal.pone.0125823
Drlica K (2003) The mutant selection window and antimicrobial resistance. J Antimicrob Chemother 52(1):11–17. doi:10.1093/ jac/dkg269
Drlica K, Zhao X (2007) Mutant selection window hypothesis upda-ted. Clin Infect Dis 44(5):681–688. doi:10.1086/511642 Dynes JJ, Lawrence JR, Korber DR, Swerhone GD, Leppard GG,
Hitchcock AP (2009) Morphological and biochemical changes in Pseudomonas fluorescens biofilms induced by sub-inhibitory exposure to antimicrobial agents. Can J Microbiol 55(2): 163–178. doi:10.1139/w08-109
Ebrahimi A, Hemati M, Shabanpour Z, Habibian Dehkordi S, Baha-doran S, Lotfalian S, Khubani S (2015) Effects of benzalkonium chloride on planktonic growth and biofilm formation by animal bacterial pathogens. Jundishapur J Microbiol 8(2):e16058. doi:10.5812/jjm.16058
Fram MS, Belitz K (2011) Occurrence and concentrations of phar-maceutical compounds in groundwater used for public drinking-water supply in California. Sci Total Environ 409(18): 3409–3417. doi:10.1016/j.scitotenv.2011.05.053
Gao H, Liu C (2014) Biochemical and morphological alteration of Listeria monocytogenes under environmental stress caused by chloramine-T and sodium hypochlorite. Food Control 46:455–461. doi:10.1016/j.foodcont.2014.05.016
Gullberg E, Cao S, Berg OG, Ilback C, Sandegren L, Hughes D, Andersson DI (2011) Selection of resistant bacteria at very low antibiotic concentrations. PLoS Pathog 7(7):e1002158. doi:10. 1371/journal.ppat.1002158
Gutierrez A, Laureti L, Crussard S, Abida H, Rodriguez-Rojas A, Blazquez J, Baharoglu Z, Mazel D, Darfeuille F, Vogel J, Matic I (2013) Beta-Lactam antibiotics promote bacterial mutagenesis via an RpoS-mediated reduction in replicationfidelity. Nat Commun 4:1610–1618. doi:10.1038/ncomms2607
Hall BG, Acar H, Nandipati A, Barlow M (2014) Growth rates made easy. Mol Biol Evol 31(1):232–238. doi:10.1093/molbev/mst187 Hostacka A, Ciznar I, Krovacek K (2003) The effect of disinfectants
onPlesiomonas shegelloides. Pharmazie 58:11–14
Hughes D, Andersson DI (2012) Selection of resistance at lethal and non-lethal antibiotic concentrations. Curr Opin Microbiol 15 (5):555–560. doi:10.1016/j.mib.2012.07.005
Jiang L, Hu X, Xu T, Zhang H, Sheng D, Yin D (2013) Prevalence of antibiotic resistance genes and their relationship with antibiotics in the Huangpu river and the drinking water sources, Shanghai, China. Sci Total Environ 458-460:267–272. doi:10.1016/j. scitotenv.2013.04.038
Johnson TJ, Singer RS, Isaacson RE, Danzeisen JL, Lang K, Kobluk K, Rivet B, Borewicz K, Frye JG, Englen M, Anderson J, Davies PR (2015) In vivo transmission of an IncA/C plasmid inEscherichia colidepends on tetracycline concentration, and acquisition of the plasmid results in a variable cost of fitness. Appl Environ Microbiol 81(10):3561–3570. doi:10.1128/AEM.04193-14 Jozefczuk S, Klie S, Catchpole G, Szymanski J, Cuadros-Inostroza A,
Steinhauser D, Selbig J, Willmitzer L (2010) Metabolomic and transcriptomic stress response ofEscherichia coli. Mol Syst Biol 6(364):1–16. doi:10.1038/msb.2010.18
Khan GA, Berglund B, Khan KM, Lindgren PE, Fick J (2013) Occurrence and abundance of antibiotics and resistance genes in rivers, canal and near drug formulation facilities-a study in Pakistan. PLoS ONE 8(6):e62712. doi:10.1371/journal.pone. 0062712
Khan S, Beattie TK, Knapp CW (2016a) Relationship between anti-biotic- and disinfectant-resistance profiles in bacteria harvested from tap water. Chemosphere 152:132–141. doi:10.1016/j. chemosphere.2016.02.086
Khan S, Knapp CW, Beattie TK (2016b) Antibiotic resistant bacteria found in municipal drinking water. Environ Process 3(3): 541–552. doi:10.1007/s40710-016-0149-z
Knapp CW, Engemann CA, Hanson ML, Keen PL, Hall KJ, Graham DW (2008) Indirect evidence of transposon-mediated selection of antibiotic resistance genes in aquatic systems at low-level oxy-tetracycline exposures. Environ Sci Technol 42(14):5348–5353. doi:10.1021/es703199g
Kummerer K (2009a) Antibiotics in the aquatic environment-a review-Part I. Chemoshpere 75:417–434. doi:10.1016/j.chemosphere. 2008.11.086
Kummerer K (2009b) Antibiotics in the aquatic environment-a review-Part II. Chemoshpere 75:435–441. doi:10.1016/j.chemosphere. 2008.12.006
Li D, Zeng S, He M, Gu AZ (2016) Water disinfection byproducts induce antibiotic resistance-Role of environmental pollutants in resistance phenomena. Environ Sci Technol 50(6):3193–3201. doi:10.1021/acs.est.5b05113
Lindsey HA, Gallie J, Taylor S, Kerr B (2013) Evolutionary rescue from extinction is contingent on a lower rate of environmental change. Nature 494(7438):463–467. doi:10.1038/nature11879 Liu A, Fong A, Becket E, Yuan J, Tamae C, Medrano L, Maiz M,
Wahba C, Lee C, Lee K, Tran KP, Yang H, Hoffman RM, Salih A, Miller JH (2011) Selective advantage of resistant strains at trace levels of antibiotics: a simple and ultrasensitive color test for detection of antibiotics and genotoxic agents. Antimicrob Agents Chemother 55(3):1204–1210. doi:10.1128/AAC.01182-10 Lopez E, Blazquez J (2009) Effect of subinhibitory concentrations of
antibiotics on intrachromosomal homologous recombination in Escherichia coli. Antimicrob Agents Chemother 53(8): 3411–3415. doi:10.1128/AAC.00358-09
Lopez E, Elez M, Matic I, Blazquez J (2007) Antibiotic-mediated recombination: ciprofloxacin stimulates SOS-independent recombination of divergent sequences inEscherichia coli. Mol Microbiol 64(1):83–93. doi:10.1111/j.1365-2958.2007.05642.x Lv L, Jiang T, Zhang S, Yu X (2014) Exposure to mutagenic
disin-fection by-products leads to increase of antibiotic resistance in Pseudomonas aeruginosa. Environ Sci Technol 48 (14):8188–8195. doi:10.1021/es501646n
Mc Cay PH, Ocampo-Sosa AA, Fleming GT (2010) Effect of sub-inhibitory concentrations of benzalkonium chloride on the com-petitiveness of Pseudomonas aeruginosa grown in continuous culture. Microbiol 156(Pt 1):30–38. doi:10.1099/mic.0.029751-0 Moen B, Rudi K, Bore E, Langsrud S (2012) Subminimal inhibitory concentrations of the disinfectant benzalkonium chloride select for a tolerant subpopulation ofEscherichia coliwith inheritable characteristics. Int J Mol Sci 13(4):4101–4123. doi:10.3390/ ijms13044101
Morero NR, Monti MR, Argarana CE (2011) Effect of ciprofloxacin concentration on the frequency and nature of resistant mutants selected fromPseudomonas aeruginosamutS and mutT hyper-mutators. Antimicrob Agents Chemother 55(8):3668–7366. doi:10.1128/AAC.01826-10
Myers F (2008) Biocidal agents: modes of action and correlation with antibiotic resistance. The Biomedical Scientist 8(6):227–231 Quinlan EL, Nietch CT, Blocksom K, Lazorchak JM, Batt AL,
exposed to tetracycline in stream mesocosms. Environ Sci Technol 45(24):10684–10690. doi:10.1021/es202004k
Sandegren L (2014) Selection of antibiotic resistance at very low antibiotic concentrations. Ups J Med Sci 119(2):103–107. doi:10. 3109/03009734.2014.904457
Seier-Petersen MA, Jasni A, Aarestrup FM, Vigre H, Mullany P, Roberts AP, Agerso Y (2014) Effect of subinhibitory con-centrations of four commonly used biocides on the conjugative transfer of Tn916 inBacillus subtilis. J Antimicro Chemother 69 (2):343–348. doi:10.1093/jac/dkt370
Shrivastava R, Upreti RK, Jain SR, Prasad KN, Seth PK, Chaturvedi UC (2004) Suboptimal chlorine treatment of drinking water leads to selection of multidrug-resistant Pseudomonas aeruginosa. Ecotoxicol Environ Saf 58(2):277–283. doi:10.1016/s0147-6513 (03)00107-6
Tello A, Austin B, Telfer TC (2012) Selective pressure of antibiotic pollution on bacteria of importance to public health. Environ Health Persp 120(8):1100–1106. doi:10.1289/ehp.1104650
Thi TD, Lopez E, Rodriguez-Rojas A, Rodriguez-Beltran J, Couce A, Guelfo JR, Castaneda-Garcia A, Blazquez J (2011) Effect of recA inactivation on mutagenesis ofEscherichia coliexposed to sub-lethal concentrations of antimicrobials. J Antimicrob Chemother 66(3):531–538. doi:10.1093/jac/dkq496
Warringer J, Blomberg A (2003) Automated screening in environmental arrays allows analysis of quantitative phenotypic profiles in Sac-charomyces cerevisiae. Yeast 20(1):53–67. doi:10.1002/yea.931 Xu L, Ouyang W, Qian Y, Su C, Su J, Chen H (2016)
High-throughput profiling of antibiotic resistance genes in drinking water treatment plants and distribution systems. Environ Pollut 213:119–126. doi:10.1016/j.envpol.2016.02.013