Sofia Koukoura1, James Carroll2, and Alasdair McDonald3
1,2,3University of Strathclyde, Glasgow, G1 1XW, UK
sofia.koukoura@strath.ac.uk j.carroll@strath.ac.uk alasdair.mcdonald@strath.ac.uk
ABSTRACT
This paper aims to present the development of a framework for monitoring of wind turbine gearboxes and prognosis of gear fracture faults, using vibration data and machine learn-ing techniques. The proposed methodology analyses gear vi-bration signals in the order domain, using a shaft tachometer pulse. Indicators that represent the health state of the gear are algorithmically extracted. Those indicators are used as features to train diagnostic models that predict the health sta-tus of the gear. The efficacy of the proposed methodology is demonstrated with a case study using real wind turbine vibra-tion data. Data is collected for a wind turbine at various time steps prior to failure and according to the maintenance reports there is enough data to form a healthy baseline. The data is classified according to the time before failure that the signal was collected.The learning algorithms used are discussed and their results are compared. The case study results indicate that this data driven model can lay the groundwork for a ro-bust framework for the early detection of emerging gear tooth fracture faults. This can lead to minimisation of wind turbine downtime and revenue increase.
1. INTRODUCTION
Renewable energy generation capacity must be increased if the ambitious targets of climate protection and energy secu-rity are to be achieved. Wind energy harvesting has become a strong and fast growing renewable energy technology world-wide due to recent technological advances and commercial growth. To ensure wind energy is truly competitive with tra-ditional fossil fuel and nuclear energy generation, ways of reducing the cost of energy cost must be investigated. A large proportion of the total cost of energy from wind in large wind farms is composed of operation and maintenance costs. These costs can be reduced if incipient machinery faults are success-fully detected before they become catastrophic failures.
Un-Sofia Koukoura et al. This is an open-access article distributed under the terms of the Creative Commons Attribution 3.0 United States License, which permits unrestricted use, distribution, and reproduction in any medium, pro-vided the original author and source are credited.
expected failures of components directly translates to wind turbine downtime, loss of reliability and revenue reduction. Therefore, effective wind turbine condition monitoring (CM) that enables optimum maintenance actions is becoming criti-cal (Crabtree, Zappal´a, & Hogg, 2015).
The main two categories of maintenance for wind turbines are either corrective or preventive maintenance. Corrective main-tenance concerns mainmain-tenance that is only performed once a component fails completely, whereas preventive maintenance is performed before the occurrence of a potential failure (Nielsen & Sørensen, 2011). Preventive maintenance can be further classified into scheduled maintenance and condition-based maintenance. Scheduled maintenance refers to main-tenance that happens at a fixed frequency whereas condition-based maintenance involves continuous health monitoring of wind turbine components. This type of maintenance utilises an estimation of the current and future condition of a compo-nent in order to provide an optimised maintenance scheduling that prevents failures without resorting to over-maintenance (Verbert, De Schutter, & Babuˇska, 2017). This optimised maintenance scheduling offers extended machine lifetime, as well as reduced maintenance costs and downtime.
Current practice in the wind turbine industry involves sched-uled maintenance, but owing to recent developments in the field of sensing and signal processing, modern wind turbines are equipped with CM systems for the active remote moni-toring of their components (Byon, P´erez, Ding, & Ntaimo, 2011). CM systems provide signals (vibration or electrical) whose information is used to take suitable maintenance ac-tions.
wind turbine fault detection and decision making. To achieve this, a robust predictive framework is required.
To this end, a multi-criteria condition monitoring framework is proposed that can be used as a basis for a robust condition-based maintenance tool. This framework combines several vibration signal features as input and returns the condition of the gear as an output.
Hence, this paper aims to present the development of a frame-work concerning the processing of vibration data and train-ing of appropriate models for the condition monitortrain-ing of wind turbine gearboxes, focusing on specific failure modes. Section 1 introduces the papers scope and motivation of re-search. Section 2 refers to the research background which involves the analysis of the vibration signals and the fault de-tection process, taking into account the variable speed of the turbine. In Section 3 the structure of a wind turbine gearbox is explained and the proposed methodology on vibration data analysis and model training is presented. Section 4 demon-strates the implementation and validation of the methodol-ogy in a case study concerning a real wind turbine gear fault. Section 5 presents the results of the case study and Section 6 concludes with the discussion and future research steps for the methodology development. The novelty in this paper lies in the combination of identification techniques used to detect the fault and train the prognostic model. A further element of novelty is the high quality vibration data and failure mode used to validate the techniques in the case study.
2. RESEARCHBACKGROUND
The aim of health condition prognostics is to predict the equipment future health conditions and the remaining useful life, based on the condition measurements at each inspection point. Some prognostics methods are also capable of estimat-ing the associated prediction uncertainties. The health con-dition prediction methods can be divided into model-based methods and data-driven methods. The model-based meth-ods, also known as the physics-of failure methmeth-ods, perform reliability prognostics using equipment physical models and damage propagation models. Model-based prognostics meth-ods have been reported for analyzing component reliabil-ity such as bearings (Marble & Morton, 2006) and gear-boxes (Kacprzynski, Roemer, Modgil, Palladino, & Maynard, 2002), (Li & Lee, 2005). However, physics-of-failure mod-els pose some limitations in building modmod-els and calculating dynamic responses in complex systems. On the other hand, data-driven methods directly utilize the collected condition monitoring data for health condition prediction, and do not re-quire physics-of-failure models. Examples of the data-driven methods include the proportional hazards model (Banjevic, Jardine, Makis, & Ennis, 2001), the Bayesian prognostics methods (Gebraeel, Lawley, Li, & Ryan, 2005), and the ANN
based prognostics methods (Tian, 2012), (Tian, Wong, & Safaei, 2010).
Based on data-driven approaches, vibration analysis is one of the most commonly used mechanisms for condition mon-itoring of wind turbines, especially on gearboxes (Randall, 2011). Vibration signals produced by the rotating gears and bearings whose current health conditions need to be diag-nosed are commonly analyzed either by broadband-based methods or spectral line analysis methods (Lu & Chu, 2010). In broadband analysis, parameters such as root mean square, or kurtosis are calculated based on the obtained output sig-nals. Spectral line analysis methods measure the increase in the frequencies of the impulse signals and can indicate when a component failure is about to occur (Lu & Chu, 2010).
Vibration analysis requires the installation of acceleration transducers on the gearbox surface, which offers sensitivity in fault discovery. Different vibration analysis methods are evaluated and presented in (Sheng, 2012) . In terms of di-agnosis methods, spectral kurtosis has been used to detect a tooth crack in the ring gear of a wind turbine planetary gearbox (Barszcz & Randall, 2009). A demodulation analy-sis method based on ensemble empirical mode decomposition and energy separation to diagnose planetary gearbox faults is proposed in (Teng, Wang, Zhang, Liu, & Ding, 2014). Side-band energy ratio can be calculated from spectrum data and it is sensitive to amplitude and frequency modulation, giving an indication of the health state of the gear (Hanna, Hatch, Kalb, Weiss, & Luo, 2011).
A condition based maintenance method applied on a wind farm level is proposed in (Tian, Jin, Wu, & Ding, 2011), us-ing Artificial Neural Networks. Support Vector Machines (SVMs) with different kernels are tested on wind turbine gearbox vibration data, examining imbalance and misalign-ment in (Santos, Villa, Re˜nones, Bustillo, & Maudes, 2015). SVMs are also used in (Leahy, Hu, Konstantakopoulos, Spanos, & Agogino, 2016) to diagnose wind turbine faults based on operational data.
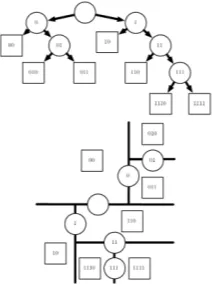
A decision tree is a simple representation used for classify-ing. As shown in Figure 1 (Goodfellow, Bengio, & Courville, 2016), each node of the decision tree is associated with a re-gion in the input space, and internal nodes (circles) break that region into one sub-region for each child of the node (typ-ically using an axis-aligned cut). Space is thus sub-divided into non-overlapping regions, with a one-to-one correspon-dence between leaf nodes (squares) and input regions. Each leaf node usually maps every point in its input region to the same output.
3. METHODOLOGY
Figure 1. Diagrams describing how a decision tree works. Each node of the tree chooses to send the input example to the child node on the left (0) or or the child node on the right (1) (Top). The tree divides space into regions (Bottom).
(Goodfellow et al., 2016)
the wind turbine gearbox vibration signal, the angular re-sampling of the signal due to the variable speed, the feature extraction and the model training. This methodology was de-veloped using MATLAB programming language and utilises the signal processing and classification libraries.
3.1. Wind Turbine Vibration Signal
In this section, the wind turbine gearbox structure, signal ac-quisition system and processing are presented.
3.1.1. Wind Turbine Gearbox Structure
Thanks to the advantages of large transmission ratio and strong load-bearing capacity, planetary gearboxes are widely used in wind turbines. A typical wind turbine gearbox struc-ture consists of three stages: one low speed planetary stage (PS) and two parallel stages, namely a high speed (HS) stage and an intermediate speed (IS) stage. The main shaft is con-nected to the planet carrier (PLC) and the HS pinion of the gearbox is coupled to the generator.
[image:3.612.118.228.75.218.2]The gearbox internal structure is shown in Figure 2 and the characteristic gear mesh frequencies (GMF) are determined in Table 1.
Table 1. Fundamental Gear Frequencies
Gear Element # Teeth Speed GMF PS Planet Carrier fa
PS Ring Gear Zr Fixed
PS Planet Gear Zp faZZr
p faZr
PS Sun Pinion Zs f
s=fa(1−ZZrs)
LS Gear Zl Z
ipfi
IS Pinion Zip f
i=ZZiplfs
IS Gear Wheel Zig Z
hfh
HS Pinion Zh fh=
Zig
Zhfi
Figure 2. Gearbox Internal Nomenclature
3.1.2. Wind Turbine Signal Acquisition
Vibration signals are obtained by accelerometers which are mounted on the gearbox surface. Each sensor has a different sensitivity and represents a different component of the gear-box. A tachometer pulse signal is usually provided as well, so that the equal time sampled data can be converted into equal shaft angular space data. The multi-channel vibration signals are collected and analysed in the frequency domain. The fun-damental frequencies of the gears are computed according to Table 1.
3.1.3. Data Pre-Processing: Angular Re-sampling
The required rotational speed of the wind turbine rotor is determined by the torque controller in response to the wind speed and therefore is not constant. In variable-speed rotating machinery, vibration signals are non-stationary due to speed alteration. Due to the rotor speed variation within the time window of the data acquisition, conventional signal process-ing techniques are insufficient because spectral leakage can occur in the frequency domain. The frequencies of the vibra-tions though, are proportional to the rotational speed and the constants of proportionality are the orders. By re-sampling the non-stationary vibration signals, it is possible to recon-struct cyclo-stationary vibration signals in the angular do-main, to avoid the mismatch between angle and time infor-mation. Therefore, computed order tracking is used and its principles are explained in (Fyfe & Munck, 1997).
[image:3.612.55.295.608.712.2]3.2. Fault Detection
When a gear has a local defect, such as a fatigue crack, the stiffness of the neighboring teeth is affected and this produces changes in the vibration signal. These changes are defined by amplitude and frequency modulation. The modulated gear meshing vibration is given by Eq. (1) (McFadden, 1986).
y(t) =
M
X
m=0
Xm(1 +am(t)) cos(2πmZfst+φm+βm(t))
(1) WhereZis the number of teeth on the gear,fsis the shaft ro-tational frequency and thereforeZfsis the mesh frequency,
am(t)is the amplitude modulation function,bm(t)is the fre-quency modulation function,φmis the initial phase of ampli-tude modulation andmis the integer.
As the modulation is periodic with the gear shaft rotation fre-quency fs, these functions may be represented by discrete Fourier series, as in Eq. (2, 3).
am(t) = N
X
n=0
Amncos(2πnfst+amn) (2)
bm(t) = N
X
n=0
Bmncos(2πnfst+βmn) (3)
Note that the modulation functions may differ withm.
In the frequency domain, the Fourier transform Y(f) will comprise the fundamental and harmonics of the meshing quency surrounded by modulation sidebands. Multiple fre-quencies in the modulation cause multiple sidebands to ap-pear in the spectrum. These sidebands occur at frequencies ofZfs±kfswherekis an integer of 1 or higher.
The signal analysis is performed through the MATLAB signal processing toolbox. Spectral line analysis is used to diagnose the health state of the vibration signals. After the application of order tracking, the spectrum has clear distinct frequency components which allows for an automatic procedure of al-gorithmic order peak detection. The health indicators used to diagnose the state of the gear are computed on the second har-monic of the gear mesh frequencies of the vibration signals:
• Sideband Energy Ratio (SER)
• Sideband Average Power (SAP)
• Narrowband Kurtosis (KUR)
The SER algorithm sums the amplitudes of the first six sideband peaks on each side of the center mesh frequency
P6
i=−6ASB,i and divides by the amplitude of the center mesh frequencyAF, as in Eq. (4).
SER=
P6
i=−6ASB,i
AF
(4)
For a healthy gear mesh the sidebands have a small amplitude compared to the center mesh frequency. As damage develops on a gear tooth, the sideband rise in amplitude which results in a larger SER value.
The SAP algorithm calculates the total power of the first six sidebands rising around the center mesh frequency. The power is normalised with the length of the data segment.
SAP=
PN
i=1|A(i)| 2
N (5)
Where N is the length of the narrowband data segment and A is the Amplitude of the signal.
Kurtosis is a measure of how outlier-prone a distribution is. Assuming that the part of the spectrum that includes the cen-ter mesh frequency and a frequency incen-terval of up to six mul-tiples of the shaft rotational speed represents a distribution, then the kurtosis is calculated. If the kurtosis has a high value it means that the distribution is quite sharp and most values are concentrated in the center frequency. In case of a fault development, sidebands have increased amplitude in a spec-trum, which means that the values are more distributed to-wards the tails, so the kurtosis is lower.
KUR=
1
N
PN
i=1(A(i)−A¯) 4
(1
N
PN
i=1(A(i)−A¯)2)2
(6)
Lastly, the model should take into account that loading con-ditions affect the gear vibration signature to a great extent. Thus, the reference torque is calculated based on the pro-duced electrical powerP and generator speedωand is nor-malised with the rated torqueTR.
Ref. Torque= P
ω TR
(7)
3.3. Fault Prediction Model
The final aim of the methodology is to train fault prediction a model based on the extracted features. The features are la-beled as ‘healthy’ or ‘faulty’ based on whether the gearbox eventually failed within a time frame of 2 months. The fea-tures considered for the model training are presented in Table 2.These include the health indicators but also the reference torque, so as to distinguish any signal variations due to loads from the variations due to faults.
Table 2. Input features and equations.
Input Feature Equation
SER
P6
i=−6ASB,i AF
SAP
PN i=1|A(i)|2
N
KUR
1 N
PN
i=1(A(i)−A¯)4
(1 N
PN
i=1(A(i)−A¯)2)2
Ref. Torque P ωTR
of a target variable by learning simple decision rules inferred from the data features.
The cross validation method used to assess the performance for the model isk-fold cross validation with 5 folds. The val-idation accuracy calculated then is the average mean squared error between the observations in a fold when compared against predictions made with a tree trained on the out-of-fold data. The model is trained recursively 10000 times in order to ensure consistency in the results. The average model accu-racy is calculated based on the mean value of all the trained model accuracies.
Figure 3. Methodology flowchart.
4. CASESTUDY
To validate the suggested methodology, a case study on vibra-tion data from the same type of gearbox but for three different wind turbines is presented. The wind turbines considered in this study are rated at between 1.5 and 3 MW. The vibra-tion data acquisivibra-tion system consists of eleven accelerome-ters and a tachometer on the high speed shaft. The generator
speed, the wind speed and the power produced by the turbine are also recorded. The acquisition time of the signal is be-tween 10 and 11s and the sampling frequency is over 25kHz. Ranges are provided for the rated power, sampling period and sampling frequency for confidentiality reasons.
[image:5.612.52.297.338.593.2]This failure occurs on the pinion tooth of the intermediate stage of the gearbox. The tooth issue has been recorded as a gear tooth tip and flank fracture, as shown in Figure 4. Root cause analysis of this gear tooth issue has not yet been com-pleted by the OEM and is out with the scope of this paper.
Figure 4. Broken pinion on intermediate shaft
Data is collected for the wind turbines at various time steps prior to failure. The oldest dataset dates back to 2.5 years prior to failure and according to the maintenance reports the gearbox at this time is in a healthy state.
The data is classified as ‘faulty’ 2 months prior to failure, as this is the time when the sidebands are highly prominent (see Section 5) and at the same time is a sufficient period to schedule maintenance activities.
5. RESULTS
The signals obtained from the sensor on the intermediate speed shaft are collected and order tracking is applied. The order domain spectra of the vibration signals at different ac-quisition dates prior to failure is shown in Figure 5. The or-der number axis shows the high speed shaft oror-der, where the tachometer pulse is located. The vibration signal from gears depends highly on load and therefore the signatures plotted belong to similar loading conditions (Ref. Torque=0.8). The rising of sidebands around the center mesh frequency (order 8.6) becomes more prominent in time steps closer to failure, as expected.
To further illustrate the difference between healthy and faulty vibration signatures, Figure 6 shows order spectra for the same gearbox, which eventually failed, at 2 years (healthy) and 2 weeks (faulty) before failure respectively.
Figure 5. Order Spectra of Intermediate Speed Shaft Accel-eration for Varying Times Prior to Failure
6 7 8 9 10 11 12
Order Number 0
0.05 0.1 0.15 0.2 0.25 0.3
Order RMS Amplitude
[image:6.612.68.272.84.172.2]2 years before failure (healthy) 2 weeks before failure (faulty)
Figure 6. Order Spectra of Healthy and Faulty Signal
The input features of the prediction model are given in Sec-tion 3.3.
The performance of the classifier is visualised in the confu-sion matrix shown in Figure 8. Faulty condition can be trans-lated as up to 2 months prior to failure. The probability den-sity function of the model’s accuracy after the 10000 runs is shown in Figure 9. The mean value is 95.6% and the standard deviation is 0.011.
Out of the 27 healthy samples only 1 is detected as faulty and out of the 18 faulty samples only 1 is detected as healthy. Overall, 95.6% of the predictions are correct and 4.4% are wrong classifications.
The downside of predicted faulty but actually healthy is a re-dundant inspection. The downside of predicted healthy but actual faulty is more sever because it can lead to critical fail-ure.
Practically, this means that the model can either diagnose that a gear is healthy or predict that the gear is 1-2 months be-fore complete failure. With continuous monitoring, this can give sufficient time for maintenance actions and/or changes in operation to extend lifetime.
6. CONCLUSIONS
This paper aims to present a framework for wind turbine vi-bration data processing and fault identification and prognosis on component level. First, an overview of the current state of research in wind turbine condition monitoring was presented. Then, proposed methodology was presented and elaborated
0.2 0.4 0.6 0.8 1
Reference Torque 0
2 4 6 8 10
Kurtosis
2 year-6 months prior to failure 2 months-1 week prior to failure
0.2 0.4 0.6 0.8 1
Reference Torque 0
2 4 6 8 10 12
SER
2 year-6 months prior to failure 2 months-1 week prior to failure
0.2 0.4 0.6 0.8 1
Reference Torque
0 0.05 0.1 0.15 0.2
SAP
2 year-6 months prior to failure 2 months-1 week prior to failure
Figure 7. Health indicators as a function of the reference torque. Narrowband kurtosis (top left), SER (top right) and SAP (bottom).
healthy faulty
True Class
healthy
faulty
Predicted Class
Confusion Matrix
26 57.8%
1 2.2%
96.3% 3.7%
1 2.2%
17 37.8%
94.4% 5.6%
96.3% 3.7%
94.4% 5.6%
95.6% 4.4%
Figure 8. Confusion Matrix
through a case study using real wind turbine vibration data. The case study validated the model performance and effec-tiveness. According to the results, SAP,SER, narrowband kurtosis and a decision tree algorithm can be used to cor-rectly classify healthy or faulty data in discrete time ranges. These indicators have some dependence on the loading con-ditions and therefore the torque is taken into consideration in the model training.
Future research steps include further model verification using datasets from more wind turbine fleets, so that model robust-ness is increased. Testing other types of learning algorithms will also be considered.
REFERENCES
[image:6.612.95.248.223.315.2] [image:6.612.372.491.349.465.2]0.6 0.7 0.8 0.9 1 1.1 1.2 Accuracy
0 10 20 30 40
[image:7.612.98.249.79.200.2]Density
Figure 9. Probability Density Function of Classification Model Accuracy
maintenance optimization. INFOR: Information Sys-tems and Operational Research,39(1), 32–50. Barszcz, T., & Randall, R. B. (2009). Application of spectral
kurtosis for detection of a tooth crack in the planetary gear of a wind turbine.Mechanical Systems and Signal Processing,23(4), 1352–1365.
Byon, E., P´erez, E., Ding, Y., & Ntaimo, L. (2011). Simu-lation of wind farm operations and maintenance using discrete event system specification.Simulation,87(12), 1093–1117.
Carroll, J., McDonald, A., & McMillan, D. (2015). Failure rate, repair time and unscheduled o&m cost analysis of offshore wind turbines.Wind Energy.
Crabtree, C. J., Zappal´a, D., & Hogg, S. I. (2015). Wind energy: Uk experiences and offshore operational chal-lenges. Proceedings of the Institution of Mechani-cal Engineers, Part A: Journal of Power and Energy,
229(7), 727–746.
Fyfe, K., & Munck, E. (1997). Analysis of computed order tracking. Mechanical Systems and Signal Processing,
11(2), 187–205.
Gebraeel, N. Z., Lawley, M. A., Li, R., & Ryan, J. K. (2005). Residual-life distributions from component degrada-tion signals: A bayesian approach. IiE Transactions,
37(6), 543–557.
Goodfellow, I., Bengio, Y., & Courville, A. (2016). Deep learning. MIT Press.
Hanna, J., Hatch, C., Kalb, M., Weiss, A., & Luo, H. (2011). Detection of wind turbine gear tooth defects using side-band energy ratio. China Wind Power 2011; October, 19-21, 2011, Beijing, China.
Kacprzynski, G. J., Roemer, M. J., Modgil, G., Palladino, A., & Maynard, K. (2002). Enhancement of physics-of-failure prognostic models with system level features. In
Aerospace conference proceedings, 2002. ieee(Vol. 6, pp. 6–6).
Leahy, K., Hu, R. L., Konstantakopoulos, I. C., Spanos, C. J., & Agogino, A. M. (2016). Diagnosing wind turbine
faults using machine learning techniques applied to op-erational data. InPrognostics and health management (icphm), 2016 ieee international conference on(pp. 1– 8).
Li, C. J., & Lee, H. (2005). Gear fatigue crack prognosis us-ing embedded model, gear dynamic model and fracture mechanics.Mechanical systems and signal processing,
19(4), 836–846.
Lu, W., & Chu, F. (2010). Condition monitoring and fault diagnostics of wind turbines. InPrognostics and health management conference, 2010. phm’10.(pp. 1–11). Marble, S., & Morton, B. P. (2006). Predicting the
remain-ing life of propulsion system bearremain-ings. InAerospace conference, 2006 ieee(pp. 8–pp).
McFadden, P. (1986). Detecting fatigue cracks in gears by amplitude and phase demodulation of the meshing vi-bration. Journal of vibration, acoustics, stress, and re-liability in design,108(2), 165–170.
Nielsen, J. J., & Sørensen, J. D. (2011). On risk-based opera-tion and maintenance of offshore wind turbine compo-nents. Reliability Engineering & System Safety,96(1), 218–229.
Randall, R. B. (2011). Vibration-based condition moni-toring: industrial, aerospace and automotive applica-tions. John Wiley & Sons.
Santos, P., Villa, L. F., Re˜nones, A., Bustillo, A., & Maudes, J. (2015). An svm-based solution for fault detection in wind turbines.Sensors,15(3), 5627–5648.
Sheng, S. (2012). Wind turbine gearbox condition monitoring round robin study–vibration analysis. Contract, 303, 275–3000.
Teng, W., Wang, F., Zhang, K., Liu, Y., & Ding, X. (2014). Pitting fault detection of a wind turbine gearbox us-ing empirical mode decomposition. Strojniˇski vestnik-Journal of Mechanical Engineering,60(1), 12–20. Tian, Z. (2012). An artificial neural network method for
re-maining useful life prediction of equipment subject to condition monitoring. Journal of Intelligent Manufac-turing,23(2), 227–237.
Tian, Z., Jin, T., Wu, B., & Ding, F. (2011). Condition based maintenance optimization for wind power generation systems under continuous monitoring. Renewable En-ergy,36(5), 1502–1509.
Tian, Z., Wong, L., & Safaei, N. (2010). A neural network approach for remaining useful life prediction utilizing both failure and suspension histories. Mechanical Sys-tems and Signal Processing,24(5), 1542–1555. Verbert, K., De Schutter, B., & Babuˇska, R. (2017).