City, University of London Institutional Repository
Citation
:
Papapostolou, N. C., Nomikos, N., Pouliasis, P. K. & Kyriakou, I. (2014). Investor Sentiment for Real Assets: The Case of Dry Bulk Shipping Market*. Review of Finance, 18(4), pp. 1507-1539. doi: 10.1093/rof/rft037This is the accepted version of the paper.
This version of the publication may differ from the final published
version.
Permanent repository link:
http://openaccess.city.ac.uk/6751/Link to published version
:
http://dx.doi.org/10.1093/rof/rft037Copyright and reuse:
City Research Online aims to make research
outputs of City, University of London available to a wider audience.
Copyright and Moral Rights remain with the author(s) and/or copyright
holders. URLs from City Research Online may be freely distributed and
linked to.
Investor Sentiment for Real Assets: The Case of Dry-Bulk Shipping Market *
NIKOS C. PAPAPOSTOLOU, NIKOS K. NOMIKOS, PANOS K. POULIASIS and
IOANNIS KYRIAKOU
Cass Business School, City University London
Abstract. We investigate the role of sentiment and its implications for real assets. Using
shipping sentiment proxies that capture market expectations, valuation and liquidity, we
construct sentiment indices for the dry-bulk shipping market. Evidence suggests that
sentiment affects the monthly returns of real assets. The empirical findings also show that
market sentiment serves as a contrarian indicator for future cycle phases in all sectors.
Further, a sentiment-based trading simulation exercise on the sale and purchase of vessels
shows that investors can benefit from higher returns compared to the buy-and-hold
benchmark, while partially offsetting the highly volatile nature of the shipping industry.
Keywords: investor sentiment, real assets, cycles, trading strategies
JEL Classification: G11, G15, C13
* We thank an anonymous referee; Lucio Sarno; Maik Schmeling; Gurdip S. Bakshi;
Wolfgang Drobetz and the participants at the 2012 University of Hamburg symposium in
shipping risk management; we also thank participants at the 2013 Cass Business School
seminar, especially participants from Bloomberg, Braemar Seascope, Credit Agricole,
Goldman Sachs International, Howe Robinson, HSBC Bank Plc, Lloyd’s List, Morgan
1. Introduction
The impact of investor sentiment on the valuation of asset prices is an issue that has
attracted the interest of academics and practitioners alike. To a certain extent, discrepancies
between observed assets prices and their expected discounted present value are often
attributed to investor sentiment (Shleifer and Vishny, 1997). In this paper, we present
evidence that investor sentiment can also have a significant effect on the tangible assets of an
economy, such as in the market for the sale and purchase of second-hand vessels. Our interest
in this market stems from the importance of shipping to the world economy - since
approximately 90% of world trade is transported by sea according to the International
Maritime Organization - and its effectiveness as a global economic activity indicator (Kilian,
2009).
A number of studies provide empirical evidence on the role of investor sentiment in
the stock markets. Baker et al. (2012) construct global and local sentiment indices and show
that all indices are contrarian predictors of cross-sectional stock market returns. Stambaugh et
al. (2012) explore the role of sentiment in a broad set of anomalies in cross-sectional returns
and find that its predictive power is higher during high-sentiment periods. Berger and Turtle
(2012) find that portfolios with opaque firm characteristics offer the greatest marginal
performance when previous sentiment levels are at their lowest. Yu and Yuan (2011)
examine the influence of investor sentiment on the market’s mean-variance trade-off and
show that expected excess return is positively related to conditional variance only in
low-sentiment periods. Baker and Wurgler (2006, 2007) construct low-sentiment indices for the U.S.
stock market and show that sentiment has larger effects on stocks whose valuation is highly
subjective and difficult to arbitrage. Furthermore, low sentiment is related to subsequent
higher returns for particular categories of stocks (such as, young, high volatility, unprofitable,
study the relationship between investor sentiment and small-stock premium and find that
sentiment forecasts the returns of small and low institutional ownership stocks. Further,
Brown and Cliff (2004) investigate sentiment and its relation to short-term stock market
returns. They report that sentiment levels and changes are correlated with market returns,
although the predictive power for stock returns is small. Finally, Huan (2008) finds that
institutional investor sentiment, measured by the bull-bear spread, relates to the prices of SPX
options.
Prior literature (Barberis et al., 1998; Brown and Cliff, 2004; Baker and Wurgler,
2007) suggests that there is a broad range of variables measuring sentiment. For example,
Baker and Wurgler (2006) and Baker et al. (2012) use market price-based proxies, such as
closed-end fund discounts, IPOs volume and their first-day returns, volume turnover, equity
share of new issues, dividend premium and volatility premium. Other studies employ
micro-trading data; Wang (2001) employs micro-trading positions of large speculators, large hedgers and
small traders in the US futures markets, whereas Kumar and Lee (2006) and Barber et al.
(2009) use respectively broker data and transaction data. In addition, investor surveys (Lee et
al., 2002; Brown and Cliff, 2004; Menkhoff and Rebitzky, 2008) and consumer confidence
indices (Lemmon and Portniaguina, 2006; Schmeling, 2009) are also employed as proxies for
sentiment. Finally, investor sentiment has been linked to close-end fund discounts (Neal and
Wheatley, 1998; Swaminathan, 1996).
Given that the current literature is mainly devoted to the use of sentiment in
explaining stock returns, we extend these studies by examining, for the first time, the role of
sentiment and its implications for real assets, i.e., vessels. We employ proxies that reflect
market, and construct sentiment indices for the capesize, panamax, handymax and handysize
sectors1 as well as the overall dry-bulk shipping market.
We examine sentiment as a predictor of future vessel price returns and present
evidence that sentiment affects the monthly returns on real assets, not only stock market
returns as documented in the existing literature. We then investigate the predictive power of
sentiment in identifying vessel price cycle phases up to 6 months ahead and find a significant
contrarian relationship for market sentiment, while sector-specific sentiment is found to be
important only in the panamax sector. Finally, we perform a sentiment-based trading
simulation exercise for the sale and purchase of second-hand vessels. Our findings suggest
that sentiment-based strategies outperform the passive buy-and-hold strategy significantly by
offering higher annualized returns and lower volatility on the investment.
The outline of the paper is as follows. Section 2 describes the sentiment proxies and
the construction of the sentiment indices. Section 3 presents the empirical findings of
sentiment as a predictor of future vessel price returns and cycle phases. Section 4 illustrates
the trading simulation exercise of sentiment as an investment timing tool. Section 5
concludes.
2. Sentiment Indices
1 Capesize: dry-bulk carriers with a cargo-carrying capacity exceeding 150,000 dwt. These vessels generally
operate along long-haul iron ore and coal trade routes. Panamax: vessels with a cargo-carrying capacity of
60,000-99,999 dwt. These vessels carry coal, grains and, to a lesser extent, minor bulks, including steel
products, forest products and fertilizers. Handymax: vessels with a cargo carrying capacity of 40,000-59,999
dwt; these operate on a large number of geographically dispersed global trade routes, and carry primarily grains
and minor bulks. Handysize (dry-bulk): handysize vessels have a cargo carrying capacity of 10,000-39,999 dwt.
Generally, these vessels are versatile in terms of their operating characteristics and carry minor bulk cargoes
While investor sentiment may refer to as the propensity to trade on noise rather
information, it may also refer to investor optimism or pessimism (Antoniou et al., 2013). It is
evidenced that individuals with positive (negative) sentiment make optimistic (pessimistic)
judgments and selections (Bower, 1981; Wright and Bower, 1992). Measuring sentiment is
subjective since there is no consensus on what the appropriate proxies are (Schmeling, 2009).
We combine five proxies which in our view reflect the sentiment of participants in the
shipping market, in addition to a component of non-sentiment related idiosyncratic variation.
We classify our proxies into three main categories: market expectations (net contracting and
money committed), valuation (price-to-earnings and second-hand-to-newbuilding vessel price
ratios) and liquidity (turnover ratio). Our choice of sentiment proxies is based on the notion
that optimism/pessimism about the overall state of the dry-bulk shipping market can affect
the decision of investors about the sale and purchase of second-hand or the order of
newbuilding vessels. Following Baker and Wurgler (2006) and Baker et al. (2012), we
orthogonalize the raw sentiment proxies and then construct total, market and sector-specific
sentiment indices using the first principal component method.
2.1 SENTIMENT PROXIES
The first proxy we employ is net contracting (NC); this measures the number of orders
for newbuilding vessels which are contracted with shipyards every month in each sector after
accounting for order cancellations and vessels being removed from the market for scrapping.
The NC proxy is selected by analogy to Baker and Wurgler (2006, 2007) and Baker et al.
(2012) use of the number of initial public offerings (IPOs), as the demand for IPOs is said to
be extremely sensitive to investor sentiment. Further, according to the behavioural model of
Greenwood and Hanson (2013), high shipping earnings are associated with high second-hand
over-investment in new capacity during booms is due to shipowners being overconfident and
incorrectly believing that investments will continue to reap high returns; partly due to
“competition neglect” by shipowners, caused by the time lag involved in the shipbuilding
process (Kahneman, 2011). Hence, the motivation for using the net contracting proxy is
twofold; first, we assume that the demand for new vessels in the shipping market resembles
the demand for new equity issues in the financial markets and, second, shipping participants
tend to follow the herd and invest in new capacity when valuations are generally high. The
monthly net contracting is given by:
, , , , , , 1
where , is the orderbook, i.e., the number of vessels awaiting construction or being
constructed, for sector i and month t, , the number of vessel deliveries, and , the number of vessels being scrapped. The first term in Equation (1) provides the monthly change
in the orderbook less order cancellations. We then subtract scrapping of vessels to obtain NC.
This way our proxy takes into account order cancellations, which reflect investment sentiment
and conditions in shipping markets, and thus measures net investment in new capacity. We
assume that high-sentiment periods are characterized by high vessel orders with cancellations
and scrapping of vessels being at low levels.
The second proxy is the money committed (MC) in the dry-bulk market and is an
approximation of the funds committed for the purchase of newbuilding vessels:
, , , , 2
where , is the price of newbuilding vessels for sector i and month t. Broader measures
(2000) suggest that the share of equity issues in total equity and debt issues is a measure of
financing activity that can capture sentiment. In the shipping industry, the majority of capital
originates from bank finance, where 30% equity to 70% debt is the historical average for a
typical shipping project. Therefore, we choose the MC proxy as a measure of financing
availability and propensity to provide capital for new shipping investments. We assume that,
during freight market booms when sentiment is high, banks are also overconfident in their
decisions to provide capital; and they follow their competitors so that they do not lose their
market share as capital providers to the shipping industry. Hence, we expect MC to be
positively related to investor sentiment.
The third sentiment proxy is the price-to-earnings ratio (PE) for vessels:
, , ⁄ , , 3
where , is the price of 5-year old second-hand vessels, and , the annualized
earnings (1-year time-charter rates2) in sector i for month t. The PE ratio as a measure of sentiment has been considered previously in the literature and has been found useful in
predicting subsequent stock returns (Campbell and Shiller, 1998; Fisher and Statman, 2006;
Kurov, 2008). Generally, high PE ratios reflect the relative degree of overvaluation in asset
prices.In our case, the estimate of earnings used is forward-looking and reflects the expected
earnings from operating the vessel for one year from the point of valuation; we thus expect
high PE ratios to be associated with low sentiment levels. For example, if current vessel prices
are high relative to the 1-year earnings (i.e., high PE ratio), shipowners expect vessel prices to
drop in the future in anticipation of limited earnings growth; hence, sentiment is low.
2 Fixed daily freight rate, measured in US$/day, received by the shipowner for chartering (leasing or letting-out)
The fourth proxy we consider is the second-hand to newbuilding price ratio (SNB):
, , ⁄ , . 4
Newbuilding vessels have longer useful economic lives than identical second-hand vessels of
certain age (e.g. five or ten-year old vessels), which in general means are more expensive.
However, during prosperous and high sentiment periods, investors prefer to take advantage of
the prevailing market conditions immediately; as such, they favour the purchase of
second-hand vessels to avoid the time lag in the construction process of newbuildings3. This creates
an immediate delivery premium which occasionally drives second-hand above newbuilding
prices. The selection of SNB as a sentiment proxy is by analogy (inverse) to Baker and
Wurgler (2004) use of dividend premium. Dividends are generally perceived by investors as a
characteristic for safety (Baker and Wurgler, 2006). When dividends are at premium,
companies are more likely to pay them, and less so when they are at discount (Fama and
French, 2001). Therefore, companies appear to cater to prevailing sentiment for or against
“safety” when deciding about the dividend payments. Similarly, SNB reflects the preference
of market agents for second-hand vessels to newbuilding ones and measures the immediate
delivery premium, which is related to how optimistic investors feel about the current market
conditions.
Our last proxy reflects the relative liquidity in the dry-bulk market. The use of
liquidity as a sentiment proxy follows from Baker and Stein (2004) who suggest that liquidity,
more specifically turnover, can serve as an investor sentiment index. They argue that, under
3 The building of new vessels is characterized by significant construction lags. The actual construction time,
which is on average 2 years, may often be lengthened considerably by the lack of available berth capacity in
shipyards or due to order backlog. For example, Kalouptsidi (2013) quantifies the impact of time-to-build on
short-sales constraints, irrational investors are more likely to participate in the market and add
liquidity when they are optimistic. Short-sales constraints are even more important in the
shipping markets, as it is difficult and costly for participants to establish short positions on
vessels. Baker and Wurgler (2006, 2007) capture market liquidity by the ratio of trading
volume to the number of shares listed on the New York Stock Exchange; whereas Baker et al.
(2012) use the ratio of total dollar volume over a year to the total capitalization at the end of
the previous year. However, liquidity is an elusive notion (Amihud, 2002; Pastor and
Stambaugh, 2003) which has been represented by various empirical measures in the
literature4. Our choice of liquidity measure is driven by data availability at a monthly
frequency; therefore, we represent shipping market liquidity in terms of the turnover ratio.
The turnover ratio (TURN) measures the activity in the sale and purchase market for
second-hand vessels in terms of total number of vessels available in the market:
, , ⁄ , 5
where , is the total number of available vessels in sector i and month s, and , the number of vessels sold. We anticipate that high turnover periods are related to high sentiment.
The proxies are calculated on a monthly basis for the capesize, panamax, handymax
and handysize sectors of the dry-bulk market using data by Clarksons Shipping Intelligence
Network for the period February 1996 to January 2012. Since the proxies may embody a
component that reflects underlying macroeconomic fundamentals, we remove the
non-
4 Proxies for liquidity, among others, include: i) turnover (Amihud and Mandelson, 1986), ii) dollar volume
(Chordia et al., 2001), iii) share volume (Brennan and Subrahmanyam, 1995), iv) Roll implicit spread estimator
(Roll, 1984), v) illiquidity ratio (Amihud, 2002), and vi) proportion of zero returns measure (Lesmond et al.,
sentiment part by orthogonalizing the proxies to three macro variables: the G7 monthly
industrial production growth and two recession-period dummies for the G7 and Major 5 Asia
countries5, provided by the Organisation for Economic Co-operation and Development
(OECD). The chosen macro variables are not related to our proxies resulting in high average
correlations between the orthogonalized and raw proxies: 0.87, 0.92, 0.90, and 0.88 for the
capesize, panamax, handymax and handysize sectors, respectively. Further, the correlation
matrix of orthogonalized proxies indicates marginally higher co-movement compared to the
correlation matrix of raw proxies (not presented in the paper). Finally, we de-trend all proxies
using the Hodrick-Prescott (1997) filter6 and use their cyclical component in our analysis.
2.2 TOTAL, MARKET, AND SECTOR-SPECIFIC SENTIMENT INDICES
For each sector we construct a first-stage index comprising 15 loadings given by the
current, 1-month lagged and 2-month lagged orthogonalized (denoted by proxies. This
way we allow for a lead-lag relationship between the proxies as some of them may reflect a
shift in sentiment earlier than others (Brown and Cliff, 2004; Baker and Wurgler, 2006). To
decide which proxies will be eventually included in the total sentiment index, we calculate the
correlation between the first-stage index and the current and lagged proxies. The proxies with
the highest correlation qualify as the final sentiment proxies, and the first principal component
of the selected proxies provides the total sentiment index:
, 0.451 0.439 0.299 0.506 0.508 6
, 0.362 0.462 0.350 0.532 0.499 7
5 These macro variables are selected by taking into account the global nature of the shipping markets, although
we recognize that additional macro factors may also drive our proxies.
6 In our analysis we use a smoothing parameter of λ=14,000. Different values of λ were also tested with no
, 0.300 0.440 0.423 0.527 0.509 8
, 0.407 0.421 0.433 0.498 0.471 9
The variance explained by the first principal component in each sector is 52%, 60%,
61% and 62%. Thus, we conclude that most of the proxies’ common variation is captured by
one factor. Further, the high correlation between the first-stage indices and , for
each sector (ranging from 92% to 97%) suggests that dropping the remaining 10 proxies does
not lead to loss of information.
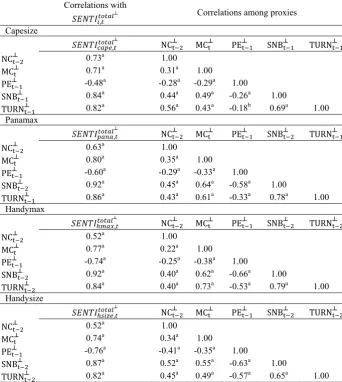
[INSERT TABLE I HERE]
We observe that the sentiment proxies enter the index with the expected sign (see
Section 2.1). In addition, MC carries the same time subscript across all sectors and lags all
other proxies, whereas the remaining proxies have different time subscripts. Additionally, NC
and SNB appear to be the leading proxies. Although the proxies are highly correlated with the
total sentiment index on average, there are instances where the correlation between the
proxies is relatively low (see Table I). This implies that our proxies contain unique
information in reflecting investor sentiment; therefore, the risk of using variables carrying the
same information is low.
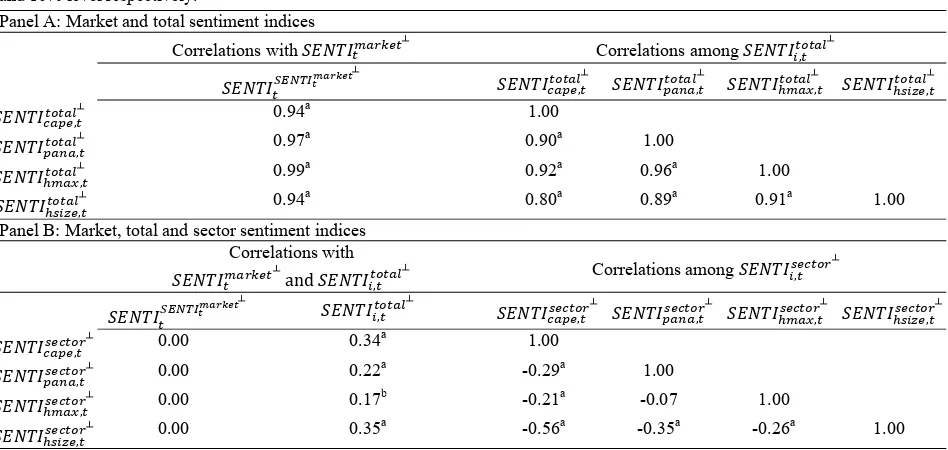
Table II, Panel A, shows high correlation between the total sentiment indices, which
can be attributed to shipping companies operating vessels in more than one sector within the
dry-bulk market and as such, sentiment flowing from one sector to another. Therefore, to
separate the overall market sentiment from the sector-specific sentiment we construct the
0.491 , 0.508 , 0.513 , 0.488 , 10
[INSERT TABLE II HERE]
Table II, Panel A also illustrates high correlations between the total sentiment and
market sentiment indices, implying that little information is lost by . Next, we
obtain the sector-specific sentiment indices ( , ) from the residuals of the
regression of , for each sector on . The correlation between the
sector-specific indices appears reduced (Table II, Panel B), suggesting that sentiment within
sectors is captured more suitably by , than , . The market and
sector-specific sentiment indices are plotted in Figure 1, from which it is obvious that market
sentiment is smooth, thus capturing market-wide changes. On the other hand, sector-specific
sentiment indices move in a more erratic way, i.e., reflecting the idiosyncratic features of each
sector.
[INSERT FIGURE 1 HERE]
2.3 VESSEL PRICES TURNING POINTS AND STATISTICS
In this section, we use the non-parametric algorithm of Bry and Boschan (1971) as
modified by Harding and Pagan (2002) to date the second-hand vessel prices turning points.
This method captures the turning points of vessel prices in an efficient way with a minimum
set of assumptions. The key assumptions made in determining the turning points are: i) an
initial peak (trough) is located at the highest (lowest) point in the vessel price series using a
(peak); iii) a cycle (defined as peak-to-peak or trough-to-trough) must have a minimum
duration of 18 months; iv) a phase (defined as peak-to-trough or trough-to-peak) must have a
minimum duration of 5 months; and v) turning points are not to be determined within the first
or last 5 months of the vessel price series. To identify the turning points, we use data running
from January 1976 to January 2012. Here, we report only the turning points (Figure 2) and
statistics (Table III) that apply to our sample period February 1996 to January 2012.
[INSERT FIGURE 2 HERE]
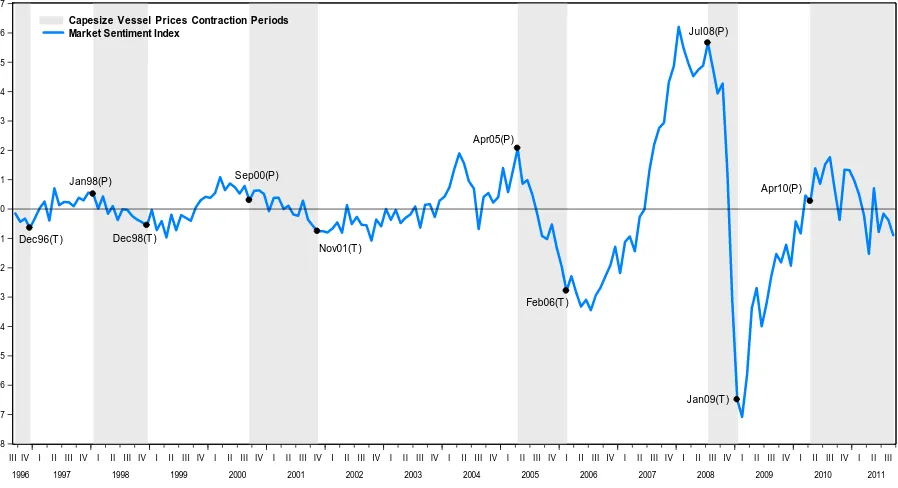
As a preliminary accuracy inspection of the selected sentiment proxies and the
constructed indices, we plot, in Figure 3, the capesize vessel prices turning points on the
market sentiment index. To begin with the troughs, it can be observed that market sentiment
coincides with the trough of December 1996, while it lags the remaining troughs by 1 to 4
months. In terms of peaks, market sentiment is a leading indicator on average. It exactly
matches the peak of January 1998, declines prior to the peaks of September 2000, April 2005
and July 2008; and lags the peak of April 2010 by 3 months. Overall, there is good
correspondence of the market sentiment index to the capesize vessel prices turning points, and
during the following episodes: Asian Crisis 1997/98, dot-com bubble 2000/01, and the recent
worldwide financial turmoil 2008/09.
[INSERT FIGURE 3 HERE]
The identified turning points and vessel price series are used to produce measures of
the average duration ( , and amplitude of expansions (through to peak) and contractions
, , 11
, , , 12
where is the number of turning points, is the number of observations, , is the
monthly percentage change of second-hand vessel prices, and , the cycle phase; when
measuring the duration of expansions, , takes value 1 (0) when in expansion (contraction)
and vice-versa in the case of contractions’ duration. In addition, we use the concordance
statistic by Harding and Pagan (2002) to calculate the proportion of time that the prices of two
types, i and j, of vessels are concurrently in the same phase:
, , 1 , 1 , . 13
To test the null hypothesis of no concordance, we follow Harding and Pagan (2006).
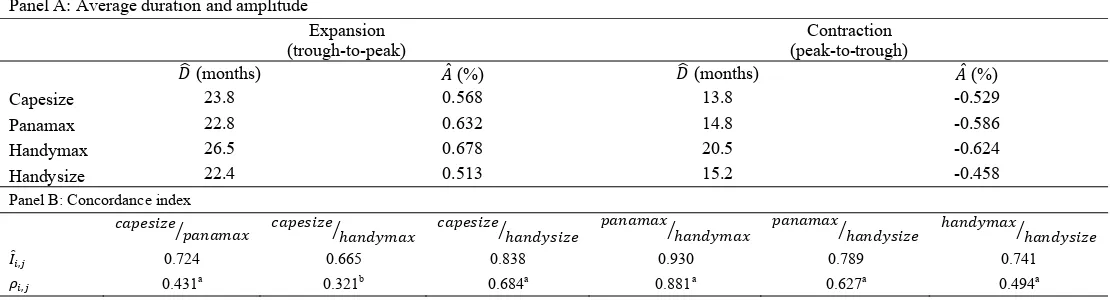
[INSERT TABLE III HERE]
Looking at Table III, Panel A, the capesize, panamax and handysize sectors
experience similar average duration of 14-15 (23-24) months from peak-to-trough
(trough-to-peak), i.e., expansions last for about 10 months more than contractions. In the case of the
handymax sector, an expansion (contraction) lasts for 26.5 (20.5) months, on average. In
terms of amplitude (Table III, Panel A), across sectors, panamax and handymax experience
the best returns during expansions (63.2% and 67.8% respectively), while they perform the
at 56.8% in expansions and -52.9% in contractions; whereas the handysize sector of smallest
cargo-carrying capacity has the lowest gains (22.4%) and losses (-45.8%) during upturns and
downturns respectively.
Finally, Table III, Panel B, shows that the concordance index between the dry-bulk
sectors is statistically significant. It is evident that the synchronization across the sector pairs
is high, e.g., the panamax/handymax and capesize/handysize pairs are synchronized 93.0%
and 83.8% of the time respectively. On the whole, synchronization statistics point towards
market integration and herd-like behaviour, where the market sentiment may play a major role
compared to the sector-specific sentiment.
3. Empirical Results
In what follows, we examine whether sentiment is a statistically significant predictor
of vessel price returns and propose a model that uses sentiment as a predictor for future vessel
price cycle phases. Further, we assess the fit of the logit model to the cycle chronology
identified in Section 2.3. Since the constructed sentiment indices are stationary and highly
persistent, they may impute biased coefficient and standard error estimates (Stambaugh, 1999;
Ferson et al., 2003). We adjust for these biases and test the robustness of the models by
employing the stationary bootstrap method7 of Politis and Romano (1994). To this end, we
7 The stationary, instead of the ordinary, bootstrap technique is employed since the latter is only valid in the case
of iid observations. When the ordinary bootstrap is applied to stationary and persistent variables (in our case the
sentiment indices), the re-sampled series will not preserve the statistical properties of the original dataset and
will lead to inconsistent results and statistical inference. The stationary bootstrap is based on re-sampling blocks
of random length, where the length of each block follows a geometric distribution with mean block length 1/q.
The choice of q depends on the degree of persistence: a large value of q is appropriate for data that exhibit serial
dependence and vice versa. The value of q chosen in our experiments is 0.1, corresponding to a mean block
bootstrap the original dataset to generate 5,000 new time series for the cycle phases and the
five sentiment proxies for each sector. Then, we construct the corresponding total, market and
sector-specific indices as outlined in Section 2.2. For each bootstrapped time series we
re-estimate the OLS and logit models and report the bias-adjusted standard errors.
3.1 PREDICTIVE REGRESSIONS FOR VESSEL PRICE RETURNS
Sentiment has been previously employed in the literature as a contrarian predictor of
the cross-section of expected stock returns (Brown and Cliff, 2004; Baker and Wurgler, 2006;
Lemon and Portniaguina, 2006, Schmeling, 2009). In a recent study, Baker and Wurgler
(2012) construct sentiment indices and find robust predictability of the time series of the
cross-section returns for six major stock markets. Since the constructed shipping sentiment
indices are categorized into total, market and sector-specific, we run similar regressions to
Baker and Wurgler (2012).
First, we regress the monthly vessel price returns for sector in month 1 on the
corresponding total sentiment index in month , or on the market and sector-specific
sentiment indices in month . We then run regressions for the vessel price cross-section
returns:
, , , 14
, , , 15
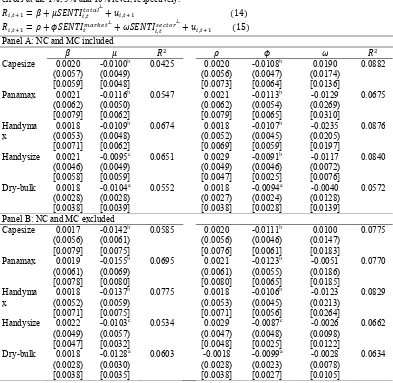
[INSERT TABLE IV HERE]
Table IV, Panel A, shows that total sentiment is statistically significant and a
For example, a decrease in the capesize total sentiment ( , ) by one standard
deviation is associated with 1.00 percent/month higher capesize vessel price returns. Further,
it appears that market sentiment overshadows sector-specific sentiment and that monthly
vessel price returns are mainly affected by market sentiment. For example, a decrease in the
market sentiment ) by one standard deviation is associated with 1.08
percent/month higher capesize vessel price returns. The results are in line with Baker and
Wurgler (2012) and suggest that the sentiment effect is noteworthy. In particular, market
sentiment appears to be significant across all sectors, implying cross-sector sentiment
contagion. Overall, the results suggest that sentiment affects the monthly returns on real
assets, in addition to sentiment affecting stock market returns as documented in the existing
literature.
Prompted by the referee’s suggestion that net contracting and money committed may
capture economic fundamentals rather sentiment, we follow the procedure outlined in Section
2.2 and construct sentiment indices excluding NC and MC from the sentiment proxy set8. We
then run the OLS regressions given by Equations (14) and (15), and the results are reported in
Table IV, Panel B. It can be observed that results are consistent, in terms of interpretation,
signs and statistical significance, when compared to results given by sentiment indices made
up by five proxies. We acknowledge that NC and MC are shipping industry specific proxies
and have not been previously employed in the literature. Nevertheless, we detect no effect on
the results when these are excluded from the sentiment proxy set.
3.2 PREDICTIVE REGRESSIONS FOR VESSEL PRICE CYCLE PHASES
To determine the relationship between sentiment and cycle phases, we use the logistic
regression to obtain the probability of expansion for up to =1, 2, 3, 4, 5, 6 months ahead. The
realized cycle phase , takes the value 1 when in expansion and 0 when in contraction. We
suppose that:
, θ , γ , , , 16
where the cycle phase approximation variable , reflects the current phase of the cycle. By
construction, the method of identifying turning points (Section 2.3) does not provide the
actual cycle phase at , since the procedure takes into account a window of 5 months to
identify a possible turning point at . As such, , is included in the model to capture the
persistence in the structure of the dependent variable. To construct , , we calculate the
cumulative returns , , of the vessel price series for different horizons h: short-term (h = 1,2,3,4 months), medium-term (h = 5,6,7,8 months), and long-term (h = 9,10,11,12 months). For a month to qualify as an expansion (contraction), we apply the restriction that a
combination of cumulative returns of 2 different horizons must be positive (negative). For all
types of vessels, the combination which minimizes the error (7% on average) when
approximating the actual cycle phase, is the 4- and 6-month cumulative returns. Therefore,
,
1, . . , , , , 0 , , 0
0, . . , , , , 0 , , 0 17
Finally, the error term , follows the logistic distribution:
, , 1 ,
1
1 θ , γ , ,
18
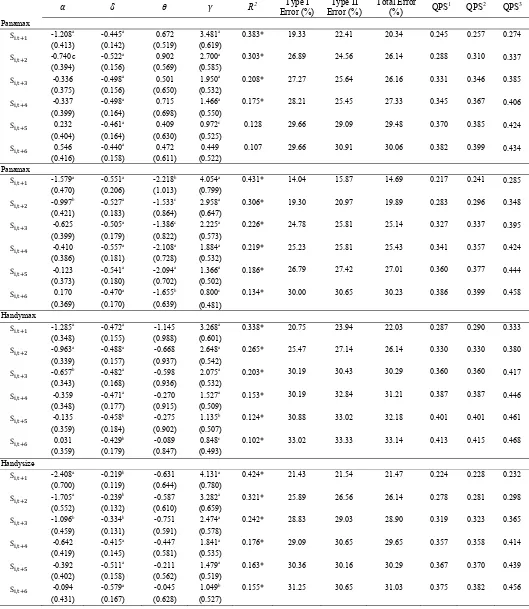
Table V presents the results for market and sector-specific sentiment and their
significance in predicting cycle phases in the 4 sectors9. Market sentiment is statistically
significant up to 6 months ahead and serves as a contrarian predictor of shipping cycle phases,
i.e., high sentiment today indicates future periods of contraction and vice versa. Further,
sector-specific sentiment appears to contain information about future cycle phases only for the
panamax sector. The cycle phase approximation variable is also significant and its positive
sign indicates that an expansion this month may lead to an expansion next month as well. We
have also run logit regressions when sentiment indices are constructed by excluding NC and
MC from the sentiment proxy set; and results10 are consistent in terms of sign and statistical
significance.
The R2 of the 1-month ahead models ranges between 43.1% and 33.8%, while, the fit gradually decreases as we move to predictions for more than 2 months ahead. The
goodness-of-fit can also be confirmed by the Hosmer-Lemeshow (1989) statistic being significant
(p-values >5%). To assess the prediction performance of the models, we consider the Type I and
Type II errors: Type I (II) error occurs when the model predicts contraction (expansion) and
the actual phase is expansion (contraction). Thus, we analyze the percentage of observations
correctly classified and misclassified by the models given a cut-off probability calculated as in
Palepu (1986). In general, Type II errors are higher than Type I errors, implying a tendency of
the models to underestimate contractions and overestimate expansions. The total error of the
1-month ahead models across sectors ranges from 14.69% to 22.73%.
9 For each sector, we have also run the model comprising the total sentiment and the cycle approximation
variable. For reasons of brevity, we do not report the results (available from the authors upon request) in the
paper.
Succinctly, our empirical results point towards the importance of market sentiment as
a contrarian indicator of future cycle phases in all four sectors, while sector-specific sentiment
is only important for panamax sector. As stated earlier in the paper, the statistical significance
of market sentiment may also imply the existence of sentiment contagion within the sectors of
the dry-bulk market. This may be explained by the fact that companies normally operate
across sectors, in addition to word of mouth sharing of information between shipowners
within the market.
3.3 DATING COMPARISON METRIC
In addition to model 1 (see Equation18), we have considered restricted alternative
models 2 and 3 comprising the total sentiment and the cycle approximation variable, and the
cycle approximation variable only, respectively. To assess the accuracy of model 1 against
models 2 and 3, we use the Quadratic Probability Score (QPS) of Diebold and Rudebusch
(1989):
, 2 , , 19
where , is given by Equation (18). The QPS ranges from 0 to 2, with a score of 0 corresponding to perfect fit to the cycle chronology (see Section 2.3). From Table V it is obvious that model 1 yields the lowest QPS values. When comparing models 1 and 2, the average improvement11 in QPS ranges from 5.04% in the handymax sector to 0.25% in the capesize sector. The improvement is significantly larger when we evaluate models 1 and 3, and ranges from 18.99% in the panamax sector to 11.78% in the handysize sector.
11 The improvement in QPS is calculated as the percentage difference between the QPS values of two models
for each forecasting horizon. The mean across each sector is then taken to estimate the average improvement in
Consequently, taking into account the market and sector-specific sentiment improves the cycle dating fitness.
4. Sentiment as an Investment Timing Tool
In what follows, we investigate the use of sentiment in the investment decision process
for the sale and purchase of second-hand vessels in the dry-bulk market12. For the trading
simulation exercise we consider monthly data for the period September 1996 to September
2011, including second-hand vessel prices, time-charter rates, and operating expenses from
Clarksons Shipping Intelligence Network, and the 3-month US T-bill rate from Thomson
Reuters.
Our aim is to illustrate the importance of sentiment as a market timing tool rather than
investigate different complex trading strategies. Hence, we choose to construct three simple
strategies based on: i) the 1-month ahead probability forecast (F1) for vessel price cycle
phases; ii) simple moving average (SMA) filters on (we have performed the
same analysis on , and , but results are not reported in the paper
since the strategy on proved superior); and iii) simple buy and hold which we
use as a benchmark for comparison purposes.
The first strategy is based on the 1-month ahead probability forecast generated by
Equation (18), where a buy signal is generated as soon as the model predicts expansion and a
sell signal when it forecasts contraction (the cut-off probability value is the same used in
12 We have run linear (Granger, 1969) and nonlinearcausality (Dicks and Panchenko, 2006) tests to check for
time-series dependencies between the sentiment indices and vessel prices. The tests indicate that there is a
two-way causality: vessel price changes depend on previous sentiment levels and vice versa. Since the sentiment
indices are orthogonalized, the two-way causality can be attributed to investors being over-confident/pessimistic
due to vessel price returns being high/low, respectively; and the fact that sentiment should not be regarded as a
Equation 18). For the moving averages trading strategy, we apply short and medium-term
monthly SMAs (1-12 months) on (for reasons of brevity, we report results
only for the 1, 6, 8, 10 and 12 SMAs). For this strategy, the buy and sell signals are based on
the SMA series crossover of the zero line: a crossover from below initiates a sell signal, while
from above a buy signal, i.e., the rule is based on the contrarian nature of sentiment in the
shipping market. Finally, the buy-and-hold strategy involves the investor buying the vessel
and operating it throughout her economic life, in our case the sample period.
The performance of the strategies is simulated for the capesize, panamax, handymax
and handysize sectors based on the expected 1-month return:
, , , , , , ,
, , , 20
where is the depreciation due to wear and tear from operating the vessel (0.5
percent/month) 13 ;
, , is the expected second-hand vessel price at time 1 for
sector , , , is the expected 1-month operating income generated by the vessel for
sector (calculated on a monthly basis as the difference between time-charter rates and
operating expenses), and , is the transaction cost incurred at the purchase of the vessel
(1 percent/transaction). We assume that, when investors hold no position in the market, funds
are invested in the 3-month US T-bills. Finally, we impose short-selling restrictions.
[INSERT TABLE VI HERE]
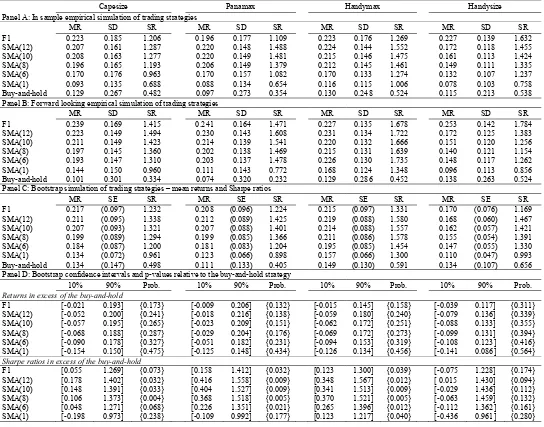
Table VI, Panel A, presents the in-sample empirical simulation results of the trading
strategies. Based on the annualized mean return (MR), standard deviation (SD) and Sharpe
13 Depreciation is estimated as the average value decline between 5 and 10 year old vessels, over the sample
ratio (SR) reports, the F1 and SMA strategies outperform the buy-and-hold in all sectors.
Overall, in terms of Sharpe ratios, SMA(12) produces the best results across sectors with the
ratio ranging from 1.287 to 1.552. The F1 and SMA strategies not only increase returns by
generating higher annualized mean returns of up to 22.7%, but also reduce the volatility of the
investment, hence improving the Sharpe ratios.
For a more realistic way to assess the efficiency of the buy and sell signals of the
different strategies, we further carry out an out-of-sample analysis for the period October
2004 to September 2011. To this end, we re-estimate the factor loadings to construct the total,
market and sector-specific indices (see Section 2.2) using observations up to September 2004.
For the F1 strategy, we estimate the model in Equation (18) using observations up to
September 2004 and generate probability forecasts for October 2004. Similarly, the buy or
sell signal of the SMA strategy for October 2004 is based on the monthly SMAs calculated in
September 2004. The above procedure is repeated every month by applying a rolling window
method.
Table VI, Panel B, shows the results for the out-of-sample performance of the
different trading strategies. In terms of MR, SD and SR, the F1 and SMA strategies still
outperform the buy-and-hold in all sectors. More specifically, in the capesize sector F1 yields
the highest annualized return of 23.9%, whereas SMA(12) the highest Sharpe ratio of 1.494.
F1 and SMA(12) generate respectively the highest annualized mean return of 24.1% and
Sharpe ratio of 1.608 in the panamax sector. Finally, the SMA(6 and 12) (F1) strategy
performs best in the handymax (handysize) sector with an annualized return of 23.1% (25.3%)
Overall, the trading simulation14 shows that incorporating sentiment in the vessel
investment/divestment timing decision can provide substantial gains. Investors can benefit
from higher returns on their investment; while at the same time partially offset the highly
volatile nature of the shipping industry.
4.1 REALITY CHECK
Despite the effective performance of the proposed F1 and SMA strategies, an
important issue which needs to be addressed is that of data snooping. As pointed out by
Sullivan et al. (1999) and White (2000), data snooping occurs when a dataset is used more
than once for selection and inference purposes. When testing different strategies, data
snooping can increase the probability of having satisfactory results purely to chance or the use
of posterior information, rather than the superior ability of the alternative strategies.
To assess the performance of the trading strategies we employ the stationary bootstrap
of Politis and Romano (1994) (see Sullivan et al., 1999; Alizadeh and Nomikos, 2007). For
this, we repeatedly generate artificial time series (5,000 in total) for the six sentiment proxies
over the period September 1996 to September 2004, construct the corresponding market
sentiment index and estimate the model given in Equation (18). The forward-looking
performance of each strategy is then tested for the period October 2004 to September 2011
using each bootstrapped sample. All trading strategies are implemented for each one of the
5,000 bootstrapped series, thus, generating a series of empirical distributions of mean returns
and Sharpe ratios. The null hypothesis tested is that the performance of the F1 and SMA
strategies is no better than the passive buy-and-hold strategy.
14 We have also performed the trading simulation (incl. the bootstrap simulation outlined in Section 4.1) when
sentiment indices are constructed by excluding NC and MC from the sentiment proxy set. We do not observe
The bootstrap simulation results are presented in Table VI, Panel C. The statistics
reported are: the annualized mean return; the standard error of mean returns; and the Sharpe
ratio across the bootstrapped samples. In terms of annualized mean returns, the F1 strategy
outperforms the other strategies in the capesize and handysize sectors, while the SMA(12)
strategy is superior in the panamax and handymax sectors, consistent with the in-sample
exercise in Panel A. Additionally, the SMA(12) strategy offers the best Sharpe ratios in all
sectors. Typically, we can conclude that the proposed trading strategies significantly
outperform the buy-and-hold benchmark. For instance, implementing the F1 or SMA(12)
strategies in the capesize sector boosts mean returns and Sharpe ratios by factors of
approximately 1.5 and 2.5, respectively.
Formal statistical tests are also conducted by considering the empirical confidence
intervals for the mean returns and Sharpe ratios of the strategies in excess of the buy-and-hold
(Table VI, Panel D). We construct 90% empirical confidence intervals for the excess
performance based on the bootstrap simulations and test whether the excess MRs and SRs are
significantly different from zero; the p-values15 of the tests are also reported. The results for
MRs in excess of the benchmark strategy show that no strategy achieves superior performance
at conventional significance levels. However, F1 and SMA strategies provide a significant
increase in Sharpe ratios compared to the buy-and-hold strategy, with the exception of the
handysize sector; only SMA(12) is statistically better at 10% significance level in this market.
Overall, the bootstrap simulation analysis corroborates that sentiment contains important
information that can be used in the investment timing decision for the sale and purchase of
second-hand vessels.
15 The p-values are calculated as the ratio of frequency of occurrence of negative (one-tail test) excess MRs or
SRs over the total number of simulations (5,000 replications). The null hypothesis is that there is no significant
5. Conclusion
In this paper, we consider shipping sentiment proxies that reflect market expectations,
valuation and liquidity, and construct market and sector-specific sentiment indices for the
capesize, panamax, handymax and handysize sectors of the dry-bulk market. We then
examine the implications of sentiment for real assets of the economy, i.e., vessels; in
particular, we study the use of sentiment as a predictor of vessel price returns. Sentiment is
found to be statistically significant and a contrarian indicator of future vessel price returns on
an individual sector basis and across all sectors. Our results add to those of the current
literature, i.e., in addition to stock market returns, sentiment also affects the monthly returns
on real assets.
Further, our analysis of the predictive power of sentiment for vessel price cycle phases
suggests that market sentiment is a contrarian indicator in all sectors and sector-specific
sentiment appears to be significant only in the panamax sector.The fact that market sentiment
contains significant information for future vessel price returns and cycle phases implies the
existence of possible cross-section sentiment contagion in the dry-bulk shipping market.
Finally, sentiment also plays an important role in the investment decision for the sale
and purchase of second-hand vessels. A sentiment-based trading simulation exercise suggests
that investors can benefit from higher annualized mean returns, while partially offsetting the
References
Alizadeh, A. H. and Nomikos, N. K. (2007) Investment timing and trading strategies in the
sale and purchase market for ships, Transportation Research Part B: Methodological
41, 126–143.
Amihud, Y. (2002) Illiquidity and stock returns: cross-section and time-series effects, Journal of Financial Markets5, 31–56.
Amihud, Y. and Mandelson H. (1986) Asset pricing and the bid-ask spread, Journal of Financial Economics17, 223-249.
Antoniou, C ., Doukas, J.A. and Subrahmanyam, A. (2013) Cognitive dissonance, sentiment,
and momentum, Journal of Financial and Quantitative Analysis48, 245-275.
Baker, M. and Wurgler, J. (2000) the equity share in new issues and aggregate stock returns,
Journal of Finance55, 2219–2257.
Baker, M. and Stein, J. (2004) Market liquidity as a sentiment indicator, Journal of Financial Markets7, 271-299.
Baker, M. and Wurgler, J. (2004) A catering theory of dividends, Journal of Finance 59, 1125-1165.
Baker, M. and Wurgler, J. (2006) Investor sentiment and the cross-section of stock returns,
Journal of Finance61, 1645–1680.
Baker, M. and Wurgler, J. (2007) Investor sentiment in the stock market, Journal of Economic Perspectives21, 129–151.
Baker, M., Wurgler, J., and Yuan, Y. (2012) Global, local, and contagious investor sentiment,
Journal of Financial Economics104, 272–287.
Barberis, N., Shleifer, A., and Vishny, R. (1998) A model of investor sentiment, Journal of Financial Economics49, 307–343.
Berger, D. and Turtle, H. J. (2012) Cross-sectional performance and investor sentiment in a
multiple risk factor model, Journal of Banking and Finance36, 1107–1121.
Bower, G. (1981) Mood and memory, American Psychologist 36, 129-148.
Brown, G. W. and Cliff, M. T. (2004) Investor sentiment and the near-term stock market,
Journal of Empirical Finance11, 1–27.
Brennan, M.J. and Subrahmanyam, A. (1995) Investment analysis and price formation in
securities markets, Journal of Financial Economics 38, 361-381.
Bry, G. and Boschan, C. (1971) Cyclical analysis of time series: selected procedures and computer programs, National Bureau of Economic Research (NBER), New York. Campbell, J.Y. and Shiller, R.J. (1998) Valuation ratios and the long-run market outlook,
Journal of Portfolio Management24, 11-26.
Chordia, T. Subrahmanyam, A. and Anshuman, V.R. (2001) Trading activity and expected
stock returns, Journal of Financial Economics59, 3-32.
Dicks, C. and Panchenko, V. (2006) A new statistic and practical guidelines for
nonparametric Granger causality testing, Journal of Economic Dynamics and Control
30, 1647–1669.
Diebold, F. X. and Rudebusch, G. D. (1989) Scoring the leading indicators, Journal of Business62, 369–391.
Fama, E.F. and French, K.R. (2001) Disappearing dividends: changing firm characteristics or
lower propensity to pay? Journal of Financial Economics60, 3-44.
Ferson, W. E., Sarkissian, S., and Simin, T. T. (2003) Spurious regressions in financial
Fisher, K. and Statman, M. (2006) Market timing in regressions and reality, Journal of Financial Research29, 293-304.
Granger, C. (1969) Investigating casual relations by econometric models and cross-spectral
methods, Econometrica37, 424–438.
Greenwood, R. And Hanson, S.G. (2013) Waves in ship prices and investment, unpublished
working paper, Harvard Business School.
Harding, D. and Pagan, A. (2001), Extracting, analysing and using cyclical information,
unpublished working paper, MPRA paper 15, University Library of Munich.
Harding, D. and Pagan, A. (2002) Dissecting the cycle: a methodological investigation,
Journal of Monetary Economics49, 365–381.
Harding, D. and Pagan, A. (2006) Synchronization of cycles, Journal of Econometrics 132, 59–79.
Hodrick, R. J. and Prescott, E. C. (1997) Postwar U. S. business cycles: an empirical
investigation, Journal of Money, Credit and Banking29, 1–16.
Hosmer Jr., D. W. and Lemeshow, S. (1989) Applied Logistic Regression, John Wiley & Sons, New York.
Huan, B. (2008) Investor sentiment in option prices, Review of Financial Studies21, 387–414.
Kahneman, D. (2011) Thinking fast and slow, Macmillan, New York.
Kalouptsidi, M. (2013) Time to build and shipping prices, American Economic Review
forthcoming.
Killian, L. (2009) Not all oil price shocks are alike: disentangling demand and supply shocks
in the crude oil market, American Economic Review99, 1053–1069.
Kurov, A. (2008) Investor sentiment, trading behaviour and institutional efficiency in index
futures markets, The Financial Review43, 107-127.
Lee, W., Jiang, C., and Indro, D. (2002) Stock market volatility, excess returns and the role of
investor sentiment, Journal of Banking and Finance26, 2277–2299.
Lemmon, M. and Portniaguina, E. (2006) Consumer confidence and asset prices: some
empirical evidence, Review of Financial Studies19, 1499–1529.
Lesmond, D.A., Ogden, J.P. and Trzcinka, C.A. (1999) A new estimate of transaction costs,
Review of Financial Studies12, 1113-1141.
McFadden, D. (1973) Conditional logit analysis of qualitative choice behaviour, in: P.
Zarembka (ed.), Frontiers in Econometrics, Academic Press, New York, pp. 105–142. Menkhoff, L. and Rebitzky, R. (2008) Investor sentiment in the US-dollar: longer-term,
nonlinear orientation on PPP, Journal of Empirical Finance15, 455–467.
Neal, R. and Wheatley, S. M. (1998) Do measures of investor sentiment predict returns?,
Journal of Financial and Quantitative Analysis33, 347–400.
Newey, W.K. and West, K.D. (1987) A simple, positive-definite, heteroskedasticity and
autocorrelation consistent covariance matrix, Econometrica55, 703–708.
Palepu, K. G. (1986) Predicting takeover targets: A methodological and empirical analysis,
Journal of Accounting and Economics8, 3–35.
Pastor, L. and Stambaugh, R.F. (2003) Liquidity risk and expected stock returns, Journal of Political Economy 111, 642-685.
Politis, D. N. and Romano, J. P. (1994) The stationary bootstrap, Journal of the American Statistical Association89, 1303–1314.
Roll, R. (1984) A simple implicit measure of the effective bid-ask spread in an efficient
Schmeling, M. (2009) Investor sentiment and stock returns: some international evidence,
Journal of Empirical Finance16, 394–408.
Shleifer, A. and Vishny, R. (1997) The limits of arbitrage, Journal of Finance52, 35–55.
Stambaugh, R. F. (1999) Predictive regressions, Journal of Financial Economics 54, 375–
421.
Stambaugh, R. F., Yu, J., and Yuan, Y. (2012) The short of it: investor sentiment and
anomalies, Journal of Financial Economics104, 288–302.
Swaminathan, B. (1996) Time-varying expected small firm returns and closed-end fund
discounts, Review of Financial Studies9, 845–887.
Sullivan, R., Timmermann, A., and White, H. (1999) Data-snooping, technical trading rule
performance, and the bootstrap, Journal of Finance54, 1647–1691.
Wang, C. (2001) Investor sentiment and return predictability in agricultural futures markets,
Journal of Futures Markets21, 929–952.
White, H. (2000) A reality check for data snooping, Econometrica68, 1097–1126.
Wright, F. and Bower, G. (1992) Mood effects on subjective probability assessment,
Organizational Behavior and Human Decision Process52, 276-291.
Table I. Correlation of index components and total sentiment indices
,
┴
is the first principal component of the five orthogonalized sentiment proxies for dry-bulk sector i. NC is the net contracting, MC the money committed, PE the price-to-earnings ratio, SNB the second-hand-to-newbuilding price ratio, and TURN the turnover ratio, defined in Section 2.1. The orthogonalized proxies labelled with ┴ are the residuals from the regression of each of the five raw sentiment proxies on the G7 industrial production growth and two-recession period dummies for the G7 and Major 5 Asia countries. Superscripts a, b, and c indicate significance at the 1%, 5% and 10% level, respectively.
Correlations with
,
┴ Correlations among proxies
Capesize
,
┴
NC┴ MC┴ PE┴ SNB┴ TURN┴
NC┴ 0.73a 1.00
MC┴ 0.71a 0.31a 1.00
PE┴ -0.48a -0.28a -0.29a 1.00
SNB┴ 0.84a 0.44a 0.49a -0.26a 1.00
TURN┴ 0.82a 0.56a 0.43a -0.18b 0.69a 1.00
Panamax
,
┴
NC┴ MC┴ PE┴ SNB┴ TURN┴
NC┴ 0.63a 1.00
MC┴ 0.80a 0.35a 1.00
PE┴ -0.60a -0.29a -0.33a 1.00
SNB┴ 0.92a 0.45a 0.64a -0.58a 1.00
TURN┴ 0.86a 0.43a 0.61a -0.33a 0.78a 1.00
Handymax
,
┴
NC┴ MC┴ PE┴ SNB┴ TURN┴
NC┴ 0.52a 1.00
MC┴ 0.77a 0.22a 1.00
PE┴ -0.74a -0.25a -0.38a 1.00
SNB┴ 0.92a 0.40a 0.62a -0.66a 1.00
TURN┴ 0.84a 0.40a 0.73a -0.53a 0.79a 1.00
Handysize
,
┴
NC┴ MC┴ PE┴ SNB┴ TURN┴
NC┴ 0.52a 1.00
MC┴ 0.74a 0.34a 1.00
PE┴ -0.76a -0.41a -0.35a 1.00
SNB┴ 0.87a 0.52a 0.55a -0.63a 1.00
Table II. Correlation of total, market and sector sentiment indices
┴
is the first principal component of ,
┴ , , ┴ , , ┴ , , ┴ . , ┴
are the r
from regressing ,
┴
┴for each sector. Superscripts a, b, and c indicate significance at the 1%, 5%
and 10% level respectively.
Panel A: Market and total sentiment indices
Correlations with ┴ Correlations among ,
┴ ┴ , ┴ , ┴ , ┴ , ┴ ,
┴ 0.94a 1.00
,
┴ 0.97a 0.90a 1.00
,
┴ 0.99a 0.92a 0.96a 1.00
,
┴ 0.94a 0.80a 0.89a 0.91a 1.00
Panel B: Market, total and sector sentiment indices
Correlations with
┴
and ,
┴ Correlations among , ┴
┴ , ┴ , ┴ , ┴ , ┴ , ┴ ,
┴ 0.00 0.34a 1.00
,
┴ 0.00 0.22a -0.29a 1.00
,
┴ 0.00 0.17b -0.21a -0.07 1.00
,
Table III. Dry-bulk vessel prices cycle phases statistics
The average duration ( ) and amplitude ( ) are calculated according to Harding and Pagan (2001). The statistics are estimated based on incomplete phases; if statistics were calculated on complete phases, the summation should run from the beginning of the first completed phase until the end of the last one rather than over 1,..,T. The concordance index ( , ) is estimated as proposed by Harding and Pagan (2002), and , is the correlation
coefficient estimated from the regression: , , ,⁄ where is the standard deviation of the cycle phase S(Harding and
Pagan, 2006).Superscripts a, b, and c indicate significance at the 1%, 5%, and 10% respectively. The null hypothesis of no concordance between two series corresponds to , 0 , using robust standard errors; corrected for heteroscedasticity and serial correlation.
Panel A: Average duration and amplitude
Expansion
(trough-to-peak) (peak-to-trough) Contraction
(months) (%) (months) (%)
Capesize 23.8 0.568 13.8 -0.529
Panamax 22.8 0.632 14.8 -0.586
Handymax 26.5 0.678 20.5 -0.624
Handysize 22.4 0.513 15.2 -0.458
Panel B: Concordance index
, 0.724 0.665 0.838 0.930 0.789 0.741
Table IV. Vessel price returns, total, market and sector-specific sentiment indices
OLS regressions of next month vessel price returns on current month total sentiment (Equation 14) or on current month market sentiment and current month sector sentiment (Equation 15). Panel A provides results when sentiment is captured by five sentiment proxies (NC, MC, PE, SNB, TURN), and Panel B when sentiment is captured by 3 proxies (PE, SNB, and TURN). The last rows (named Dry-bulk) of Panels A and B present the results of the pooled regressions for the cross-section analysis. Bias-adjusted standard errors, given by the stationary bootstrap of Politis and Romano (1994), are in (.); Newey-West (1987) standard errors are in [.]. Superscripts a, b, and c indicate significance based on the bootstrapped standard errors at the 1%, 5% and 10% level, respectively.
, ,
┴
, 14
,
┴
,
┴
, 15
Panel A: NC and MC included
Capesize 0.0020 (0.0057) [0.0059] -0.0100b (0.0049) [0.0048]
0.0425 0.0020 (0.0056) [0.0073] -0.0108b (0.0047) [0.0064] 0.0190 (0.0174) [0.0136] 0.0882 Panamax 0.0021 (0.0062) [0.0079] -0.0116b (0.0050) [0.0062]
0.0547 0.0021 (0.0062) [0.0079] -0.0113b (0.0054) [0.0065] -0.0129 (0.0269) [0.0310] 0.0675 Handyma x 0.0018 (0.0053) [0.0071] -0.0109b (0.0048) [0.0062]
0.0674 0.0018 (0.0052) [0.0069] -0.0107b (0.0045) [0.0059] -0.0235 (0.0205) [0.0197] 0.0876 Handysize 0.0021 (0.0046) [0.0058] -0.0095c (0.0049) [0.0059]
0.0651 0.0029 (0.0049) [0.0047] -0.0091b (0.0046) [0.0025] -0.0117 (0.0072) [0.0076] 0.0840 Dry-bulk 0.0018 (0.0028) [0.0038] -0.0104a (0.0028) [0.0039]
0.0552 0.0018 (0.0027) [0.0038] -0.0094a (0.0024) [0.0028] -0.0040 (0.0128) [0.0139] 0.0572
Panel B: NC and MC excluded Capesize 0.0017 (0.0056) [0.0079] -0.0142b (0.0061) [0.0075]
0.0585 0.0020 (0.0056) [0.0076] -0.0111b (0.0046) [0.0061] 0.0100 (0.0147) [0.0183] 0.0775 Panamax 0.0019 (0.0061) [0.0078] -0.0155b (0.0069) [0.0080]
0.0695 0.0021 (0.0061) [0.0080] -0.0123b (0.0055) [0.0065] -0.0051 (0.0186) [0.0185] 0.0770 Handyma x 0.0018 (0.0052) [0.0071] -0.0137b (0.0059) [0.0075]
0.0775 0.0018 (0.0053) [0.0071] -0.0106b (0.0045) [0.0056] -0.0123 (0.0213) [0.0264] 0.0829 Handysize 0.0022 (0.0049) [0.0047] -0.0103c (0.0057) [0.0032]
0.0534 0.0029 (0.0047) [0.0048] -0.0087c (0.0048) [0.0025] -0.0026 (0.0098) [0.0122] 0.0662 Dry-bulk 0.0018 (0.0028) [0.0038] -0.0128a (0.0030) [0.0035]
Table V. Cycle phases, market and sector-specific sentiment indices
The table provides the logistic regression results of Equation (18) for each sector and horizons 1, . . , 6 . The Macfadden (1973)R2 is reported; superscript *
indicates that the Hosmer-Lemeshow (1989) test statistic is significant (p-value> 5%). Bias-adjusted standard errors, given by the stationary bootstrap of Politis and
Romano (1994), are in (.). Superscripts a, b, and c indicate significance at the 1%, 5% and 10% level, respectively. Type I (II) error occurs when the model predicts contraction (expansion) and the actual phase is expansion (contraction); QPS is the quadratic probability score, with subscripts 1, 2, and 3 indicating respectively:
, 1 θ , γ , , , , 1 γ , , and P , 1 γ , ,
R2 Type I
Error (%)
Type II Error (%)
Total Error
(%) QPS1 QPS2 QPS3
Panamax
S, -1.208
a -0.445a 0.672 3.481a 0.383* 19.33 22.41 20.34 0.245 0.257 0.274
(0.413) (0.142) (0.519) (0.619)
S, -0.740c -0.522a 0.902 2.700a 0.303* 26.89 24.56 26.14 0.288 0.310 0.337
(0.394) (0.156) (0.569) (0.585)
S, -0.336 -0.498a 0.501 1.950a 0.208* 27.27 25.64 26.16 0.331 0.346 0.385
(0.375) (0.156) (0.650) (0.532)
S, -0.337 -0.498a 0.715 1.466a 0.175* 28.21 25.45 27.33 0.345 0.367 0.406
(0.399) (0.164) (0.698) (0.550)
S, 0.232 -0.461a 0.409 0.972c 0.128 29.66 29.09 29.48 0.370 0.385 0.424
(0.404) (0.164) (0.630) (0.525)
S, 0.546 -0.440a 0.472 0.449 0.107 29.66 30.91 30.06 0.382 0.399 0.434
(0.416) (0.158) (0.611) (0.522) Panamax
S, -1.579a -0.551a -2.218b 4.054a 0.431* 14.04 15.87 14.69 0.217 0.241 0.285
(0.470) (0.206) (1.013) (0.799)
S, -0.997b -0.527a -1.533c 2.958a 0.306* 19.30 20.97
19.89 0.283 0.296 0.348 (0.421) (0.183) (0.864) (0.647)
S, -0.625 -0.505
a -1.386c 2.225a 0.226* 24.78 25.81
25.14 0.327 0.337 0.395 (0.399) (0.179) (0.822) (0.573)
S, -0.410 -0.557a -2.108a 1.884a 0.219* 25.23 25.81 25.43 0.341 0.357 0.424
(0.386) (0.181) (0.728) (0.532)
S, -0.123 -0.541a -2.094a 1.366a 0.186* 26.79 27.42 27.01 0.360 0.377 0.444
(0.373) (0.180) (0.702) (0.502)
S, 0.170 -0.470a -1.655b 0.800c 0.134* 30.00 30.65 30.23 0.386 0.399 0.458
(0.369) (0.170) (0.639) (0.481) Handymax
S, -1.285a -0.472a -1.145 3.268a 0.338* 20.75 23.94 22.03 0.287 0.290 0.333
(0.348) (0.155) (0.988) (0.601)
S, -0.963a -0.488a -0.668 2.648a 0.265* 25.47 27.14 26.14 0.330 0.330 0.380
(0.339) (0.157) (0.937) (0.542)
S, -0.657b -0.482a -0.598 2.075a 0.203* 30.19 30.43 30.29 0.360 0.360 0.417
(0.343) (0.168) (0.936) (0.532)
S, -0.359 -0.471a -0.270 1.527a 0.153* 30.19 32.84 31.21 0.387 0.387 0.446
(0.348) (0.177) (0.915) (0.509)
S, -0.135 -0.458b -0.275 1.135b 0.124* 30.88 33.02 32.18 0.401 0.401 0.461
(0.359) (0.184) (0.902) (0.507)
S, 0.031 -0.429b -0.089 0.848c 0.102* 33.02 33.33 33.14 0.413 0.415 0.468
(0.359) (0.179) (0.847) (0.493) Handysize
S, -2.408
a -0.219b -0.631 4.131a 0.424* 21.43 21.54 21.47 0.224 0.228 0.232
(0.700) (0.119) (0.644) (0.780)
S, -1.705a -0.239b -0.587 3.282a 0.321* 25.89 26.56 26.14 0.278 0.281 0.298
(0.552) (0.132) (0.610) (0.659)
S, -1.096b -0.334b -0.751 2.474a 0.242* 28.83 29.03 28.90 0.319 0.323 0.365
(0.459) (0.131) (0.591) (0.578)
S, -0.642 -0.415a -0.447 1.841a 0.176* 29.09 30.65 29.65 0.357 0.358 0.414
(0.419) (0.145) (0.581) (0.535)
S, -0.392 -0.511a -0.211 1.479a 0.163* 30.36 30.16 30.29 0.367 0.370 0.439
(0.402) (0.158) (0.562) (0.519)
S, -0.094 -0.579a -0.045 1.049b 0.155* 31.25 30.65 31.03 0.375 0.382 0.456