City, University of London Institutional Repository
Citation:
Lugini, L., Marasco, E., Cukic, B. and Gashi, I. (2013). Interoperability in
Fingerprint Recognition: A Large-Scale Empirical Study. Paper presented at the 43rd Annual
IEEE/IFIP International Conference on Dependable Systems and Networks (DSN 2013), 24 -
27 June 2013, Budapest, Hungary.
This is the unspecified version of the paper.
This version of the publication may differ from the final published
version.
Permanent repository link:
http://openaccess.city.ac.uk/2355/
Link to published version:
Copyright and reuse: City Research Online aims to make research
outputs of City, University of London available to a wider audience.
Copyright and Moral Rights remain with the author(s) and/or copyright
holders. URLs from City Research Online may be freely distributed and
linked to.
City Research Online:
http://openaccess.city.ac.uk/
[email protected]
Interoperability in Fingerprint Recognition: A Large-Scale Empirical Study
Luca Lugini, Emanuela Marasco, Bojan Cukic
Lane Department ofComputer Science and Electrical Engineering West Virginia University
Morgantown, WVU (USA)
{emanuela.marasco, bojan.cukic}@mail.wvu.edu
Ilir Gashi
Centre for Software Reliability City University London London, United Kingdom
Abstract—Biometric systems are widely deployed in governmental, military and commercial/civilian applications. There are a multitude of sensors and matching algorithms available from different vendors. This creates a competitive market for these products, which is good for the consumers but emphasizes the importance of interoperability. Interoperability is the ability of a biometric system to handle variations introduced in the biometric data due to the deployment of different capture devices. The use of different biometric devices may increase error rates. In this paper, we perform a large-scale empirical study of the status of interoperability between fingerprint sensors and assess the performance consequence when interoperability is lacking.
I. INTRODUCTION
Fingerprint based user authentication is one of the most prolific commercial branches of biometrics. Since authentication process needs two samples from each user, most systems need to anticipate that the device used for a user’s enrollment (creation of the so called gallery image or template) may not be the same as the device used at the time of identification or identity verification (so called probe image or template). Fingerprints can be acquired through different Live-scan sensing technologies belonging to three main families: optical, solid-state and ultrasound [1]. In optical sensors, the finger is placed on the surface of a transparent prism which is typically illuminated trough the left side and the image is taken through a camera. The light entering the prism is reflected at the valleys and absorbed at the ridges of a fingerprint. In solid-state devices, the finger is modeled as the upper electrode of the capacitor, while the metal plate is modeled as the lower electrode. The variation in capacity between valleys and ridges can be measured when the finger is placed on the sensor. In the case of swipe
solid-state sensors, impressions are obtained by swiping the finger on the surface of the sensor. Ultrasound sensors exploit the difference of acoustic impedance between the skin of the ridges and the air in the valleys of a finger.
Even within the specific sensing technology, the acquisition may vary across sensors [1]. Different arrangements of sensing elements in each device may introduce variations and distortions in the biometric data. In particular, differences in resolution and scanning area impact
the feature set1 extracted from the acquired image. A
biometric matching system is required to handle variations introduced in the biometric data due to the deployment of different devices [2]. When the acquisition of the gallery and the probe samples is done using different biometric devices, the reliability of the biometric matcher may be reduced [4]. While such diversity is to be expected, commercial fingerprint matchers typically show a decrease in inter-device performance. A realistic scenario where the sensor interoperability is important is the US VISIT2 program, deployed at US international airports. In this application, fingerprints are currently enrolled using a 500 dpi optical sensor with a sensing area of 1.2" x 1.2". As different devices may be used for enrollment and then verification, the lack of interoperability between the devices is a significant concern. Interoperability grows in importance as the scale of adoption of biometric devices and the pace of innovation increase: older biometric devices get replaced with newer designs, but the samples enrolled with older devices remain in operational use.
In this paper we report early results from a large scale study of the interoperability of fingerprint devices. We captured fingerprints of 494 participants using 4 different two-dimensional biometric devices3. This is a large sample because we are dealing with human subjects and follow a properly approved collection protocol which requires volunteers to dedicate 1 hour of time for which they are adequately compensated.
We found that the genuine matching scores, the scores that reflect a similarity between two different samples collected from the same person, were generally higher when both images where captured using the same device, compared with cases where different devices are used for capture of the two samples. We also found that false-non-match-rates, the failures to determine that two samples come from one user, were affected by capture device diversity. Conversely the false-match-rates, representing instances in which fingerprints from two individuals are found to be sufficiently similar to declare them a match, were not. We
1A feature set is composed by characteristics describing the object
to be classified. It is expected to be representative with respect to the classes of the problem.
2 http://www.dhs.gov/us-visit-office
3We also captured data using three 3D devices, but have not yet
also found that the similarity scores are more sensitive to the quality of the fingerp different devices are used than in cases wh from the same device.
While most of the preliminary findings big surprise, the analysis we have done allow quantify the effects from the (lack of) between fingerprint sensors. To the best of this is the first such systematic study a statistically significant results due to a s number of participants and a variety of finge The rest of the paper is organized as follo we summarize the related work in int fingerprint devices; Section 3 describes t methodology; Section 4 contains an analys Section 5 contains a discussion of the res and provisions for further work.
II. RELATED WORK Recent works have pointed out the investigating the impact on the error rates fingerprints with a new device [7].
Poh et al. proposed methods to mitigate device acquisition mismatch scenario [10]. T the problem of comparing a biometric tem that is generated from a different or unk device. The problem was modeled in term Network used to estimate the posterior p device d given quality measures q, referred device is represented by a discrete variab depend upon how many devices are avail and it is observed during the training. The t network is estimated using the Gaussian mi based on training data. During testing, the de and it can be inferred based on the q extracted from the images. They demons approach improves the performance of a un system by estimating a more accurate decisio
[image:3.612.64.559.553.713.2]Jain and Ross analyzed the pr interoperability of a biometric system in variability introduced in the feature set by technologies (e.g. optical vs. capacitive) [6 an Equal Error Rate (EER) of 23.13% images acquired with Digital B
Figure 1: Age a
in general much print image when hen images come
have not been a ws us to precisely ) interoperability
f our knowledge, able to arrive at sufficiently large erprint scanners.
ows: in Section 2 teroperability of the experimental sis of the results; sults, conclusions
e importance of s when capturing
e effects due to a They investigated mplate to a query known biometric ms of a Bayesian
robability of the to as p(d|q). The ble whose values
lable for training term p(d|q) of the ix model (GMM) evice is unknown quality measures strated that their nimodal biometric
on threshold. roblem of the
n terms of the y different sensor 6]. They reported when matching Biometrics and
Veridicom sensors, and EER of 6 when using only Digital Biom respectively. It is important to not study are significantly higher in qua Ross and Nadgir highlighte comparing feature sets obtained fro Features extracted from fingerprin points) are impacted by resolution technology, etc.; subsequently, the database is affected too. They approaches for addressing the probl the context of fingerprints: i) distort based on the sensing technology device; ii) inter-sensor compensatio the relative distortion between different devices. In their appr distortion is modeled by a thin parameters rely on control points m to cover representative areas where the fingerprint image.
Campbell and Madden conduct the causes of the lack of interopera to determine both native (enrollme the same device) and non-native or and verification using different de False Non-Match rates. 60,902 fin products were used for the evaluatio test which products could interoper Accept Rate (FAR) and 1% False R demonstrated that only 2 products interoperate at the specified levels[1
III. EXPERIMENT
A. Dataset
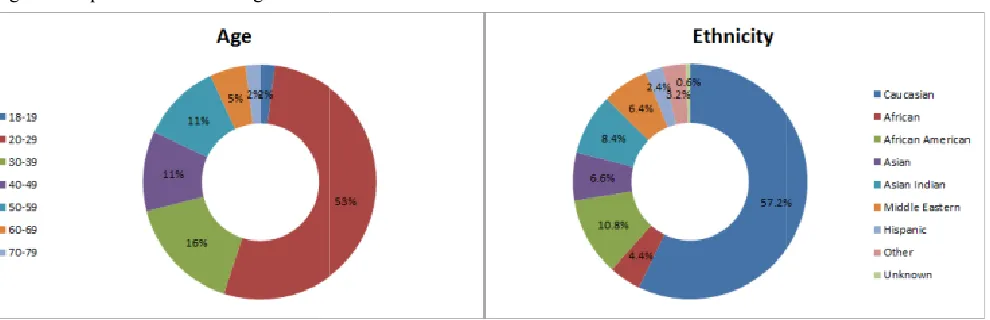
The dataset we use was coll Virginia University. Data were participant using multiple device sensors. The order of use of finge same for all participants. 494 par selected. They provided informatio between 20 and 29 years old) and population is Caucasian). This is sum
and ethnicity groups of the participants to the data collection.
6.14% and EER 10.39% metrics and Veridicom,
te that the sensors in our lity than those in [6]. ed the importance of om different sensors [2]. nt images (e.g., minutiae n, scanning area, sensing e template stored in the identified two possible lem of interoperability in tion compensation model of a specific biometric n model which computes
images acquired using roach, the inter-sensor n-plate spline in which manually selected in order
e distortions can occur in
ed a study to understand ability. The objective was nt and verification using interoperable (enrollment evices) False Match and ngerprint images over 10 on. The main goal was to rate at levels of 1% False eject Rate (FRR). Results out of 10 were able to 12].
TAL SETUP
ected in 2012 in West collected from each s, all based on optical erprint scanners was the rticipants were randomly on on age (53% varying d ethnicity (57.2% of the
Fingerprints were acquired using four L (D0 – D3, see Table 1) and ink-based ten-Ten-print cards were scanned at resolutions a flat-bed scanner. Ink-based fingerprints w the end, to not affect the quality of Live-s For each Live-scan device users provid fingerprints subsequently, each consist individual fingers on both hands, left slap four (non-thumb) fingers on the device), thumbs slap. The optical technique utilizes laser light-source and a Charge-Coupled De Complementary Metal–Oxide–Semicondu camera for constructing fingerprint image placed on the glass plate, a laser light is refle prism and facilitates the imaging. Fingerprin without controlling the quality and the c finger.
Device Model Resolution (dpi) Ima(p
D0 Cross Match Guardian R2 500 800
D1 i3 digID Mini 500 752
D2 L1 Identity Solutions TouchPrint 5300 500 800
[image:4.612.50.302.269.384.2]D3 Cross Match Seek II 500 800 Table 1: Characteristics of the Live-scan devices use acquisition carried out in this study.
Image quality was assessed using the Institute for Standard Technology) Fin Quality (NFIQ) algorithm [4]. NFIQ is an developed by NIST, and has become the i for fingerprint image quality assessment. Fi is classified into five levels, 1 (highest) to 5
Match scores were generated using the Id Software Development Kit [9] matchin matching algorithm compares two fingerp returns a score based on how similar it templates are. The higher the score the mor the two images / templates come from the main aim of our study is then to compare th matching scenarios: i) comparing two fing with the same device, and ii) comparing captured with two different devices. The n the types of similarity match scores is giv Since the total number of impostor score large, we limited it to a random subse sufficient for statistical confidence. For the only consider the four Live-scan devices be of fingerprints was collected from each sub cards, making the matching between i impossible. Table 3 reveals the number o category.
Live-scan devices -print cards (D4). of 500 dpi using were acquired at scan fingerprints. ded two sets of
ting of: rolled (i.e. slapping the , right slap, and a glass platen, a evice (CCD) or a
uctor (CMOS) es. The finger is
ected through the nts were collected centering of the
age size
pixels) area (mm)Capture
0 x 750 81 x 76
2 x 750 81 x 76
0 x 750 81 x 76
0 x 750 40.6 x 38.1 ed for the fingerprint
NIST (National ngerprint Image
open source tool industry standard ingerprint quality
(lowest).
dentix BioEngine ng algorithm. A
print images and t thinks the two re likely it is that
same finger. The hese scores in two gerprints captured two fingerprints notation reflecting ven in Figure 2. es could be very et which is still e DMG case, we ecause only 1 set
bject on ten-print ink-based prints of scores in each
Device Match Genuine (DMG): G generated when we match the same use image captured in the first user’s interac in the gallery (the database of finger search). The image acquired using the s is called the probe (the set of images we verification). Since we have 494 particip based ten print cards we only have one DMG scores is 1,976.
Device Match Impostor (DMI): Im generated by matching the fingerprin participant against those of all the oth include only those in which both the ga acquired using the same device. The n potentially very large. We limit our an 120,855 DMI match scores.
Diverse Device Match Genuine (DDM generated when gallery and probe imag devices. For each subject, having 5 col possible combinations with two matc resulting in 9,880 match scores.
Diverse Device Match Impostor (DDM generated using images from different d
Table 2: Notation table for similarit
Matching Subjects Number of devices
DMG 494 4
DDMG 494 5
DMI 494 5
[image:4.612.318.559.332.400.2]DDMI 494 5
Table 3: Match score for differen
IV. ANALYSIS OF
A. Overview
[image:4.612.337.523.520.644.2]In this section we present pre interoperability analysis. Figure 2 s DMG scores (in blue) and DMI sco Match Guardian R2 device. As exp scores are high (appearing on the
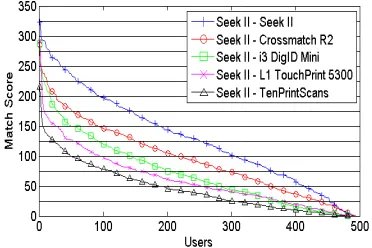
Figure 2: Genuine match scores (DD magnitude, for different sensor probe im fingerprints.
Genuine match scores are er’s right point fingers. The ction with a sensor is stored rprint images in which we same device the second time e submit for identification or pants and 4 devices (for ink-e imagink-e) think-e total numbink-er of
mpostor match scores are nt image / template of a er participants. DMI scores allery and probe images are number of imposter scores is nalysis to randomly obtained
MG): Genuine match scores ges acquired using different lection sensors, we have 10 ch scores for each probe,
MI): Impostor match scores evices.
ty score computations.
Samples Similarity scores
2 1,976
2 9,880
2 120,855 2 483,420 nt match scenarios.
F RESULTS
eliminary results of our shows the distribution of ores (in red) for the Cross pected, most of the DMG e right-hand side of the
distribution) and most of the DMI scores are low. No DMI scores are higher than 7, but there are some DMG scores below 7. Hence for a given system the decision on where to place the threshold between genuine and impostor scores will depend on the relative costs difference between false match and false non-match.
Figure 3 shows the distribution of DDMG scores (in blue) and DDMI scores (in red) when matching fingerprint images acquired with the Cross Match Guardian R2 for enrollment, and the i3 digID Mini for verification. The overlap of genuine and impostor score distributions is greater when they were acquired from diverse sensors. Reader may note that a substantially higher number of genuine scores is less than 7, though very few imposter scores are high too. This implies that the use of diverse devices may result in a higher number of false non-matches. This observation is quite consistent across all the diverse pairs we analyzed. The impostor scores never go higher than 7, but the number of genuine scores with values of less than 7 is higher in diverse vs. non-diverse sensor choices.
Figure 3 – Histogram of the DMG and DMI match scores for the Cross Match Guardian R2. The frequency of the DMI scores for the range 0-1 is
18,721, for 1-2 is 5,121 and for 2-3 is 296.
B. Impact of the sensor interoperability
Figure 4 shows the genuine match score distribution when matching probe fingerprints acquired using all devices against the gallery of fingerprints acquired using the Cross Match Seek II sensor (i.e. DDMG). The figure confirms that the match scores are the highest when measuring the similarity between images acquired by the same sensor. For all other sensor combinations the scores are lower, with the lowest match scores representing the similarity with the ink-based ten-print scans as probes. Matching scores of any Live-scan devices are higher than those obtained from ten-prints. We observed the same trends when using other fingerprint sensors for gallery images.
C. Statistical Analysis of Sensor Interoperability
[image:5.612.323.559.59.198.2]In order to estimate the degree of change in genuine match scores across different sensors, we carried out the Kendall’s rank correlation statistical test. We compare the
Figure 4: The histogram of the DDMG and DDMI scores for the Cross Match Guardian R2 vs. i3digID Mini. The frequency of the DDMI scores in the 0-1 range is 19,889, for 1-2 is 4,024 and for 2-3 is 229.
scenario in which the gallery and probe are acquired using the same device (DX vs. DX) to the scenario where gallery and probe images are acquired using different devices (DX vs. DY). Table 4 shows the p-values under the null hypothesis of interoperability scenarios. If the p-value is further from zero, the DDMG genuine scores are significantly different. If the p-value is close to zero, the DMG and DDMG scores do not differ significantly.
DX-D0 DX-D1 DX-D2 DX-D3 DX-D4
D0 5.42 e-242 5.32 e-93 1.24 e-84 1.29 e-66 1.04 e-07
D1 2.72 e-68 6.19 e-242 2.99 e-65 2.35 e-59 2.59 e-06
D2 7.11 e-69 6.02 e-01 5.47 e-242 7.79 e-55 2.41 e-08
[image:5.612.63.290.292.427.2]D3 2.14 e-76 6.28 e-01 5.62 e-01 5.47 e-242 3.03 e-08
Table 4: p-values from Kendall’s rank correlation statistical test.
Results shown in Table 4 indicate a statistically significant difference for sensor pairs {D2,D1}, {D3,D1}, {D3D2}. Further, genuine match scores generated from the matching of a ten-print probe against a gallery acquired by any of the four Live-scan devices are very distant from those generated in any of the scenarios where the optical devices are used for fingerprint acquisition. It is interesting and surprising, however, that the results of Kendall’s rank test are not symmetric.
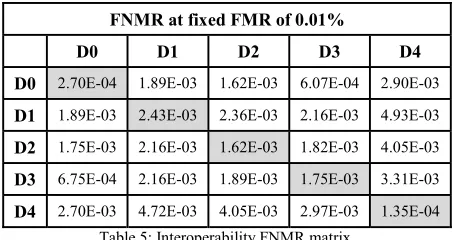
[image:5.612.319.570.336.408.2]FNMR at fixed FMR of 0.01%
D0 D1 D2 D3 D4 D0 2.70E-04 1.89E-03 1.62E-03 6.07E-04 2.90E-03
D1 1.89E-03 2.43E-03 2.36E-03 2.16E-03 4.93E-03 D2 1.75E-03 2.16E-03 1.62E-03 1.82E-03 4.05E-03 D3 6.75E-04 2.16E-03 1.89E-03 1.75E-03 3.31E-03
[image:6.612.62.290.71.191.2]D4 2.70E-03 4.72E-03 4.05E-03 2.97E-03 1.35E-04 Table 5: Interoperability FNMR matrix.
D. Effect of Image Quality on the Scores
US National Institute for Standards and Technology (NIST) provides recommendations regarding quality control for fingerprint image acquisition [4]. The agency developed NIST Fingerprint Image Quality (NFIQ) software. It generates a number, in a range between 1 and 5, which predicts fingerprint matcher’s performance as a function of image quality. The quality number reflects the predictive positive or negative contribution of an individual sample to the overall performance of a fingerprint matching system. NFIQ level 1 indicates a high quality fingerprint image, while level 5 indicates the poorest quality. The agency recommends that fingerprints be reacquired from the user up to three times, if the NFIQ quality of thumbs and index fingers is greater than three. Table 6 indicates the FNMR rates when the image quality is four or less. These FNMR rates are much worse than those reported for the entire experiment in Table 5. With respect to the differences in FNMR for intra and inter sensor scenarios, they simply appear unpredictable.
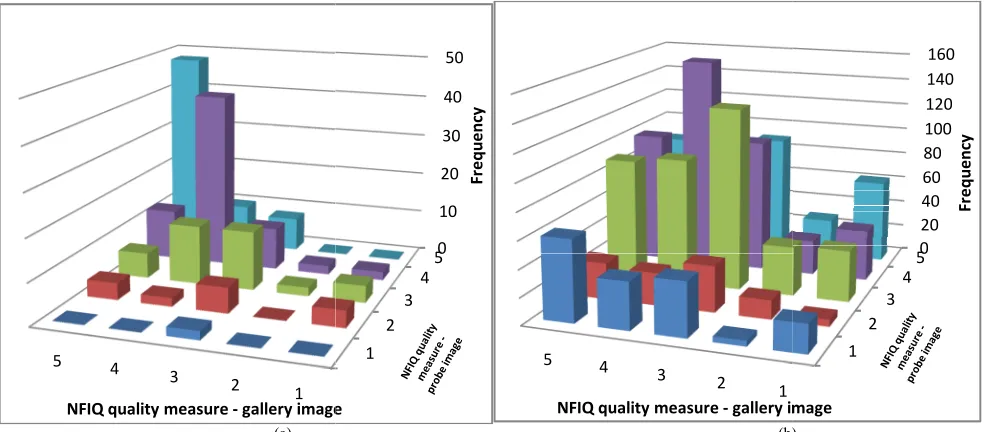
Figure 5 shows the frequency of matching scores lower than 10 for a given pair of image quality scores. Figure 5 (a) depicts DMG scores, while 5 (b) shows DDMG scores. When comparing probe and gallery images acquired by the same device, it seems that as long as one of the images has a quality score between 1 and 3, the frequencies of low matching scores are negligible. When acquisition reflects the use of diverse devices, to reduce the chance of getting a low genuine match score, there needs to be a more stringent control on image quality. Both the gallery and probe images need to be in the range 1-2 to reduce the incidence of genuine low match scores.
FNMR at fixed FMR of 0.1% for images with NFIQ quality < 3
D0 D1 D2 D3 D4 D0 0.000135 0.00027 6.75E-05 0 0.00054 D1 0.000202 0.000405 0.000135 0.00027 0.00027 D2 6.75E-05 0.000135 0.00027 0.000135 0.000472 D3 6.75E-05 0.000202 0.000135 0.000405 0.000405 D4 0.000405 0.000337 0.000472 0.000337 0.000135 Table 6: Interoperability FNMR matrix for fingerprint images with NFIQ quality below 3.
V. DISCUSSION, CONCLUSIONS AND FURTHER WORK In this paper we presented initial results from a large scale study of interoperability between optical fingerprint acquisition sensors. Using fingerprint images collected from 494 participants with 4 different devices, plus the scanned versions of ink-based fingerprint imprints on ten-print cards, were able to study the match score distributions, false-match and false-non-match-rates in various scenarios.
Our preliminary findings show that the genuine match rates are always higher if the gallery and the probe image are acquired by the same sensor. The false-non-match-rates are affected by the use of different devices, indicating the impact of limited interoperability between biometric sensors. The false-match-rates do not seem to be affected by interoperability.
We also studied the effect of image quality on the FMR and FNMR. We observed that a significant number of low match scores appear when the system attempts to match the genuine fingerprint pairs, acquired either by the same device or different devices, in which at least one of them or both have a low NFIQ quality score. Nevertheless, when images are acquired by different devices, their quality scores become more important if we are to reduce the instances of low genuine match scores.
Most of the findings presented in this study are not surprising. The exception is the lack of similarity in the match scores and error rates when the sensor sources of gallery and probe images are swapped. Nevertheless, to the best of our knowledge, this is the first study that has systematically gathered fingerprint data from multiple top-of-the-line commercial sensors. Such data collection allowed us to obtain detailed measurements on the effects of the lack of interoperability.
The research is on-going and current and future plans for further work include:
• More detailed analysis on the effects of diverse matchers on interoperability. We especially want to explore examples where diverse matchers improve the detection rates even if the average FNMR and FMR rates may deteriorate when using different sensors.
• What advice can we prescribe for an overall architecture of fingerprint recognition that:
o Employs diverse sensors, and/or o Improves interoperability.
• The effect of user habituation on the quality of the fingerprint samples obtained, and the effect they have on FMR and FNMR. In other words, do the quality of the images obtained improve when we compare, say, the first sample obtained from a participant with the last one.
• Using more than one fingerprint imag participant to improve the FMR and F overall Decision Making
ACKNOWLEDGMENT This material is based upon work a University partially supported by the N Foundation award number 1066197, an Institute of Justice award number 2010-D Gashi is partially supported by a Pump Prim City University London, and an EU Artemi TSB funded project SESAMO. Any opinio conclusions or recommendations expressed are those of the authors(s) and do not neces views of the sponsoring organizations.
REFERENCES
[1] A. Jain, D. Maltoni, D. Maio and S. Prabh Fingerprint Recognition. Springer, 2003. [2] R. Nadgir, “Facilitating sensor interoperabilit
quality in fingerprint matching systems”. Dissert University, 2006.
[3] A. Ross, and R. Nadgir. "A calibration model f interoperability." Proceedings of SPIE. Vol. 6202
[image:7.612.61.553.399.615.2](a) Figure 5: Histograms of genuine match scores below using gallery images and probe images acquired usin acquired using two different devices. When the devic score <10 significantly increases. This lack of interope gallery (quality value ranging from 3 to 5).
1 2 3 4 5
NFIQ quality measure - gallery image
ge from a given FNMR rates and
at West Virginia National Science nd the National
D-BX-K037. Ilir ming Grant from is initiative / UK on, findings, and d in this material ssarily reflect the
hakar. Handbook of
ty and incorporating rtation, West Virginia
for fingerprint sensor 2. 2006.
[4] SP800-76, NIST Special Publicati Specification for Personal Identity Veri [5] S. Modi., S. Elliott, and K. Hale, "St
sensor interoperability performanc Conference on Biometrics: Theory, (BTAS), 2009.
[6] A. Ross and A. Jain. "Biometric senso in fingerprints." Biometric Authenticat [7] Vielhauer, C., Yanikoğlu, B.,
Garcia-Elliott, S. J. (2008). Special section security, usability, and interoperab Imaging, 17(1).
[8] S. Modi, “Analysis of fingerprint sen performance”, Diss. Purdue University [9] http://www.l1id.com/pages/100-bioeng
[10] P. Grother, et al; MINEX – Performa INCITS 378 Fingerprint Template; NI of Standards and Technology; March 2 [11] N. Poh, J. Kittler, and T. Bourlai,
interoperability by likelihood ratio-b normalization." First IEEE Internation Theory, Applications, and Systems (BT [12] J. Campbell and M. Madden, “Internati Seafarers’ Identity Documents Biom Report Number 3”, 2009.
[13] B. Carterette. “On rank correlation rankings”. In Proc. 32nd SIGIR, pages
(b)
10, grouped by the qualities of gallery and probe images. (a) indicate ng the same device; (b) indicates match scores obtained when using ga ce used for verification is different than that one used for ennrollment
erability leads to an increase of the FNMR. This impact is higher when 1
2 3
4 50
10 20 30 40 50
Fr
e
que
ncy
e 1
2 3 4 5
NFIQ quality measure - gallery im
on 800-76, Biometric Data ification, February 2005. atistical analysis of fingerprint ce." IEEE 3rd International
, Applications, and Systems
r interoperability: A case study ion (2004): 134-145.
-Salicetti, S., Guest, R. M., & n on biometrics: Advances in bility. Journal of Electronic
nsor interoperability on system y, 2008.
gine-sdk.
ance and Interoperability of the ISTIR 7296; National Institute 21, 2006.
"Improving biometric device based quality dependent score nal Conference on Biometrics: TAS), 2007.
ional Labor Organization (ILO) metric Interoperability Testing
n and the distance between 436-443, 2009.
)
es match scores obtained when allery image and probe images , the number of genuine match in the presence of a low quality
1 2
3 45
0 20 40 60 80 100 120 140 160
Fr
e
que
ncy