City, University of London Institutional Repository
Citation:
Exarchos, T. P., Rigas, G., Bibas, A., Kikidis, D., Nikitas, C., Wuyts, F. L.,Ihtijarevic, B., Maes, L., Cenciarini, M., Maurer, C., Macdonald, N., Bamiou, D. E., Luxon, L., Prasinos, M., Spanoudakis, G., Koutsouris, D. and Fotiadis, D. I. (2016). Mining balance disorders' data for the development of diagnostic decision support systems. Computers in Biology and Medicine, 77, pp. 240-248. doi: 10.1016/j.compbiomed.2016.08.016
This is the accepted version of the paper.
This version of the publication may differ from the final published
version.
Permanent repository link:
http://openaccess.city.ac.uk/15490/Link to published version:
http://dx.doi.org/10.1016/j.compbiomed.2016.08.016Copyright and reuse: City Research Online aims to make research
outputs of City, University of London available to a wider audience.
Copyright and Moral Rights remain with the author(s) and/or copyright
holders. URLs from City Research Online may be freely distributed and
linked to.
City Research Online: http://openaccess.city.ac.uk/ [email protected]
Mining Balance Disorders’ data for the development of
Diagnostic Decision Support Systems
T.P. Exarchos1, G. Rigas2, A. Bibas3, D. Kikidis3, C. Nikitas3, F.L. Wuyts4, B. Ihtijarevic4, L. Maes5, M.
Cenciarini6, C. Maurer6, N. Macdonald7, D.-E. Bamiou8, L. Luxon8, M. Prasinos9, G. Spanoudakis8, D. D.
Koutsouris1, D.I. Fotiadis2*
1
Institute of Communication and Computer Systems, National Technical University of Athens, Athens, Greece.
2
Unit of Medical Technology and Intelligent Information Systems, Dept. of Materials Science and Engineering,
University of Ioannina, Ioannina, Greece.
3
1st Otolaryngology Department, National and Kapodistrian University of Athens, Athens, Greece
4
Antwerp University Research centre for Equilibrium and Aerospace, Antwerp, Belgium.
5
Ghent University, Ghent, Belgium.
6
University Medical Center Freiburg, Freiburg, Germany
7
University College London Ear Institute, London, UK.
8
City University, London, UK.
*
Corresponding author. Prof. Dimitrios I. Fotiadis. Unit of Medical Technology and Intelligent Information
Systems, University of Ioannina, GR45110, Ioannina, Greece.. FORTH, Institute of Molecular Biology and
Biotechnology, Dept. of Biomedical Research, University of Ioannina, GR45110, Ioannina, Greece.. Tel:
+302651009006; fax: +302651008889. [email protected]
Abstract
In this work we present the methodology for the development of the EMBalance diagnostic Decision Support
System (DSS) for balance disorders. Medical data from patients with balance disorders have been analysed
using data mining techniques for the development of the diagnostic DSS. The proposed methodology uses
tests, in order to provide an accurate diagnosis. The system aims to provide decision support for general
practitioners (GPs) and experts in the diagnosis of balance disorders as well as to provide recommendations
for the appropriate information and data to be requested at each step of the diagnostic process. Detailed
results are provided for the diagnosis of 12 balance disorders, both for GPs and experts. Overall, the
reported accuracy ranges from 59.3 to 89.8% for GPs and from 74.3 to 92.1% for experts.
Index Terms. Balance disorders, data mining, decision support systems, vestibular system
I. INTRODUCTION
Human balance requires vision, joint and muscle proprioception and the vestibular system. The integration of the
above input and motor output to the visionary and muscle systems are required in order to achieve balance. If one
of the three above mentioned systems or their integration fails, this could lead to several different pathologies that
can cause balance disorders. The reasons that can cause balance disorders can be many and different [1]. In
approximately 5%, the causes are mainly neurological; in 5% are medical; in 15% are psychological; in more than
50% the causes are related to diseases of the inner ear while in the rest 25%, the causes are multiple. Balance
disorders can lead to falls [2], which can subsequently lead to other complications
The diagnosis of balance disorders is challenging, sometimes even for the expert otolaryngologists or expert
neurologists [3]. A systematic history taking, followed by appropriate clinical examinations chosen on a patient and
symptom specific basis are the cornerstones of diagnosis and are tasks where a Decision Support System (DSS)
could be of great help, facilitating the diagnostic process, especially for medical practitioners with less expertise in
balance disorders such as GPs. Only a few DSS have been developed in the past regarding the diagnosis of
vestibular disorders. Mira et. al. [4] proposed an automated diagnosis system, VERTIGO, which is based on rules.
CAMISEL is another DSS [5], which is based on a two-step approach for reaching a diagnosis. In the first step, the
system suggests a potential diagnosis based on initial evidence, while in the second step the system confirms or
rejects the diagnosis, taking into account information from the patient’s history and clinical examinations. Galactica
is a machine learning approach [6, 7] which learns and develops diagnostic decision rules using data from 564
sudden deafness, benign paroxysmal positional vertigo (BPPV) and vestibular neuritis. OtoNeurological Expert
(ONE) [8,9] developed diagnostic rules using 815 neuro-otology patients, which included the same diagnosis as
Galactica and subsequently tested for 1030 cases, including cases with benign recurrent vertigo, vestibulopathia and
central lesion. The best total classification accuracies using the combined knowledge bases with machine learning
knowledge and experts’ knowledge, classified 82.5–84.7% of cases correctly within the first and second diagnostic
suggestion. NetSet has been developed using 815 patient cases with the same primary diagnoses [10]. NetSet
showed a sensitivity, specificity, positive predictive value and total accuracy for all six diagnostic classes 85%, 83%,
96% and 95%, respectively.
Miettinen and Juhola [11], employed Bayesian probabilistic models for the diagnosis of six otoneurological
diseases. Additional experiments with the ONE diagnostic system were also presented in [12,13], using different
machine learning methods, such as the k-nearest neighbor method, the Naïve Bayes classifier and Support Vector
Machines. Finally, Dong et al. [14] developed a diagnostic system, through dynamic uncertain causality graphs. The
graphs were developed using medical knowledge and validated in 60 patient cases, resulting in an average accuracy
ranging from 81.7 to 88.3%.
A newly developed diagnostic DSS is part of an integrated system, EMBalance (http://www.embalance.eu/), which
is a system for the management of patients with balance disorders in terms of diagnosis, treatment and disease
evolution. The EMBalance diagnostic platform goes beyond current state of the art in several directions. All
previous works focus only on the development of data mining models for classifying patients in different
diagnostic categories. The proposed methodology aims to provide a recommendation tool which is able to guide the
GPs and experts in requesting the appropriate information for reaching the diagnosis. Another innovative feature of
the proposed DSS is that due to the several data mining models developed for each one of the diagnoses, it can
provide more than one diagnosis for each patient. An additional benefit of the EMBalance DSS is that while in
previous systems, the patients’ data used for training and testing the algorithms contained approximately 10-240
features, the EMBalance repository characterizes patients using approximately 350 features. This exhaustive
patient characterization coupled with extensive experiments with feature selection algorithms enables the
EMBalance DSS to identify the critical information needed for the diagnosis of the different pathologies. Finally,
features which are determined by the access that each of the two groups (GPs and experts) has to specialized
equipment and tests. Previous systems assumed only experts usage, judging on the features used by them for
diagnosis.
II. MATERIALSANDMETHODS
A. Dataset
Data from 985 patients were collected from the National Hospital of Neurology and Neurosurgery, Queen Square,
UK, the 1st Otolaryngology University Clinic of Athens, Greece, the University of Antwerp, Belgium and the
University Clinic of Freiburg, Germany. These data contained more than 350 features (variables), including
epidemiological information, detailed medical history, disease related history, clinical findings and laboratory
examination results (http://www.embalance.eu/). Furthermore, detailed information on different balance related
types of symptoms together with symptom duration, symptom free intervals, association between symptoms and
relevant triggers was collected, since these are important features for the diagnosis of vestibular disorders. It should
be noted that in the GP case, only features corresponding to personal disease history, symptoms and clinical
examinations were utilized, whereas in the expert case, all the above mentioned features were used. Diagnostic
outcomes were classified into more than 100 diagnoses, using the standard ICD10 code, as well as additional, not
as yet specified in the ICD code, diagnostic categories based on the Bárány Society proposed International
Classification of Vestibular Disorders (see http://www.jvr-web.org/Barany-feedback.html). The study has been
approved by the respective ethics committees of each Institute according to local/national regulations. Following
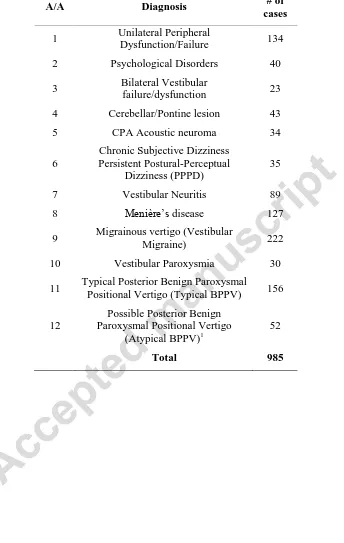
numerous experiments and detailed analysis and collaboration with medical experts, 12 diagnostic categories
shown in Table I, along with the corresponding recommendation for specific features are supported by the
proposed DSS. Diagnostic categories with a very small number of patients (i.e. less than 20) were excluded
because it was not feasible to be analysed. The proposed DSS is based on the above described dataset and provides
B. Methods
B1. Training
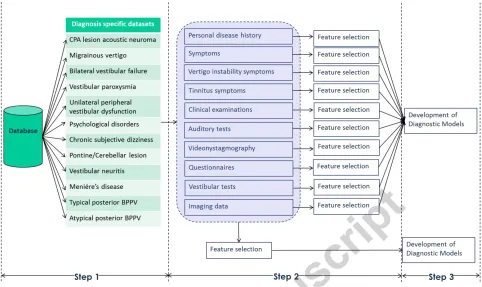
To develop the DSS for the diagnosis of 12 balance disorders, a three stage methodology was implemented which
is shown in Fig. 1. In the first step, preprocessing of the dataset was performed; this included the removal of
features with more than 50% missing values and the development of the datasets per class. Due to the large number
of target classes (12), 12 different binary classification models have been developed instead of a 12-class
classification model. A different dataset was thus prepared per diagnostic category; each dataset per class contained
all records from the target class and randomly the same number of records from the rest of the database.
In the second step, feature selection was performed. Two different data mining frameworks have been tested for
each diagnostic category (Fig. 1). In the first (upper part of Fig. 1), feature selection was applied separately in each
category of features (Personal disease history, symptoms, vertigo-instability symptoms, tinnitus symptoms, clinical
examinations, auditory tests, video-nystagmography, questionnaires, vestibular tests, imaging data) and selected
features were collected at the end for the diagnostic process. In the second category (lower part of Fig. 1), feature
selection was applied in all features from all categories and the optimal subset was used for the diagnostic process.
Feature selection was applied on the training set of each diagnostic category (10 times since 10-fold cross
validation was used). In our case, we employed feature subset selection methods, that consider the overall set of
features collectively, compared to feature ranking methods that assess each feature independently. Further to that,
feature subset selection methods can be classified into two categories: the filter [15], where the feature subset
selection is independent of the training algorithm and removes irrelevant and high correlated features and the
wrapper [16], where the feature subset selection is applied as a wrapper with the training algorithm and the optimal
feature subset is identified based on its accuracy with the specific training algorithms.
Finally, in the third step, classification algorithms were applied. The reduced subset of features from the second
step is used as input to predict the target class. The best results were obtained using the second data mining
framework (overall feature subset selection in all available features) with the combination of wrapper feature
selection (second step) and decision trees enhanced with a boosting algorithm, Adaboost (third step). Wrapper
feature selection performs an exhaustive search within the space of available features, targeting the optimization of
techniques, employed in several different domains, including clinical applications [9]. A key element of the
decision trees that makes their usage appealing in the medical domain is that they can be transformed to rules and
provide transparency and interpretation in the decisions made (in contrast for example to neural networks or
support vector machines). Given an initial dataset, with instances characterized by features, there are exponentially
different decision trees that can be induced. For the development of diagnostic models for each of the diagnoses,
decision trees were used as basic models, induced using the C4.5 algorithm. The C4.5 algorithm for decision tree
induction creates a tree structure form with nodes, edges and leaves. The nodes correspond to features, the edges to
different values or ranges of values of the features of the nodes and the leaves are the decisions of the tree.
In order to identify which feature to have in which node and in which values to divide this feature, the notion of
information gain was considered. Details can be found in [17,18]. After the induction of the decision tree, the tree
is pruned in order to avoid overfitting in leaves where only a small number of instances applies. Boosting is a
procedure performed in an iterative manner and is used to change the distribution of the training instances so that
the base classifier, in our case the decision tree induced using the C4.5 algorithm, focuses more on examples that
are difficult to classify correctly. Boosting assigns weight to each training instance and then tunes the weight of all
instances; instances easily classified receive a reduced weight, while instances not classified correctly receive an
increased weight.
The assigned instance weights are then used in the sampling distribution in order to draw a set of bootstrap sample
from the original dataset. A specific type of boosting is the algorithm Adaboost, which works as follows: Let
denote the set of N training instances, where are the features characterizing record j and
is the class. Adaboost assigns different weights in the base classifiers , depending on the error rate of each
classifier, given as:
[∑ ( ( ) )] (1)
where if part p is true and 0 otherwise. i isthe number of base of classifier. The weight of the is given
by:
( ), (2)
{
}, (3)
where is the normalization factor that ensures that ∑ . The weight equation (Eq. 3) increases the
weight of the instances classified incorrectly and decreases the weight of those instances that are classified
correctly. After the definition of the weights of the instances and of the base classifiers, the classification is
performed according to the weight of each base classifier. In this way, base classifiers with low accuracy rate
receive less weight and are used less in the classification.
It should be noted that several different combinations of classification schemes were tested prior to the resulting
wrapper-decision trees and Adaboost approach. Besides wrapper, also filter based approaches were tested for
feature selection. Due to the requirement of the collaborating clinicians and vestibular experts to provide the ability
for interpretation for the decisions made, several classification methodologies were not selected (artificial neural
networks, support vector machines, k-nearest neighbors) or due to their reduced reported results compared to
decision trees and Adaboost (ripper algorithm [19], ridor algorithm [20], naïve Bayes algorithm). Moreover,
instead of Adaboost, bagging and random forests were also tested. Additionally, due to the large number of classes,
the 12 binary classification models approach was selected compared to the multiclass classification problem. An
additional advantage to select binary diagnostic models was the nature of the vestibular diagnosis problem; several
subjects present with more than one pathology at the same time. A multiclass classification setting would not be
able to address this requirement and assign two or more classes at the same time for a subject. The utilization of
binary diagnostic models allows addressing this, by providing more than one diagnosis at the same time. For the
C4.5 algorithm, the initial settings for pruning were set to 0.25 pruning factor and minimum instances per leaf to 5.
The second value was tuned in each of the diagnostic categories. Adaboost was set to 10 different iterations and
thus resulted in the generation of 10 decision trees per category.
B2. Testing
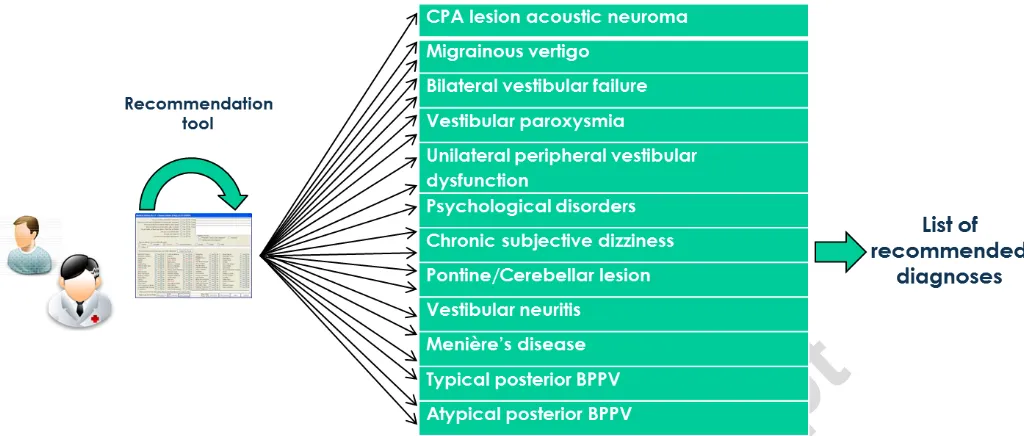
Fig. 2 shows the diagnostic (test) process which involves: (a) a recommendation tool that guides the GPs and
model/tree for each one of the 12 diagnoses. The recommendation system, based on the identified informative
features for each diagnosis, recommends to the GP/Expert which parameter, clinical examination, and/or test to
request in order to continue the diagnostic process. Specifically, the recommendation system proposes to the
GP/Expert the feature identified in the respective path of the decision tree that is needed each time for the
continuation of the tree parsing until the diagnosis is reached (Table I).
III. RESULTS
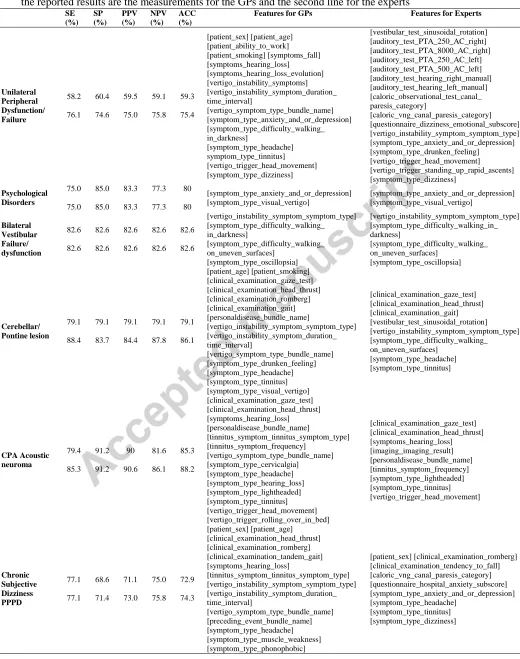
The 10-fold cross validation was used to evaluate the DSS. Sensitivity, specificity, positive predictive value,
negative predictive value and accuracy were estimated for each diagnosis. Table II presents the results obtained for
each different diagnosis considered, for both GPs and experts (since experts have access to specialized equipment
and thus additional information compared to GPs). The first line of the results corresponds to the results obtained
for the GPs, while the second line corresponds to the results for the experts. Also, the two columns, Features for
GPs, Features for Experts, correspond to the resulting reduced subset of features identified for each diagnosis, for
GPs and experts, respectively. This is due to the fact that GPs usually do not have access to the necessary
equipment to perform specific tests (e.g. videonystagmography, auditory tests and vestibular tests). For this reason,
the first column (Features for GPs) contains only features made available to the GPs during the diagnostic process.
The second column (Features for experts), contains additional features that can be acquired using sophisticated
equipment, available only to expert settings. It should be noted that these two DSS modes were obtained and
finalized after a series of experiments with different algorithms and different parameters. The reported results range
in terms of all metrics in the different diagnoses taken into consideration, as well as, in terms of the features used.
Overall, the metrics used for GPs are quite lower from the corresponding results of the experts. This is an expected
finding, since the DSS developed for the experts, contains more sophisticated features (audiological and vestibular
tests, imaging). When these test features are added, the corresponding metrics, as well as the diagnostic abilities,
are improved in almost all cases.
The developed EMBalance DSS addresses the 4 most prevalent balance disorders (Migrainous vertigo, Typical
Benign paroxysmal positional vertigo, Vestibular Neuritis and Menière’s disease), as well as another 8 less
Disorders, Bilateral Vestibular failure/dysfunction, Cerebellar/Pontine lesion, CPA Acoustic neuroma, Chronic
Subjective Dizziness Persistent Postural-Perceptual Dizziness, Vestibular Paroxysmia). For the 4 most prevalent
diseases except Vestibular neuritis, quite high results have been reported, both for the GP and expert DSS modules.
The best results were reported for Menière’s disease, reaching an accuracy of 92.1% for the experts, while the
lowest ones were reported for Unilateral Peripheral Dysfunction/Failure, with an accuracy of 59.3% for the GPs.
Based on the different number of records for each of the 12 classes, the classification framework used (feature
subset selection, boosting, training of decision trees), required maximum 1 minute (in the case of Migrainous
Vertigo, expert model). Regarding the testing time, decision trees are efficient classification structures and the
testing time for a new record is negligible.
IV. DISCUSSION
The diagnosis of balance disorders is a difficult task, not only for the GPs but also for the experienced medical
professionals which include otolaryngologists, audiovestibular physicians, neurologists, and audiologists. For those
lacking the specialised medical training and the long clinical experience, the diagnostic process of vestibular
disorders can be fraught with difficulties, and it may not be possible to gather all necessary information or to
interpret such information meaningfully in order to conclude in the correct diagnosis. A DSS that would
successfully address diagnosis of such disorders would address a significant public health need. The impact of this
achievement includes better diagnostic outcomes and consequently improved quality of life for a large patient
group, reduction of falls and fall related injuries, equity in health services access and cost reduction via referrals
and follow up assessment decrease.
In this work we have presented the EMBalance diagnostic DSS for balance disorders, which includes one GP and
one expert module, which reflect the availability of sophisticated tests and equipment in primary vs.
secondary/tertiary clinical setups. According to Table II, for the unilateral peripheral dysfunction/failure, the
diagnostic accuracy results for the GP mode are quite low. However, the diagnostic accuracy results are increased
substantially in the expert module when the audiological test characteristics, which are very informative for
unilateral diseases are added to the diagnostic process. Since audiological equipment is usually not available for the
case of psychological disorders, the same simple models have been developed both for the GP and for the expert
module, taking into consideration anxiety and/or depression validated questionnaire score levels and the existence
or not of visual vertigo symptoms. For the Bilateral Vestibular failure/dysfunction case, the same models with quite
accurate results have been developed for both GPs and experts, taking into consideration the same simple clinical
history and examination features. In the Cerebellar/Pontine lesion case, the addition of vestibular tests improves the
results from the GP to expert case, proving that vestibular tests are quite essential for this diagnosis. When
considering the cerebellopontine angle (CPA) acoustic neuroma case, in the GP module, the sensitivity obtained
was quite low, which was increased substantially in the expert module, when the results of imaging tests are added.
According to the medical expert module results, imaging and especially magnetic resonance imaging (MRI) is
required to clearly identify a CPA acoustic neuroma. Nevertheless, in the GP module, results show that even with
more easily acquired features, CPA lesions can be identified with satisfactory sensitivity. For Chronic Subjective
Dizziness Persistent Postural-Perceptual Dizziness (PPPD), the results for GPs and experts are quite similar.
Furthermore, the addition of the Videonystagmography (VNG) caloric test (canal paresis) category (a laboratory
examination which is not available to the GPs) increases the accuracy for the identification of this diagnosis. In the
vestibular neuritis case, the results are quite low in both modules. Still it can be seen that the addition of the VNG
caloric test canal paresis category, improves the results for this diagnosis. In Menière’s disease, quite high results
are reported both for GPs and experts. Still, the addition of some auditory test results (low frequency 250-500 Hz
hearing loss) increases the accuracy of the DSS for Menière’s disease. Migrainous vertigo (vestibular migraine) is
an important balance disorder, not addressed by most of the previous DSS in the literature [9-13]. For this
diagnosis, the same model was developed and used for GP and expert DSS modules.
The diagnostic accuracy results for Vestibular paroxysmia are quite low in the case of the GPs, however those are
substantially increased in the expert module, especially with the addition of the imaging results which are a key
diagnostic feature for this disorder. Finally, the results for the posterior canal BPPV, both typical and atypical have
been presented. The differentiation between typical and atypical BPPV depends on the existence or not of
nystagmus in the Dix Hallpike examination. With a positive Dix Hallpike, i.e. typical posterior BPPV, the obtained
results are quite satisfactory both for GPs and experts. In the case of the negative Dix Hallpike and the atypical
Our work goes beyond the state of the art in many ways: A much more detailed feature vector has been formulated,
accounting for more than 350 features including parameters regarding the medical history, symptoms, clinical
examinations, audiological and imaging findings, questionnaire and, posturography results. In addition, an
advantage compared to the previously developed DSSs is that the EMBalance diagnostic DSS harnessed several
different data mining models with a different model developed for each disease, which allowed the extraction of
more than one diagnosis for each patient, since this is often required for patients with balance disorders. Through
the decision tree based diagnostic DSSs, the medical professionals are thus able to obtain decision support in two
tasks: (i) acquisition of patient’s data, through the recommendation tool that has been developed based on the
parsing of the decision trees, by requesting the specific features and in the correct order and, (ii) interpretations for
the decisions made due to the decision tree based nature. More specifically, for each diagnosis made through the
diagnostic decision support system, the corresponding rules that were applied for each patient case are presented to
the medical expert.
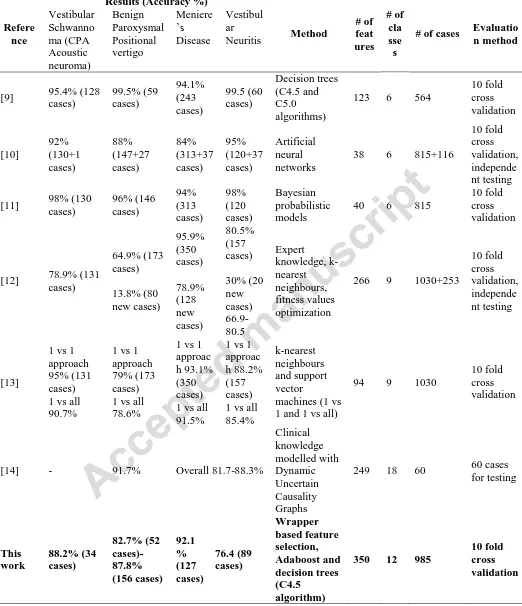
Table III presents a summary of the current and of previous related works reported in the literature for the diagnosis
of balance disorders including detailed accuracy for the common diagnosis (Benign Paroxysmal Positional Vertigo,
Vestibular Neuritis and Menière’s Disease) and high risk diagnosis (Vestibular Schwanoma-CPA acoustic
neuroma). A direct comparison cannot be performed due to the different datasets and different methodologies
(ranging from expert systems developed using expert knowledge [12] to more sophisticated modelling of
knowledge with dynamic uncertain causality graphs [14], Bayesian networks analysis [11], artificial neural
networks [10] etc.) that were employed by the different research groups. However, as it can be seen in Table III,
the strength of the EMBalance DSS compared to DSSs presented in the literature include: (i) the number of
different features used to inform the diagnostic process, allowing for a more detailed analysis of all available
features and identification of the most informative ones per pathology. All previous works started their analysis
from a smaller set, not taking into consideration several important features that the proposed DSS and analysis
does. (ii) The number of different diagnostic classes considered. The proposed DSS can provide diagnosis for 12
different pathologies. All previous works reach up to 9 pathologies, limiting the exploitation of the DSS by a
vestibular expert. An exception is the methodology presented in [14], which, however, was tested in a limited set of
the proposed DSS can provide simultaneously two or more diagnosis, which is typical for several patients suffering
from vestibular disorders. (iii) The comparable number of patient cases. As it is presented in Table III, the number
of patient cases range from 60 to 1283; the 985 cases, using 10-fold cross validation used in our approach allows to
consider the reported results credible and the DSS reliable. (iv) The availability of both GP and expert modules.
This is an innovative point of the proposed DSS, compared to previous works that consider only usage by experts.
In several healthcare systems, GPs are the first point of patient access for diagnosis; the GP mode of the proposed
DSS allows GPs to perform the diagnostic process, helping them also during data acquisition.
In the future, the EMBalance DSS will be clinically evaluated in a multi-centre proof of concept clinical trial that
will be conducted on a minimum of 200 prospective patients. Additionally, since in some of the diagnostic
categories (Bilateral Vestibular failure/dysfunction, CPA Acoustic neuroma, Chronic Subjective Dizziness
Persistent Postural-Perceptual Dizziness and Vestibular Paroxysmia), the number of available records was
relatively small and the data highly skewed, in the future, when the EMBalance DB increase in terms of samples in
these categories, retraining will be performed. Moreover, techniques for oversampling will be tested (e.g. Wilcoxon
signed-rank, Friedman’s, Iman-Davenport post hoc tests, Synthetic Minority Oversampling Technique) in order to
address the relatively small number of records in the specific cases.
V. CONCLUSIONS
A methodology based on data mining techniques (feature selection, boosting algorithms, decision trees) has been
employed for the development of a recommendation tool and a diagnostic DSS for 12 balance disorders, to assist
GPs and experts, firstly in requesting the necessary information from the patients to reach a potential diagnosis and
secondly to support the diagnosis of balance disorders. The reported results in most of the cases are satisfactory and
the features used for each diagnosis are in line with clinical knowledge and guidelines. An increase in overall
accuracy is presented, from the GP to the expert module, which is attributed to the additional and more
sophisticated features used by the experts. Further application of the diagnostic DSSs in real clinical settings could
reveal the potential of the proposed approach.
This work is part funded by the European Commission. Project EMBALANCE - A Decision Support System
incorporating a validated patient-specific, multi-scale Balance Hypermodel towards early diagnostic Evaluation
and efficient Management plan formulation of Balance Disorders (FP7-610454).
REFERENCES
[1] Balance Disorders, Specialists from the Stanford Balance Center, 2011.
[2] H. Koch, M.C. Smith: Office-based ambulatory care for patients 75 years old and over: National Ambulatory
Medical Care Survey, 1980 and 1981. NCHS Advance Data No 110, US Department of Health and Human
Services, Public Health Service, Washington, DC, 1985, p6.
[3] C.É.S. Gavilán, J.É. Gallego, J. Gavilán, Carnisel:an expert system for vestibular diagnosis, Acta Otolaryngol.
110 (1990), 161–167.
[4] Laurikkala JP, Kentala EL, Juhola M, Pyvkkö IV. A novel maschine learning program applied to discover
otoneurological diagnoses. Scand. Audiol. Suppl. 2001; (52):100–2.
[5] N. Chawla, and J. S. Olshaker, "Diagnosis and management of dizziness and vertigo." Medical Clinics of North
America vol. 90(2), pp. 291-304, 2006.
[6] E. Mira, A. Buizza, G. Magenes, M. Manfrin, R. Schmid, Expert systems as a diagnostic aid in otoneurology,
ORL 52 (1990) 96–103
[7] Laurikkala J, Juhola M. A genetics-based machine learning system to discover the diagnostic rules for female
urinary incontinence. Comput Methods Programs Biomed; 1998; 55(3): 217–28.
[8] E. Kentala, I. Pyykko, Y. Auramo, J. Laurikkala, M. Juhola, Otoneurological expert system for vertigo, Acta
Otolaryngol. 119 (1999) 517–521.
[9] E. Kentala, K. Viikki, I. Pyykko, M. Juhola, Production of diagnostic rules from a neurotologic database with
decision trees, Ann. Otol. Rhinol. Laryngol. 109 (2000) 170–176.
[10]Siermala M, Juhola M, Kentala E. Neural network classification of otoneurological data and its visualization.
Comput. Biol. Med. 2008; 38(8) 858–66.
[12]K. Varpa, K. Iltanen, M. Juhola, Machine learning method for knowledge discovery experimented with
otoneurological data, Comput. Methods Programs Biomed. 91 (2008) 154–164.
[13]K. Varpa, H. Joutsijoki, K. Iltanen, M. Juhola, Applying one-vs-one and one-vs-all classifiers in k-nearest
neighbor method and support vector machines to an otoneurological multi-class problem, Stud. Health
Technol. Inform. 169 (2011) 579–583.
[14]C. Dong, Y. Wang, Q. Zhang, N. Wang, The methodology of Dynamic Uncertain Causality Graph for
intelligent diagnosis of vertigo, Comp meth. Prog. in biomed. pp. 162-174, vol. 113, 2014.
[15]H. Liu and H. Motoda,Feature Extraction, Construction and Selection: A Data Mining Perspective. Boston,
MA: Kluwer, 1998.
[16]R. Kohavi and G. H. John, “Wrappers for feature subset selection,”Artif.Intell., vol. 97, pp. 273–324, 1997.
[17]P.N. Tan, M. Steinbach, V. Kumar, Introduction to data mining, 1st edition, Boston: Pearson Addison Wesley;
2006.
[18]M. Kantardzic, Data mining: Concepts, Models, Methods, Algorithms, 1st edition, Wiley-IEEE Press; 2002.
[19]W.W. Cohen, Fast Effective Rule Induction. In: Twelfth International Conference on Machine Learning, pp.
115-123, 1995.
B.R. Gaines, P. Compton, Induction of Ripple-Down Rules Applied to Modeling Large Databases. J. Intell. Inf.
Fig 1: The building blocks of the methodology for developing the diagnostic models. The two data mining
frameworks that were used are also shown. In the first, feature selection is applied to each different source of
Fig 2: The interaction between the recommendation tool, which utilizes the features encountered in the paths of the
decision trees, and the diagnostic decision support system, which is composed by the 12 different decision trees,
17
TABLE I: DIAGNOSES CONSIDERED IN THE EMBALANCE DSS AND THE CORRESPONDING NUMBER OF CASES
A/A Diagnosis # of
cases
1 Unilateral Peripheral
Dysfunction/Failure 134
2 Psychological Disorders 40
3 Bilateral Vestibular
failure/dysfunction 23
4 Cerebellar/Pontine lesion 43
5 CPA Acoustic neuroma 34
6
Chronic Subjective Dizziness Persistent Postural-Perceptual
Dizziness (PPPD)
35
7 Vestibular Neuritis 89
8 Menière’s disease 127
9 Migrainous vertigo (Vestibular
Migraine) 222
10 Vestibular Paroxysmia 30
11 Typical Posterior Benign Paroxysmal
Positional Vertigo (Typical BPPV) 156
12
Possible Posterior Benign Paroxysmal Positional Vertigo
(Atypical BPPV)1
52
18
Table II: Results for the 12 different diagnoses in terms of sensitivity, specificity, positive predictive value, negative predictive value accuracy and features used for the GPs and the experts are presented. The first line in the reported results are the measurements for the GPs and the second line for the experts
SE (%) SP (%) PPV (%) NPV (%) ACC (%)
Features for GPs Features for Experts
[image:19.612.48.568.81.740.2]20
Table III: Comparison of previous works for the diagnosis of balance disorders
Refere nce
Results (Accuracy %)
Method # of feat ures # of cla sse s
# of cases Evaluatio n method Vestibular Schwanno ma (CPA Acoustic neuroma) Benign Paroxysmal Positional vertigo Meniere ’s Disease Vestibul ar Neuritis
[9] 95.4% (128 cases) 99.5% (59 cases) 94.1% (243 cases) 99.5 (60 cases) Decision trees (C4.5 and C5.0 algorithms)
123 6 564
10 fold cross validation [10] 92% (130+1 cases) 88% (147+27 cases) 84% (313+37 cases) 95% (120+37 cases) Artificial neural networks
38 6 815+116
10 fold cross validation, independe nt testing
[11] 98% (130 cases) 96% (146 cases) 94% (313 cases) 98% (120 cases) Bayesian probabilistic models
40 6 815
10 fold cross validation
[12] 78.9% (131 cases) 64.9% (173 cases) 13.8% (80 new cases) 95.9% (350 cases) 78.9% (128 new cases) 80.5% (157 cases) 30% (20 new cases) 66.9-80.5 Expert knowledge, k-nearest neighbours, fitness values optimization
266 9 1030+253
10 fold cross validation, independe nt testing [13]
1 vs 1 approach 95% (131 cases) 1 vs all 90.7%
1 vs 1 approach 79% (173 cases) 1 vs all 78.6%
1 vs 1 approac h 93.1% (350 cases) 1 vs all 91.5%
1 vs 1 approac h 88.2% (157 cases) 1 vs all 85.4%
k-nearest neighbours and support vector
machines (1 vs 1 and 1 vs all)
94 9 1030
10 fold cross validation
[14] - 91.7% Overall 81.7-88.3%
Clinical knowledge modelled with Dynamic Uncertain Causality Graphs
249 18 60 60 cases for testing This work 88.2% (34 cases) 82.7% (52 cases)-87.8% (156 cases) 92.1 % (127 cases) 76.4 (89 cases) Wrapper based feature selection, Adaboost and decision trees (C4.5 algorithm)
350 12 985