City, University of London Institutional Repository
Citation
:
Kogan, P. (2014). Assessing the use and impact of technology in physical learning environments at City University London - Learning Development Associate project. Learning at City Journal, 4(1), pp. 53-68.This is the unspecified version of the paper.
This version of the publication may differ from the final published
version.
Permanent repository link: http://openaccess.city.ac.uk/3246/
Link to published version
:
Copyright and reuse:
City Research Online aims to make research
outputs of City, University of London available to a wider audience.
Copyright and Moral Rights remain with the author(s) and/or copyright
holders. URLs from City Research Online may be freely distributed and
linked to.
City Research Online: http://openaccess.city.ac.uk/ [email protected]
Assessing the use and impact of technology in physical learning environments at City University London - Learning Development Associate project
Peter Kogan,
Work-based Learning Advisor, School of Informatics
Abstract
Saying ‘technology is here to stay’ implies that it is unpacking its bags for the weekend. In reality, technology has already left, and is on its way to its next destination. There is more than a little truth in the notion that only yesterday’s gadgets are available in the shops; tomorrow’s are in the laboratories or on the (digital) drawing boards.
Technology plays an important role in learning at City University London in both physical and virtual learning environments. This project examines the technology that is used in physical learning environments, and investigates why it is used. Through a series of mini case studies involving observations, interviews and surveys with key stakeholders, this study attempts to gauge the impact technology has on teaching and learning.
In general the data indicates that technology is popular with both teachers and students at
the University. It can ‘add value’ by making learning more dynamic, varied and interactive.
But it is not perfect: sometimes it breaks and not everybody knows that it exists or how it works, while others do not want to use some of it.
Key words: teaching, learning, technology, physical learning environments
1. INTRODUCTION
1.1 LDA scheme and project
From October 2012 to July 2013 I did a part-time (0.2) secondment with the Leaning Development Centre (LDC) at City University London (City) as a Learning Development Associate (LDA). After discussions with Annemarie Cancienne and Pam Parker at LDC, it was agreed that my LDA project would focus on the use and impact of technology for teaching and learning in physical learning environments (PLEs) at City. This would sit within
the Learning Spaces Project that is currently taking place at the University1. This research
area shares space with the research I did for my MSc dissertation2 on the impact on learning
of virtual learning environments (VLEs) at City, and was therefore of particular interest to me. PLEs are both interconnected and independent of VLEs; they are both fundamental components of City’s strategic aim to maximise the student learning experience.
1 The Learning Spaces Project at City is shared by the Learning Development Centre, Properties and Facilities and Schools
and is looking at redesigning the physical teaching and learning spaces at City University to provide students with the best teaching and learning experience possible. Source: http://www.city.ac.uk/about/education/ldc/sle/learning-spaces
2
1.2 Project context
Significant recent research suggests that both teaching and learning are affected by technology inside and outside of the classroom. Lomas and Oblinger (2006, p62) emphasise both the importance of technology and the preferences of today’s students for learning that is:
“…digital, connected, experiential, immediate, and social. Constantly connected, they seem to have no fear of technology or interacting with people they have not met face-to-face. Although they communicate a great deal online, they still want direct interaction with others. They appear to prefer by-doing rather than learning-by-listening and often choose to study in groups….they become impatient in situations where they don’t feel engaged. “
Graetz (2006, p80) agrees that this is both a cause and a consequence of technology’s prevalence in everyday life. Higher education learners expect to use the same digital devices they use in their normal daily activities - from shopping to socialising - when learning:
“Today’s devices are colliding with yesterday’s methods…. the classroom is becoming an interactive, collaborative environment where knowledge is created actively by students, many of whom have devices that are as much a part of them as their own skin and that can be a very important part of this process.”
This view, that technology is having an increasingly profound and widespread impact on society as a whole and, therefore also on teaching and learning is shared by Professor John Traxler (Professor of Mobile Learning and Director of Learning Lab at the University of Wolverhampton):
“We need to use these technologies because they transform the nature of teaching and learning, and because the world people are going into – the jobs, the economy that education is supposed to be servicing and supporting – is being changed by these technologies.” (Taxler, 2011, p42)
2. AIMS AND METHODS
The aim for this project was to identify and examine the impact on teaching and learning of technologies that are used in physical learning environments at City. ‘Physical learning environments’ were defined as any space where teaching takes place and, ‘technology’ was defined as anything used in a classroom for teaching purposes. This included hardware, such as projectors and whiteboards, as well as computer software.
2.1 Methodology overview
I used mini-case studies in order to get a range of ‘snap-shots’ of activity across City
University London. This approach involved observations, surveys and interviews. The intention was to gather data that would permit a detailed evaluation of a range of different teaching and learning instances.
I decided on a mixed methods methodology similar to the one I had used in my MSc dissertation. I believed this was an appropriate approach as well as being one I was familiar with.
“A mixed methods research strategy was employed in order to maximise the breadth and depth of data from all stakeholders. This included gathering and analysing quantitative data in order to reveal patterns of use, while also collecting qualitative data so as to be able to drill-down into the detail of the patterns” (Kogan, 2011)
The project had ethical approval as a part of the Strategic Learning Environment (SLE)
Learning Spaces Project. Each of the data gathering activities involving participants had an
information sheet outlining the aims of both this project and the Learning Spaces Project.
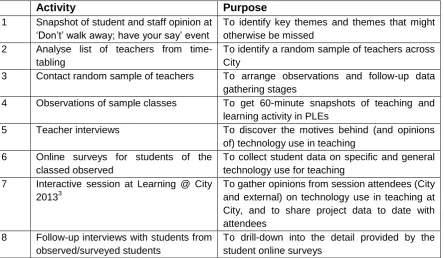
The data gathering stages are outlined in Figure 1.
Activity Purpose
1 Snapshot of student and staff opinion at
‘Don’t’ walk away; have your say’ event
To identify key themes and themes that might otherwise be missed
2 Analyse list of teachers from
time-tabling
To identify a random sample of teachers across City
3 Contact random sample of teachers To arrange observations and follow-up data
gathering stages
4 Observations of sample classes To get 60-minute snapshots of teaching and
learning activity in PLEs
5 Teacher interviews To discover the motives behind (and opinions
of) technology use in teaching
6 Online surveys for students of the
classed observed
To collect student data on specific and general technology use for teaching
7 Interactive session at Learning @ City
20133
To gather opinions from session attendees (City and external) on technology use in teaching at City, and to share project data to date with attendees
8 Follow-up interviews with students from
observed/surveyed students
[image:4.595.76.521.377.635.2]To drill-down into the detail provided by the student online surveys
Fig 1. Project data gathering stages
3 “
The Learning Development Centre (LDC) held the Learning at City Conference and Exhibition 2013 on June 6th. This was the 5th annual higher education conference to be held at City University London, and the emphasis for the conference was on innovation and creativity in higher education”. City University London , 2013 ‘Learning at CIty’ (online) Available at
This multi-pronged case study approach shares attributes with studies on related, parallel topics such as JISC’s (2010) Supporting Learners in a Digital Age (SLiDA) project. That project combined “multiple interactions”, including telephone conversations, face-to-face conversations, document sharing, online workshops and site visits.
2.2 A snapshot of student and staff views
The first stage was to get a snapshot of opinions on the use of technology in PLEs from the key stakeholders; students and staff. The intention was that information gathered would feed into subsequent case study evaluation stages and ensure that key components were not missed.
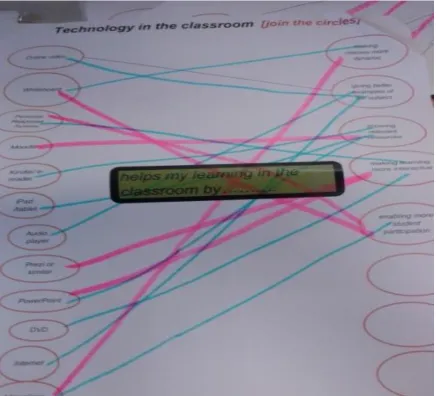
As part of the LDAs, ‘Don’t walk away, have your say’ event, I asked people passing through
[image:5.595.73.510.319.715.2]the University’s main corridor to draw lines on a large sheet of paper to link classroom technologies and what they perceived as those technologies’ impacts (see Figure 2). Participants were able to add both additional technologies and impacts to the sheets of paper if they wished.
2.3 Identify a random sample of lecturers across City University
I was keen to involve a broad section of City University London teachers and learners in my research. I asked the time-tabling department to give me a spreadsheet of all teaching that takes place at the University. This would enable me to identify teachers who taught a certain number of modules (I chose three and above) from a range of Schools. I then contacted these teachers and asked if they were willing to take part in my study.
The time-tabling department kindly provided me with almost 14,000 rows of data specifying the teachers’ names, their departments, the module names and IDs and the class sizes. I realised later that it would have also been useful to have the classroom details too in order to gauge the spread of teaching rooms used in the sample.
2.4 Contacting a sample of lecturers
My aim was to recruit one teacher from each School at City for my study and use them for all of the PLE data-gathering activities: class observations, follow-up interviews, student surveys and follow-up student interviews.
I used a standard email to contact teachers and to ask if they would be willing to participate. If there was interest, I followed this up with a consent form, further information about the project and I then arranged a date either for a pre-observation chat or an actual observation.
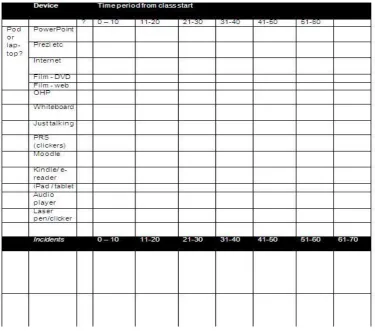
2.5 Class observations
The aim of doing observations was to see what actually happens in PLEs. Although surveying and interviewing people can provide useful data, witnessing activity often gives a different perspective or interpretation of events.
This view is endorsed by DeWalt and DeWalt (2002) who highlight how observations increase both the quality of data collection and its interpretation while also often leading to the development of additional research questions or hypotheses which can benefit the researcher.
Fig 3. Excerpt of class observation sheet
2.6 Teacher interviews
After each class observation, I asked the respective teachers if they would participate in an interview. I used a standard set of questions (Appendix 1) and recorded the interviews in order to minimise time needed to take notes. Once the interviews were complete, I transcribed the main content from the audio recordings.
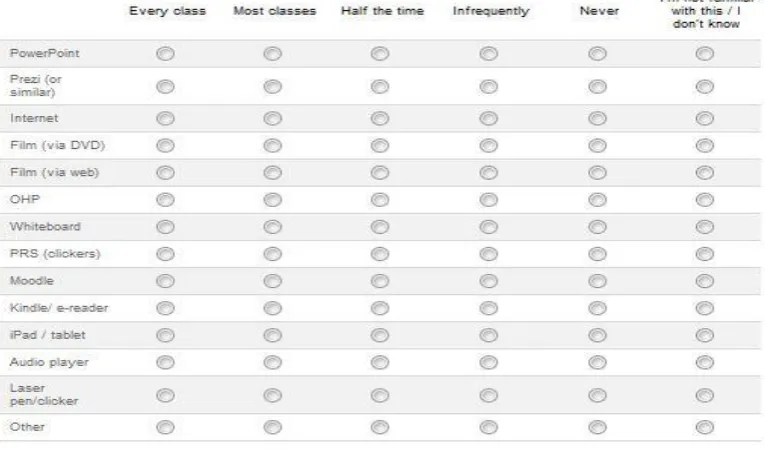
2.7 Student surveys
I created an online survey4 for students to complete for each of the observed classes
(excerpt from this in Fig 4). These were Google surveys which allow anonymous responses from participants. I used a mixture of quantitative and qualitative questions to get both a broad spread of data alongside specific detail.
4
Fig 4. Excerpt of student survey
2.8 Student interviews
2.9 Session at Learning at City Conference 2013
I ran a session at the LDC’s Learning at City Conferencein June 2013. The purpose of the
session was to both share and collect opinions on technology in physical environments: I would talk about the data I had gathered so far, and I would collect data from the session attendees.
To get opinions from the thirty session participants I used online polling (Poll Everywhere) and other, non-digital ways of gathering data including a poll delivered by paper aeroplane. A write-up of the event including a link to Prezi slides I used can be found in a post I did for
the LDC’s Educational Vignettes blog -
http://blogs.city.ac.uk/educationalvignettes/2013/06/20/technology-in-physical-learning-environments-ldc2013/
3. FINDINGS
This section examines the data from each of the data collection activities in order to identify noticeable themes. The themes identified are then discussed in the ‘Discussion of Themes’ section (4).
3.1 A snapshot of student and staff views (Don’t walk away have your say event)
This was a useful exercise in getting an illustration of students’ thoughts on technology in PLEs. I spoke to over 20 students from a range of courses and it was interesting to hear the variety of technology use in PLEs across City as well as opinions of the impact of the technologies’ uses. It was also interesting to note that traditional types of classroom technologies such as whiteboards were almost as popular as technologies such as iPads.
New technology, such as personal response system (clickers) received the most positive lines (13), followed by iPads (ten) , Moodle (ten) , PowerPoint (eight) and Prezi (seven). However, traditional equipment such as whiteboards also received significant attention (seven lines).
I wrote a blog post for the LDC’s Educational Vignettes which describes the event in detail
- http://blogs.city.ac.uk/educationalvignettes/2013/01/16/dont-walk-away-have-your-say-learning-development-associates-event/#comments – in which I concluded that:
“Both the data collected, and the widespread enthusiasm of the participants suggested that there is broad enthusiasm for the use of technology in physical learning environments. A number of comments were made regarding technology - in its various forms - positively affecting students’ learning experiences.” (Kogan, 2013).
3.2 Recruiting teachers for observations and interviews
3.2.1 Class observations
It was a real privilege to spend an hour in four quite different teaching settings. It was fascinating to see the types of technology teachers do and do not use. There was a wide range of technology usage from the classes: some teachers used a number of different tools - and these differed amongst the teachers - while one used no technology at all.
There were classes where technology did not behave as it should. This included a pod not producing audio for an online video. This required the intervention of two AV staff with a drill. There were also examples of non-familiarity with technology, such as when a student assisted a teacher to maximise an online video image so that it was visible to the class on
the screen behind a pod5
It was quite clear from the first observation that it would be very interesting to explore the motives behind technology use and non-use in the classroom. This fed into the choice of questions in the follow-up teacher interviews.
[image:10.595.69.513.362.628.2]The observations took place in different but similar teaching rooms. All of them had a format of rows of tables and chairs with a central corridor and a pod, a whiteboard and a projector at the front (see Fig 5).
Fig 5. Part of a completed observation sheet with shaded cells representing students and black lines showing teacher movement
5
Pods are the technology hubs in City classrooms which house the computer, visualiser and other hardware.
screen whiteboard
pod
3.2.2 Teacher interviews
The transcribed teacher interviews illustrated that teachers have clear views on the benefits of technology. Their opinions on what technologies to use vary, as do both their motives for using certain technologies and their awareness of what technologies are available.
All teachers interviewed were familiar with the in-class equipment available through the pods, but not all were aware of equipment that is available on request. One teacher said she would like to use personal response systems (PRSs) more often, as she had done previously – to do live polls and gain instant class feedback, while another said she did not know they were available, and had only seen them on television.
All teachers thought that their own use of technology in the classroom brought benefits to the students, and that students would agree that it brought students benefits. One teacher highlighted how discussion is instigated through the use of video in the classroom, another that ‘visualisation’ of the subject was fostered by technology. One teacher highlighted the way that classroom materials – including the use of recordings of class – were appreciated
by students who could access them online through Moodle6 either as a revision of if they had
missed the class.
When asked to describe a positive experience using technology in the classroom examples included using Flip cameras to record mentorship diaries and share experiences, and using video (DVDs) to instigate class discussions by incorporating case studies for emotive subjects that require real examples.
3.3 Student surveys
My intention to survey the students from each observed class shortly after I had completed the class observations was not possible due to the embargo on surveying students while the National Student Survey was being run alongside the your voice surveys and PTES. Hence I could not survey students until May 2013, when many students’ courses had finished and exams had started. This also meant that it would not be possible to organise a ‘hard-copy’ survey in class which would have helped to maximise participation rates.
I asked the teachers from the four classes I had observed to circulate the link to each of their classes online survey. Two teachers actually did this. Of the two that did not, one was unable to circulate as it coincided with another evaluation, and one teacher did not reply.
Realising that the student data sample from the observed classes was going to be small, I decided to use Moodle to ask School of Informatics (SoI) students to complete the survey. I did not want to risk having no data, and as I am based in SoI, I thought students might want to help. There would, I believed, be a low risk of causing ‘not-another-survey-syndrome’ (students could complain directly to me if this were the case). I collected data from one ‘observed’ student and 11 SoI students.
6
3.5.1 Technology usage in PLEs
The survey data revealed that PowerPoint was the single most used technology by teachers in PLEs. There was a wide spread of teacher usage in the other technologies with, for example the use of the internet and overhead projectors (OHPs) being used between ‘never’ and ‘most classes’.
3.5.2 Positive impact of technology
There was very clear enthusiasm from students for the use of technology by teachers in PLEs. Participants mentioned how it helps learning by adding dynamism and variety to classes which, in turn leads to discussion, interaction and learning. Some general comments included:
“…technology is useful for explaining concepts in different media, as opposed to the typical lecture slides.”
“…it depends on the module but generally a good interaction learning environment can enhance (the) learning.”
While specific technologies were singled out for their impacts on learning:
“Use of the electronic voting systems (PRSs) has been useful for reaffirming learning and video /podcasts have been useful for seeing theory in practice.”
“Slides viewed in power point form. Clickers - very good way to engage.”
3.5.3 Technology not behaving
When asked about negative experiences of technology use in PLEs, there were three scenarios mentioned by students: technology not functioning, distractions caused by peers’ technology use and, lack of power sockets.
“Time delays in lectures starting due to technical difficulties and setting up problems” “Tutor was unable on several occasions to connect her PC to the projector. Poor IT support was to blame”
“Technology not working or problems. Usually in the lecture hall and projectors not working which impacted the start of the lecture as someone would have to come down to fix it.”
“When too many people have brought a laptop into a lecture it can often be distracting to see what others are doing, especially when they lose focus and begin playing games in the lecture”
3.5.4 Suggestions for technologies currently not available
One technology that was suggested as something that could be used is now available:
“Possibly recording lectures and making them available online, either as an audio recording or as a video on YouTube.”
3.5.5 Relative importance of technology for teaching and learning
When asked to rank four factors in terms of their impact on learning – the teacher,
technology, the PLE and the time of the class – ‘the teacher’ was the clear winner.
Participants were very clear that technology can help teaching and learning, but it cannot achieve this without a good teacher:
“The technology cannot teach me, the lecturer can. An excellent teacher will almost negate the need for technology. To me technology is a supportive tool - if the best tool is paper, then use paper, if its video etc.”
“I believe that technology is important but it is more a case of how the lecturer uses it than the technology itself. Some of the lecturers use a whiteboard and pen and have no technology present and can produce excellent lectures whilst others could have all the technology in the world and it wouldn't help them.”
3.6 Student interviews
Only one student - the student from the observed class who completed the online survey - volunteered to do a follow-up interview. To date, this has not been done due to lack of time on my part.
4.0 DISCUSSION
4.1 Limitations of the project
Before discussing the meaning behind the data collected during this project, it is important to acknowledge its limitations. The samples were relatively small: 20 ad hoc conversations, four observations, three teacher interviews, 11 student surveys, one interactive session (with 30 participants). It would not be correct to claim that firm conclusions can be drawn from the data with scientific certainty.
4.2. Teachers use technology and they would like to use it more
The teacher interviews indicated clear enthusiasm for using technology when it adds value to learning:
“Very pro-technology when there is a justifiable need. Needs to fulfil something we can’t do face-to-face, or to provide a fun element.”
But there is a need for technology to have a clear purpose within the session’s broader
learning outcomes and aims:
“Tech for tech’s sake can lead to a lot of faffing about or the same results if there weren’t any technology”
4.3 Equipment + awareness + training = power
Not all teachers have the same technology skills, and in some cases lack of confidence, prior training and awareness directly impacts of what technology they use in PLEs. Barriers to learning can exist for teachers as well as for students, and these could be overcome if teachers were more aware of training opportunities that are available to them:
“I like it if it helps, but I’m not a fan of technology as I don’t know how to use
technology. I’m not good at using it, but if I knew I could apply it more. As far (long) as it helps me, I use it. But if it’s something completely difficult, it becomes a problem instead of being a tool to help me, it’s an obstacle.”
“I haven’t been brave enough to use pre-recorded sessions…”
4.4 Students value and expect technology in PLEs
Teachers and students mentioned that the use of technology enhances the learning experience by making PLEs more dynamic and classes more varied:
“Discussion has been triggered by videos”
“They see the value that it adds, especially with emotive subjects”
However, not all students are technology-savvy, and some may be reluctant to use equipment themselves. One of the teachers commented:
Similarly, students learning styles learning and preferences differ, amongst students. This can significantly affect their feelings towards the use of technology:
“It doesn’t impact everyone the same way. It depends on the way they learn. Everyone has a different way of learning”
4.5 Infrastructure
Maintaining technology in PLEs across a university the size of City University London is clearly a big task. In four observations, there was one technical breakdown (within a pod) which required technicians to interrupt the class to fix. The teacher of that class said that it had been the second pod problem that week.
Three of the 11 students surveyed made references to equipment not working in PLEs causing delays to classes: “Time delays in lectures starting due to technical difficulties and setting up problems” implies that there may be significant instances of technical problems affecting PLEs.
5.0 CONCLUSIONS
The data I collected during this project implies that technology in PLEs has an important function which has significant impacts on how people teach and learn. It is not perfect and it is not universally popular, but it is part of the fabric of learning at City University London.
On the whole, teachers and students acknowledge the benefits of technology in the way it brings variety and interaction to learning. Both stakeholders would like technology in PLEs to
be more reliable, and both would like there to be more training – or more awareness of
training – for teachers so that are able to incorporate it more easily in their teaching if they so wish.
Saying ‘technology is here to stay’ implies that it is unpacking its bags for the weekend. In reality, technology has already left, and is on its way to its next destination. A lot of people at the University realise that there are valuable and attainable benefits in keeping-up with its journey.
6.0 RECOMMENDATIONS
There is an array of useful exciting and useful technology available at the University for teaching and learning. There is a considerable amount of expertise relating to these technologies, amongst both staff and students. However some staff are unaware of what is available or do not have the time to familiarise themselves with what is available.
I think that showcases and staff ‘champions’ that allow staff a glimpse of how useful and easy these technologies, are can help bridge this gap between supply and use.
In terms of further study, it would be interesting to analyse how teachers learnt about the technologies they use and don’t use, and what benefits they think they bring to students. Data collection regarding technology problems such as equipment malfunction would also be useful.
I would like to thank the following people for their help with this project:
All of the participants in my research, especially my colleagues who were so willing and keen to be observed and interviewed and to help in any way.
Annemarie Cancienne and Anise Bullimore for astute advice and generous encouragement during this project.
Pam Parker for offering me the LDA role and for helpful suggestions during the project.
Alex Elkins and Ginny Williams for allowing me to do the secondment and for trying to find someone to cover 0.2 of my normal role.
Everyone at LDC for making me feel welcome.
References
DeWalt K M and DeWalt B R (2002) Participant observation: a guide for fieldworkers. Walnut
Creek, CA: AltaMira Press.
Graetz K A (2006) The Psychology of Learning Environment, in 'Learning Spaces', Chapter
6, Diana G. Oblinger, Editor, EDUCAUSE. Available electronically at
www.educause.edu/learningspaces
JISC (2010) Supporting Learners in a Digital Age (SLiDA) Available at
http://www.jisc.ac.uk/publications/briefingpapers/2011/slida.aspx Accessed 25 July 2013
Kogan P (2011) The impact of Virtual Learning Environments on learning in Higher
Education - Case study: an evaluation of the use of Moodle in the School of Informatics, City University London. MSc dissertation, Available at
http://peterkogan.com/portfolio/PeterKoganDissertation.pdf Accessed 27 July 2013 Kogan P (2013) Don’t walk away, have your say (online) Available at
http://blogs.city.ac.uk/educationalvignettes/2013/01/16/dont-walk-away-have-your-say-learning-development-associates-event/#comments Accessed 22 July 2013
Lomas C and Oblinger DG (2006) Student Practices and Their Impact on Learning Spaces
in ‘Learning Spaces’, Chapter 5, Diana G. Oblinger, Editor, EDUCAUSE. Available
electronically at www.educause.edu/learningspaces
Traxler J (2011) Emerging Practice in a Digital Age A guide to technology-enhanced
Appendix 1 - Teacher Interviews
In this module: (detail to be removed after interview)
1. Confirm class details re observation
2. How typical was the session I observed of your classes for this module
3. What technology do you use in the classroom when delivering this module?
4. Can you describe a good experience you have had using technology’.
5. How does technology support your teaching and the students’ learning in this module?
6. How does the learning space for this module impact on your teaching and the students’ learning?
7. Are there other technologies which you would like to use but don’t?
a. What are they?
b. What stops you using them? (prompts: availability/lack of training)?
In this and other modules:
8. Describe your attitude to the use of technology in the classroom.
9. What do you think your students’ attitudes are to your use of technology in teaching?
a. How do you think your use of technology affects their learning?
10. What do you think your students’ attitudes are to the use of technology in teaching in general?
11. Who decides which technology is used in your teaching? a. Are you encouraged to experiment (by whom?)? b. Do you share expertise amongst your colleagues?
12. What do you think makes a good physical learning environment/experience?
13. If you have any comments or questions, please say.
School: Level:
Module: Interviewee:
Room details (number, type, size etc):
Day & Time:
Number of
Students (register):