0022-538X/97/$04.0010
Copyrightq1997, American Society for Microbiology
Clinical Data Sets of Human Immunodeficiency Virus Type 1
Reverse Transcriptase-Resistant Mutants Explained by a
Mathematical Model
NIKOLAOS I. STILIANAKIS,1CHARLES A. B. BOUCHER,2MENNO D. DE JONG,3
REMKO VAN LEEUWEN,3ROB SCHUURMAN,2ANDROB J. DE BOER4*
Theoretical Division, Group T-10, Los Alamos National Laboratory, Los Alamos, New Mexico 87545,1and
Department of Clinical Microbiology, Utrecht University, 3508 GA Utrecht,2National AIDS Therapy
Evaluation Centre, University of Amsterdam, Academic Medical Centre,3and Theoretical Biology,
Utrecht University, 3584 CH Utrecht,4The Netherlands
Received 8 March 1996/Accepted 16 September 1996
Treatment of human immunodeficiency virus type 1 (HIV-1) infection during the clinical latency phase with drugs inhibiting reverse transcriptase (RT) reduces the HIV-1 RNA load and increases the CD41T-cell count. Typically, however, the virus evolves mutations in the RT gene that circumvent the drugs. We develop a mathematical model for this situation. The model distinguishes quiescent from activated CD41 T cells, incorporates the fact that only activated cells can become productively infected by HIV-1, embodies empirical estimates for the drug resistance and the mutation frequency for each of the HIV-1 drug-resistant mutants, and assumes the antiviral immune response to remain constant over the course of the experiments. We analyze clinical data on the evolution of drug-resistant mutants for the RT inhibitors lamivudine and zidovudine. The results show that the evolutionary sequence of the drug-resistant mutants in both data sets is accounted for by our model, given that lamivudine is more effective than zidovudine. Thus, current empirical estimates of the mutation frequencies and the drug resistances of the mutants suffice for explaining the data. We derive a critical treatment level below which the wild-type HIV-1 RNA load can rebound before the first drug-resistant mutant appears. Our zidovudine data confirm this to be the case. Thus, we demonstrate in the model and the data that the rebound of the HIV-1 RNA load in the case of zidovudine is due to the outgrowth of wild-type virus and the first resistant mutant, whereas that in the case of lamivudine can only be due to the drug-resistant mutants. The evolution of drug resistance proceeds slower in the case of zidovudine because (i) zidovudine is not as effective as lamivudine and (ii) the first zidovudine drug-resistant mutant is competing with the rebounding wild-type virus.
The emergence of human immunodeficiency virus type 1 (HIV-1) isolates resistant to protease- and reverse transcrip-tase (RT)-inhibiting drugs during treatment is well docu-mented in several clinical studies (3, 21, 22, 34, 36). One observes a fast reduction of the HIV-1 RNA load, which is typically accompanied by an increase of CD41T-cell counts. After several weeks of treatment, however, the viral RNA load rebounds. The rebound is frequently, i.e., not always (8), as-sociated with the appearance of drug-resistant mutants. Geno-typic analysis demonstrates that the resistance to RT is caused by specific amino acid changes at certain codons in the HIV-1 RT gene (21, 22). These point mutations appear in a typical order and in the case of zidovudine become combined, con-ferring higher resistance (4, 8, 35). Similarly, the protease studies describe mutations in the HIV-1 protease gene (36).
In this report, we first investigate whether the data that we have on the mutation frequencies and drug resistance of the mutants can explain the precise evolutionary order in which the mutants arise. This question is addressed for two indepen-dent clinical data sets on treatment with lamivudine (35) and zidovudine (8). Since the model indeed explains the precise evolutionary order, we find good agreement between model and data. Second, data obtained from treatment with zidovu-dine demonstrate that the HIV-1 RNA load rebounds before the drug-resistant mutants appear (8). We describe that such a
rebound of the HIV-1 RNA load can adequately be explained by the increase of the CD41T-cell population during treat-ment.
Our model extends previous mathematical models for the dynamics of the HIV-1 infection of the CD41target cells (11, 32) and for evolution of drug-resistant mutants (14, 28) be-cause we (i) use recently derived parameters indicating that HIV-1 infection is very dynamic process (17, 36) and (ii) in-corporate recent detailed parameter estimates for the drug resistance and the mutation frequency of the mutants.
MATERIALS AND METHODS
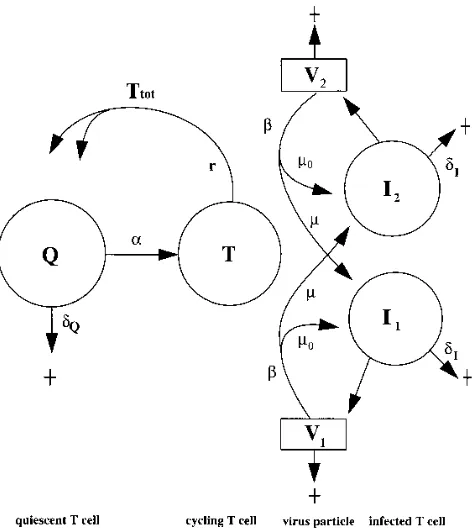
Model.HIV-1-infected individuals typically have a long clinical latency phase in which (i) HIV-1 is present abundantly in lymphoid organs (9, 31), (ii) the CD41population is lower than normal (14), and (iii) HIV-1 and HIV-infected CD41cells are turning over rapidly (17, 36). Our model describes a particular time point somewhere in the clinical latency phase. This time point is an equi-librium between HIV-1 infection and T-cell renewal. We study the effects of treatment with drugs inhibiting the HIV-1 infection process. The essential as-sumption in our model is that the immune response to the virus remains invariant over the time course of the clinical experiments. By this assumption, HIV-1 is (transiently) limited by availability of target CD41T cells (5, 6). The typical response of HIV-1 to drug treatment is the evolution of drug-resistant mutants. The drug resistance of these mutants is known and is incorporated in the model. In the model, we distinguish quiescent CD41T cells Q, target cells or activated CD41T cells T, and virus particles Vjand productively infected CD41T cells Ij
for virus strain j (Fig. 1).
In adults, the CD41T-cell compartment is largely maintained by self-renewal (25). Hence we allow the quiescent CD41T cells to become activated by low-level activation at a rate a, they die at a ratedQ, and they appear by the
proliferation of activated T cells at a maximum rate r; i.e., we write * Corresponding author. Mailing address: Theoretical Biology,
Utrecht University, Padualaan 8, 3584 CH Utrecht, The Netherlands.
161
on November 9, 2019 by guest
http://jvi.asm.org/
dQ
dt 5
2rT
11Ttot/Tmax2~a 1dQ!
Q (1)
where the 2/(11Ttot/Tmax) term defines a density-dependent regulation of the
proliferation rate. When Ttot5Tmax, proliferation stops. The activated CD41T
cells T appear by activation of quiescent cells, they revert to the quiescent stage at a rate r, and they are infected by all virus strains at a ratebweighted by the total RT fitness fjof the strain; i.e., we write
dT
dt 5aQ2rT 2bT
O
j
fjVj (2)
where the sum term says that CD41T cells are infected by all virus strains at a rate weighted by the total fitness of the strain.
The productively infected CD41T cells appear by the infection of target cells by virus. Because infection may involve mutations, i.e., RT errors, we implement a mutation matrix M incorporating the estimated mutation frequencies. Matrix element Mjlis the mutation frequency by which strain j appears from strain l.
Thus, the diagonal elements Mjjgive the frequency at which strain j correctly
transcribes itself. Hence we write
dIj
dt 5 bT
O
l
MjlflVl2dIIj (3)
where dIis the turnover rate of productively infected cells. Thus, the total
number of CD41T cells in our model is defined by Ttot5Q1T1 (jIj.
Assuming that the virus density is proportional to the density of infected CD41 T cells, and appropriate scaling, allows us to write Vj5Ij. Hence we may
arbitrarily define the total HIV-1 RNA load as RNA5104(V
jcopies per ml,
which gives realistic viral RNA loads (see below). The estimated half-life of quiescent CD41T cells is about 1,000 days (29); i.e., we setdQ51023per day.
Activated cells revert to the quiescent stage by a single cell division at a rate of one per day (i.e., r51 per day). Because in normal individuals about 2% of the T cells are activated, we seta 50.02 per day as the activation rate of quiescent cells. Setting Tmax51,100 cells perml, we obtain an equilibrium of about 1,000
CD41T cells perml (26). The turnover of productively infected cells, which can
be due to an effective cellular immune response or to viral cytopathicity, is estimated to bedI50.5 per day (17, 33, 36). The in vivo infection rate is not
known. Settingb 50.05, we obtain reasonable CD41T-cell counts (see below).
Fitness.Each of the virus strains has a total RT fitness fjwhich combines the
fitness in the absence of the drug with the drug resistance in its presence. Previous estimates for the fitness of drug-resistant mutants in the absence of RT were just a few percent less than that of the wild-type virus (5, 15). Recent experiments, however, suggest that these fitness differences may be considerable, i.e., more than 10% (1, 16, 30a). Here we scale the fitness of the wild-type virus to 1, i.e., we set ewt51, and conservatively choose as a default value for the
fitness of all mutant strains ej50.99. For the fitness in the presence of the drug fj, we use the conventional notion of the IC50, which is the drug concentration at
which the effect of the drug is half-maximal. Thus, we employ the classical saturation function for the IC50(18), describing the drug resistance as
fj5 ej
1 1D/Rj
(4)
where D is the effective drug concentration and Rjis the IC50of strain j. We
consider only mutants with a resistance higher than that of the wild-type virus. Hence, we again scale Rwt51 and require for all mutants j that Rj.1. In the
absence of the drug, i.e., when D50, the fitness is defined by the RT fitness ej.
In the presence of the drug, the total fitness becomes half-maximal at an effective drug concentration of D5Rj.
Mutation frequencies.In our data sets, we consider mutations in the RT gene providing resistance to the RT inhibitors. The first measure to include in the mutation matrix is the number of nucleotide changes that are involved in going from strain l to strain j. Recent work (27) showed that the basic error rate of RT is on the order of 331025mutations per nucleotide and that about two-thirds
of the mutations are base pair substitutions. In the context of the RT gene, however, different nucleotide changes are not equally probable. It is well estab-lished that the G3A mutation is preferred over all others. Indeed, about half of the 231025base pair substitutions per nucleotide are G3A point mutations
(27). Our G3A mutation frequency is therefore set tom151025per nucleotide.
Five other mutations are involved in our study: A3G, C3A, A3C, T3A, and A3T. The last four would be least probable because they involve transversions. Following Keulen et al. (20), we therefore classify the mutation rates into three classes,m1. m2. m3, setting P(G3A)5 m1, P(A3G)5 m2, and P(C3A)5
P(A3C)5P(T3A)5P(A3T)5 m3. Due to a lack of good data for the
low-frequency mutations, we arbitrarily set the last two rates tom25 m1/2 andm3 5 m1/10. The frequency Mjjthat a virus correctly copies itself can be
approxi-mated by considering that RT is 1,680 bases long and that the basic error rate is on the order of 331025(27); i.e., we set M
jj5 m05(12331025)1680.0.95.
We model mutation as a continuous process, which implies that all mutants are present at low frequency before the onset of treatment (30). We ignore muta-tions involving more than two nucleotide changes; i.e., the minimum mutation frequency that we consider ism32.
Disease progression.During the clinical latency stage, disease progression is characterized by slowly decreasing CD4 counts and slowly increasing HIV-1 RNA levels. The patients in our data have different CD4 counts and are thus assumed to be in different stages of disease progression. Because we pick just one time point in the clinical latency phase, we here refrain from modeling disease progression. However, we have to be able to study different time points, i.e., patients with different CD4 counts. Since disease progression is associated with hyperactivation of the immune system (12), we model progression by setting different values fora, the T-cell activation rate. Increasingaindeed decreases the CD4 count and increases the viral load (7). The data supporting this (17) are discussed below.
RESULTS
[image:2.612.61.298.70.335.2]Our detailed data on the evolution of HIV-1 drug-resistant mutants consider mutations in RT selected during treatment with either zidovudine (8) or lamivudine (35). These two drugs differ in efficacy (10). With respect to the nadir, serum levels of HIV-1 RNA drop 1 to 2 logs in about a week with lamivudine treatment (35), whereas administration of zidovudine leads to a drop of fourfold in 2 to 4 weeks (8, 24). The two drugs also differ in the time scale of the rebound in the HIV-1 RNA load, which is 2 to 3 weeks for lamivudine (35) and 2 months for zidovudine (8). We show that these differences in amplitude and time scale can adequately be explained by a difference in effective drug concentration D. Recent studies estimated the dynamics of HIV-1 RNA and CD41T-cell turnover in analyser using potent protease or RT inhibitors (17, 36). The effective-ness of these drugs is comparable to that of lamivudine. We therefore model all of these data sets by considering a low effective drug concentration in the case of zidovudine (where FIG. 1. A scheme of the model. Resting T cells Q become activated at a rate
aand die at a ratedQ. Activated cells T return to the quiescent state after
division into two daughter cells at a rate r. Viral particles V infect activated cells at a rateb, thus generating productively infected cells I. V1and I1denote one
particular strain of virus; V2with I2denote another strain. Themparameters
represent mutation: at a ratem0, a viral strain copies itself correctly; at a ratem,
however, RT errors create novel strains. Productively infected T cells I are
cleared at a ratedI.
on November 9, 2019 by guest
http://jvi.asm.org/
D #1 are our typical values) and a high effective drug con-centration in all other cases (i.e., D5100 is our typical value). We first study how our model fits the recently estimated dy-namic parameters (17, 36).
Dynamics in the absence of mutation.The empirical data are obtained from the rates at which CD4 counts recover following anti-HIV-1 treatment (17, 36). We now perform the same treatment in our model and ignore mutation by settingm1
5 m25 m350 (Fig. 2). In the protease data, the average CD4
count is on the order of 200 CD41cells perml (17, 36). In Fig. 2a, we choosea 50.1 so that the equilibrium at day 0 has Ttot
.200. The average CD4 count in the zidovudine data is about 400 CD41cells (8). Thus, in Fig. 2b and c, we seta 50.04 in order to have Ttot. 400. In Fig. 2a and b, we depict a very
effective drug (like ritonavir or lamivudine) by setting D5100 at day 0; in Fig. 2c, we depict a less effective drug (like zidovu-dine) by setting D51 at day 0.
The model behavior corresponds closely with the data. The rate at which the viral RNA level decreases strongly depends on the effective drug concentration D. In Fig. 2a and b, where
D5100, the viral RNA level decreases with exactly the same slope as is reported in the recent empirical data (17, 36), i.e., with a slopedI(see Appendix). For the potent drugs, this slope
is rather independent of the CD4 count: the slopes are very similar in Fig. 2a and b. This is also the case in the data of Ho
et al. (17). The slopes with which the CD4 counts recover
depend on the initial CD4 count, as they do in the published
data (17). In Fig. 2a and b, the exponential slopes, i.e., {1n[Ttot
(10)]/[Ttot(0)]}/10, are 0.04 and 0.01, respectively. For CD4
counts of 200 and 400, respectively, these two values match the data (17).
The picture becomes much more complicated when the drug is less effective, as is the case for the zidovudine data. For D5 1, we show in Fig. 2c that the slope with which the viral RNA level declines is less steep. In the appendix, we show that this slope is determined by a combination of factors: the total fitness of the wild-type virus, the initial CD4 count, and the CD4 recovery rate. Because the viral RNA level decreases only slowly, the rate at which the CD4 level recovers is also slow. We conclude that the time scale at which the viral RNA level drops and the CD4 count recovers is determined by the effec-tive drug concentration D.
In Fig. 2c, we observe that after a month of treatment, the viral RNA level rebounds. If we were to run this simulation longer, the system would approach a new equilibrium in which the HIV-1 RNA load is similar to that of day 0, while CD41 T-cell counts have approximately doubled. Thus, halving the fitness, by setting D51 (equation 4), approximately doubles the CD4 count. Since there are no drug-resistant mutants in this simulation, the viral rebound is entirely due to the recovery of the CD41 cells (which increases the virus growth rate). Exactly the same phenomenon is observed in our data: after a month of zidovudine treatment, virus RNA levels rebound (8). In the data, this happens before the first drug-resistant mutants appear. The rebound, being due to the recovery of the CD41 cells, is therefore nothing more than a classical predator-prey oscillation (28).
The only difference between Fig. 2b and c is the effective drug concentration D. The total fitness of the HIV-1 wild-type in Fig. 2b is fwt51/(11100).0.01 (see equation 4) and that
in Fig. 2c is fwt51/(1 11)50.5. Apparently there exists a
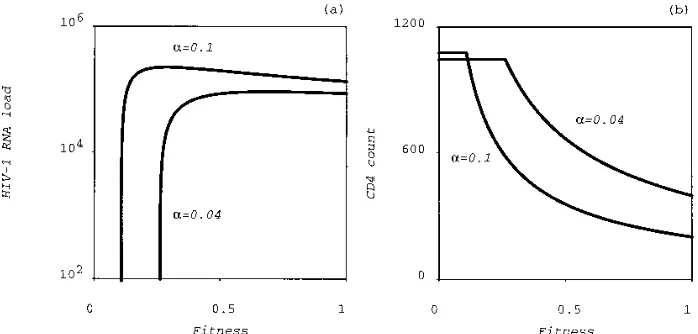
critical total fitness below which the virus cannot survive. This is studied more rigorously in Fig. 3, where we plot the stable equilibrium HIV-1 RNA load (Fig. 3a) and the CD41T-cell count (Fig. 3b) as a function of the total fitness fwt. The critical
total fitness corresponds to the point where the equilibrium HIV-1 RNA drops to zero and the CD41T cell counts reaches the flat noninfected equilibrium. The critical total fitness de-pends on the T-cell activation rate a but has an order of magnitude of 20% of the maximum fitness. Interestingly, the equilibrium viral load is almost a step function of the total fitness (Fig. 3a). Thus, decreasing the total fitness, e.g., by giving an RT inhibitor, while maintaining it above the critical value hardly affects the equilibrium HIV-1 RNA load. Instead, the effect of changing the total fitness is largely reflected in the equilibrium CD41T-cell count.
Figure 2b in the report of Ho et al. (17) depicts that the per-capita growth rate of CD41T cells decreases with increas-ing CD41 baseline counts. As shown in Fig. 2a and b, our model matches these data. The per-capita CD41T-cell growth rate in our model has a similar inverse relationship with the baseline CD41count due to two separate mechanisms. First, the growth rate decreases with the CD41counts because of our density-dependent proliferation term. Second, in our model, low CD41counts correspond to a late latency stage with higher T-cell activation rates.
Lamivudine.In a recent study, 20 patients were treated with the RT inhibitor lamivudine (35). In this study, CD41T-cell counts, serum HIV-1 RNA loads, and the frequency of three drug-resistant mutants were assessed at baseline and at 2 days and 1, 2, 3, 4, 6, and 8 weeks after the onset of treatment. Resistance to lamivudine is caused by a mutation in codon 184 of the HIV-1 RT gene, which replaces the wild-type methio-FIG. 2. The parameters of the model are confirmed by comparing them to
recent data (17, 36). Parameters: r51, Tmax51,100,b 50.05,dQ50.01,dI5
0.5, ewt51, Rwt51, andm050.95. In this figure, mutations into drug-resistant
mutants are switched off, i.e.,m15 m25 m350. (a)a 50.1 and D5100; (b) a 50.04 and D5100; (c)a 50.04 and D51.
on November 9, 2019 by guest
http://jvi.asm.org/
nine residue (ATG) with either an isoleucine (ATA) or a valine (i.e., GTG or GTA) (4, 21, 22). These mutants have a 500- to 1,000-fold reduction in susceptibility, while the drug resistance of the valine mutant seems to be somewhat higher than that of the isoleucine mutant (35). We therefore set Rwt5
1, Riso5500, and Rval5750. For the fitness in the absence of
the drug, we conservatively set ewt51 and eiso5eval50.99.
Using the mutation frequencies estimated above, we obtain the mutation matrix
M 5
1
m0
m1
m2
m1m2
m2
m0
m22
m2
m1
m12
m0
m1
m1m2
m1
m2
m0
2
where the rows and columns are ordered from the wild-type virus to the isoleucine mutant to the valine GTG mutant to the valine GTA mutant. Each row gives the mutation frequencies with which that strain is created by each of the other strains. For example, the isoleucine mutant is expected to be created from the wild-type virus most often because the second entry in the first column (i.e.,m1) is larger than all others (ignoring the
nonmutational diagonal elements). Similarly, the valine mu-tant is expected to mutate backward into the wild-type virus most often because the third entry in row one (i.e.,m1) is larger
than all others.
Most patients had a 1- to 3-log decrease in the HIV-1 RNA level in about a week. We therefore opt for a highly effective drug concentration; i.e., we set D5100. The HIV-1 RNA and CD41cell count data differ strongly from patient to patient. Plotting the median mutant frequencies reveals that the iso-leucine mutant comes first and that it is rapidly replaced by the GTG valine mutant (35). Since taking median values tends to smooth the data, one would have to compare the model be-havior to that of each individual patient. Here we make a compromise by picking one patient whose HIV-1 RNA data resemble those of the median and whose CD41 counts in-crease in response to the therapy. Thus, we pick patient C0021, who has an initial CD41count of 220 cells perml and an HIV-1 RNA level of approximately 4 3 104 RNA copies, which is
representative for the 20 patients in the study (35). We there-fore seta 50.1, yielding Ttot.200 with approximately 10%
productively infected cells. The data and the model results are depicted in Fig. 4.
The CD41cell count of patient C0021 increases marginally only, i.e., from 220 at day 0 to 280 at day 28 (Fig. 4a). Pooling the data of all 20 patients, Schuurman et al. (35) indeed report a median increase of the CD41 counts of about 15% at 3 weeks. This is very low compared to the data for protease inhibitors and/or other RT inhibitors (17, 36). In our model (Fig. 4a), we find a twofold increase in the CD41counts in about 2 weeks, which deviates from our own data (35) but is in agreement with other data on protease (17, 36) and RT (8, 36) inhibitors.
In the model, the total viral RNA load reaches its minimum around day 8, peaks again around day 20, and then approaches a new equilibrium (Fig. 4b). The initial phase during which the virus load descends corresponds closely to the data (i.e., pa-tient C0021 and the median counts (35). In the model, the HIV-1 RNA rebound during week 2 is faster than that in the data. One has to bear in mind that our model remains an oversimplification and that a precise fit is not to be expected. A possible explanation is the absence of long-lived infected cells from our model (see Discussion).
Figure 4c depicts the fractions of the wild-type, isoleucine, and valine genotypes. The model matches the data in that both generate exactly the same evolutionary sequence. The isoleu-cine and valine mutants appear within 2 weeks. The valine mutant subsequently outcompetes the isoleucine mutant over a time period of a few months. For this particular patient, one could argue that the isoleucine mutant appears and disappears faster than it does in the model. There is, however, too much variation between the patients to blame this on the model. For instance, patient C0021 might have had a higher than expected initial frequency of the isoleucine mutant (see below). In both the model and the data, the fraction of GTA valine mutants always remains small (not shown). Thus, we conclude that taking the current drug resistance and mutation estimates, we can account for the correct evolutionary sequence.
[image:4.612.133.482.70.237.2]Zidovudine.In another recent study, 24 asymptomatic HIV-1-infected persons were treated with zidovudine (8). Their average CD41count was 380 cells perml. The serum HIV-1 RNA load was measured at 0, 1, 3, 6, and 9 months and at FIG. 3. The equilibrium level of the HIV-1 RNA load (a) and the CD41T-cell count (b) as a function of the total fitness (i.e., fj) in the absence of mutation. This
plot was generated by switching off mutation and by calculating the equilibrium of the wild-type virus and the total CD41count for all total fitness values between 0 and 1. Knowing the total fitness of any strain, in either the presence or the absence of the drug, one can determine from these curves the equilibrium that would be attained by that strain. The region where the equilibrium HIV-1 level becomes zero, i.e., around a total fitness fj.0.2, gives the critical total fitness required for
eradication of that strain. Parameters are as in Fig. 2.
on November 9, 2019 by guest
http://jvi.asm.org/
approximately 1 and 2 years after treatment. Relative amounts of HIV-1 RNA containing mutations in RT at positions 41, 70, and 215 were assessed as described previously (8). The muta-tions involved in zidovudine resistance are ATG3CTG for codon 41, AAA3AGA for codon 70, and ACC3TAC for codon 215. Since the mutations involve different codons, they can appear in any combination. We thus have seven strains: the wild-type Vwt, the mutants at positions 41 (i.e., V41), 70 (i.e.,
V70), 215 (i.e., V215), and the mutants at combinations of 41
with 70 (i.e., V4170), 41 with 215 (i.e., V41215), and 70 with 215
(i.e., V70215). The drug resistances (IC50s) of the seven strains
have been estimated: Rwt5 1, R4154, R7058, R215516,
R417059, R41215560, and R7021556 (19, 23).
Using the mutation rates estimated above, we obtain the mutation matrix
M 5
1
m0
m3
m2
m32
m2m3
0 0
m3
m0
m2m3
0 m2
m32
0 m1
m1m3
m0
0 m3
0 m32
m32
0 0 m0
0 m3
m2
m1m3
m1
m3
0 m0
0 0
0 m32
0 m3
0 m0
m2m3
0 0 m3
2
m1
0 m1m3
m0
2
where the rows and columns are ordered as follows: wild type,
41, 70, 215, 4170, 41215, and 70215. Again, each row gives the mutation frequencies by which the strain of that row is created by each of the other strains.
The typical sequence of the three mutations as they appear in the data is 703215341 (8). Empirically, it is not known in what specific strains these mutations arise; we know only what fraction each mutation comprises of the total population. In our model, the same fractions are defined as p415(V411
V41701V41215)/(Vj, p705(V411V41701V41215)/(Vj, and p215
5(V2151V412151V70215)/(Vj. Using the parameters on the
drug resistance and the mutation frequencies, we typically find the same sequence in the model, i.e., p703p2153p41. In the
model, we can easily check in what specific strains these mu-tations appear. Thus, we complement the empirical data with suggestions on the precise evolutionary order.
The time scale at which the mutations appear largely de-pends on the effective drug concentration D. Ideally, it would be preferred to estimate D from the initial slope with which the virus RNA load declines (see Appendix). Unfortunately, this is not possible because our first data point at 1 month has missed the first minimum (which is probably at 2 weeks [24]). We therefore fit the effective drug concentration such that the time scale on which the mutants arrive is approximately correct. This gives D50.5, which means that the total fitness of the wild-type virus becomes fwt51/(11D)50.67. Because such
a fitness is well above the critical fitness of Fig. 3, we expect the wild-type virus to rebound.
We again compare the model behavior with the data by picking one representative patient, i.e., patient 276, whose be-havior corresponds reasonably well to the median results (8). This patient has a CD41count of about 500 T cells perml; we therefore set a 5 0.03, yielding Ttot. 500. Simulating the
model with our conservative fitness estimate of ej50.99 for all
drug-resistant mutants j, we again find the correct evolutionary order of the drug-resistant mutants. The 70 mutant, however, arrives far too early, and the 215 mutants tend to arrive too late. We therefore adjust the (unknown) fitness parameters such that e41 5 e70 5 e4170 5 0.95. The other fitnesses all
involve the 215 mutation and are kept at their default value of 99%; i.e., we keep e2155e412155e7021550.99. This indeed
slows down the 70 mutants and speeds up the 215 mutants. The sensitivity of the model behavior for these fitness parameters pinpoints the significance of determining them experimentally (work in progress; see Discussion).
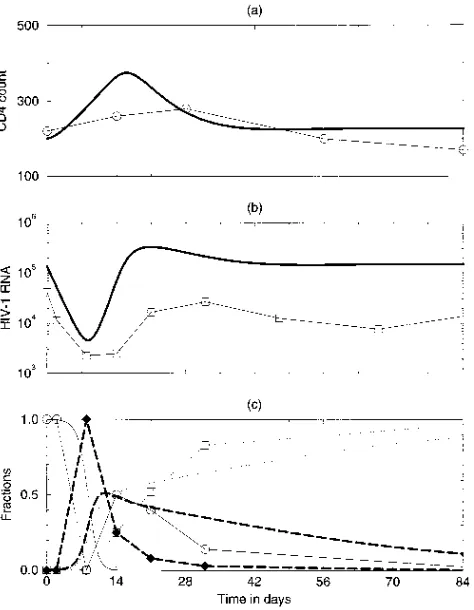
Pooling the data from all cases and plotting median results, we have demonstrated a significant increase of the CD41cell count in the first few months (8). The CD41data from indi-vidual patients are very noisy, however (e.g., patient 276 in Fig. 5a). In the model, the CD41count peaks at day 60, having increased by about 30% (Fig. 5a). For an initial CD41count of 500 cells perml, this CD41increase is in agreement with the data (17).
Comparing the HIV-1 RNA levels of the model and the data is difficult because we have missed the true minimum in our data. The model shows a minimum RNA level at about 3 weeks after the onset of treatment, which is in agreement with other recent data (24). Nevertheless, the model behavior is a little too fast because the total virus RNA rebounds such that we have a peak at 2 to 3 months. In the data, the HIV-1 RNA recovery takes longer (Fig. 5b and reference 8). The observa-tion that the model is somewhat too fast is the same (minor) discrepancy between model and data that we have discussed above for the lamivudine data.
[image:5.612.62.299.70.375.2]The evolutionary sequence in the model and the data are again in close correspondence (Fig. 5c). The first drug-resistant mutant is the codon 70 amino acid change. This mutant is FIG. 4. CD41 and HIV-1 RNA levels of a representative patient (i.e.,
C0021) treated with lamivudine and of the model with an effective drug concen-tration D5100. The patient data are denoted by symbols connected by straight lines; the model behavior is denoted by the continuous lines. Settinga 50.1 per day, we obtain a CD41count in the infected state of Ttot.200. Parameters are
as in Fig. 2, butm151025,m25531026, for the mutant RT fitnesses we
conservatively estimate eiso5eval50.99, and the drug resistances are estimated
to be Riso5500 and Rval5750. (a) CD41counts; (b) total HIV-1 RNA, (c)
RNA fractions of the wild-type virus (circles), of the isoleucine mutant (dia-monds), and of the valine mutant (squares).
on November 9, 2019 by guest
http://jvi.asm.org/
slowly replaced by the 215 mutation. The latter strain subse-quently also acquires the codon 41 mutation. The 70 mutation confers relatively little resistance (i.e., R7058) but is
gener-ated at highest frequency by RT mutations in the wild-type virus. Thus, we again conclude that the current empirical esti-mates for the drug resistances and mutation frequencies of the HIV-1 variants are sufficient for explaining the evolutionary order observed in the clinical data. The evolutionary rates in the model are again somewhat too fast.
The clinical data on the fractions of the mutations are com-plemented with the absolute genotype densities, as suggested by the model, in Fig. 5d. In the model, the wild-type population initially decreases but rebounds after about 3 weeks. Thus, the initial increase of the viral load after 1 month is largely due to a rebound of the wild-type virus. We have reported similar behavior in our clinical data (8). In the model, the wild-type virus increases due to the increased availability of target CD41 T cells, which compensates for the antiviral effect of the zidovudine treatment (see also Fig. 3). Around day 60, the wild-type virus starts to decline again due to competition with the 70 mutant, which in the presence of the drug (i.e., for D5
0.5) has a higher fitness than the wild-type virus. Similar model behavior has also been reported before (14, 28).
The competition between the wild-type virus and the 70 mutant slows down the development of drug resistance. If we were to artifically prevent the rebound of the wild-type virus, the CD41target cell levels would increase even further, allow-ing the 70 mutant to develop faster. This was tested in the model by artificially decreasing the wild-type density during its rebound phase (not shown). We conclude that ecological com-petition processes determine the evolutionary time course of resistance development. Figure 5d shows that the 215 mutant is slowly replaced by the 41215 strain, which combines the codon 41 and 215 mutations. Thus, the late rise in the 41 fraction in Fig. 5c is due to the outgrowth of the 41215 com-bination.
Variation.Although most patients adhere to the typical pic-ture depicted in Fig. 5, there is wide variation between the patients (8). The stochasticity of the mutation process is a very likely source of the variation. In the present model, we have no stochasticity: mutation is implemented as a continuous pro-cess. Elsewhere we have illustrated the effect of stochasticity in the evolutionary time course by altering the initial densities of the mutants (8).
DISCUSSION
A host-parasite model is an important tool for understand-ing the complex evolutionary process of the development of drug resistance. The model qualitatively accounts for the evo-lutionary sequence of drug-resistant mutants in two clinical data sets with different RT-inhibiting drugs (8, 35), has the correct time scales for the changes in the HIV-1 RNA load and the CD41cell counts (17, 36), and has approximately correct time scales for the appearance of the drug-resistant mutants (8, 35). The results show that (i) the observed time scale differ-ences between lamivudine and zidovudine can be explained by a difference in the efficacies of the two drugs, (ii) the precise evolutionary order of the drug-resistant mutants can be fully explained by a combination of the current estimates for the mutation frequencies and for the drug resistances of the mu-tants, and (iii) the observed rebound of the wild-type HIV-1 RNA load in the zidovudine data can be explained by the lower efficacy of zidovudine. In the model, there is a critical treat-ment level below which the wild-type HIV-1 RNA load can rebound before the appearance of the first drug-resistant mu-tant. Finally, the model complements our understanding of the zidovudine data by suggesting which genotypes are responsible for the codon fractions that we measure.
There are also important differences between the model behavior and the clinical data, however. First, the increase in the CD41T-cell counts during the first weeks of treatment is too large in the model. The T-cell growth rate in our model is determined by the T-cell activation rate a. Thus, one could argue that a simple solution for this discrepancy would be to select a lower T-cell activation rate. This issue seems to be more complicated, however. Recent clinical data show that in patients treated with highly effective combinations of antiret-rovirus drugs, the CD41 T-cell counts fail to fully recover. Thus, it seems that at undetectably low viral loads, the CD41 compartment remains affected. For instance, the destruction of lymphoid tissue by the HIV infection could decrease the equi-librium CD41 cell count (13), i.e., could decrease the Tmax
parameter of our model (7). Such an effect would put a real-istic limit to the recovery of the CD41 levels in our model. Second, a large-scale clinical study on the effects of lamivudine and zidovudine (10) reports a sustained 0.5- to 1-log decrease FIG. 5. The evolution of drug-resistant mutants to zidovudine for a
repre-sentative patient (i.e., 276) and for the model with D50.5. The patient data are denoted by symbols connected by straight lines; the model behavior is denoted by the continuous lines. Settinga 50.03 per day, we obtain a CD41count in the infected state of Ttot.500. Assuming a higher efficacy for the 215 mutant, we
set the fitness of the six mutant strains to e415e705e417050.95 and e2155
e412155e7021550.99. The resistance parameters were previously estimated as
R4154, R7058, R215516, R417059, R41215560, and R7021556 (19, 23).
Other parameters are as in Fig. 4, with the addition ofm351026. (a) CD41
T-cell counts; (b) total HIV-1 RNA; (c) RNA fractions of the 41 mutant (circles), of the 70 mutant (diamonds), and of the 215 mutant (squares). (d) HIV-1 genotypes at arbitrary concentrations. Heavy solid line, total HIV-1 RNA; heavy dashed line, wild-type RNA; light solid line, the 70 mutant; dotted line, the 215 mutant; the dash-dotted line, the 41215 mutant.
on November 9, 2019 by guest
http://jvi.asm.org/
in the viral load after a year of treatment. This is a surprising finding because by the evolution of drug resistance, one ex-pects hardly any effects of these drugs after a year of treatment. The only explanation seems that the drug-resistant mutants have a much lower fitness than we have assumed. We have seen in Fig. 3, however, that in our model, the equilibrium viral load is almost a step function of the total fitness. Thus, in our model, a 0.5- to 1-log change in the equilibrium viral load cannot be realistically attributed to a change in the total fitness. With respect to the parameter values, the fitness values ejin
the absence of the drug remain the most important unknowns. Recent in vivo estimates for zidovudine-resistant mutants sug-gest that in the absence of zidovudine, the fitness differences between mutants may be considerable, i.e., 10 to 40% (16). For lamivudine, only preliminary in vitro estimates are available. Estimating these fitness values in vitro is extremely difficult because the estimates depend strongly on the type of target cell used in the assay (1). In some of the cell lines, however, it also seems that in the absence of lamivudine, the fitness of the valine mutant in the lamivudine study is considerably higher than that of the isoleucine mutant (1, 30a). Thus, our conser-vative estimate of making the fitness of all mutants 99% of that of the wild type need not be realistic. However, in our model, the total fitness is the product of drug resistance and the fitness of the absence of the drug (equation 4). Thus, if the fitness of the valine mutant were indeed higher than that of the isoleu-cine mutant in the lamivudine study (1, 30a), i.e., if eval.eiso,
we would obtain similar results in our model when we give the two mutants similar drug resistances, i.e., set Rval.Riso.
An obvious extension of our model would be to allow for a small subpopulation of long-lived productively infected cells. This could significantly alter the evolutionary dynamics be-cause early strains will linger much longer. This could explain why in our model the drug-resistant mutants appear a little too fast and the wild-type virus disappears too early. The distinc-tion between quiescent and activated CD41 T cells in our model is not required for explaining our data. This feature of our model, however, allows us to model disease progression by an increase in the general T-cell activation rate, which is in agreement with current ideas (12) and which yields the realistic progression scheme of a slowly increasing HIV-1 RNA load with concomitant slow decrease of the CD41T-cell count (7). This behavior is otherwise difficult to obtain with host-parasite models.
In our model, we have ignored variations in the antiviral immune response by keeping the turnover of productively in-fected cells constant. As a consequence, the HIV infection in our model is target cell limited (6, 7). The same is true for the previous models for the evolution of drug resistance to RT inhibitors (14, 28). One can, however, account for the same clinical data with immune-control models in which the level of the immune response changes rapidly to the changes in the viral load that are induced by the antiretrovirus treatments (7). In summary, with our mathematical model, we have been able to increase our understanding of the evolutionary dynam-ics of HIV-1 drug resistance. Armed with these insights, one can test our assumptions, study alternative models, and try to fill in the unknown parameters.
APPENDIX
Right after the administration of the RT inhibitors, the viral RNA load drops. In the data (8, 35) and in the model, this decline is approximately linear on a log scale. The slope of this decline can be used to estimate the effective drug concentration D. The maximum slope is determined by the turnover ratedIof productively infected
cells. This turnover rate was previously estimated by assuming that the
drug is 100% effective (17, 36). This assumption of an almost 100% effective drug concentration is probably reasonable for the protease inhibitors (17, 36) and for lamivudine (35) but is definitely incorrect for zidovudine (8). Thus, we here estimate the relationship between the predicted slopeuand the effective drug concentration D.
Since the level of drug-resistant mutants is low at the onset of treatment, we ignore them and consider the wild-type virus only. This simplifies equation 3 to
dIwt
dt 5 Iwt
S
bm0T
1 1 D 2 dI
D
(A1)where we have substituted Vwt5Iwt. This nonlinear equation can be solved for
the time period during which virus declines when we make the approximation that the target cell level T remains constant or changes only slowly. Given this approximation, the slope is
u 5bm0T~0!
11D 2dI (A2)
where T(0) is the number of activated cells at day 0. We can easily check that if the drug is 100% effective, i.e., if D3`, the slope is given by the turnover rate of productively infected cells, i.e.,u 5 2dI(17, 36).
We have modeled the lamivudine data and the protease inhibitor data by setting the effective drug concentration to an arbitrary large value, i.e., D5100. The effective drug concentration can be evaluated in terms of the fitness of the wild-type virus, i.e., by 1/(11D), which for D5100 is approximately zero. Hence D5100 is approximately 100% effective. We can check the predicted slope for a CD41count of approximately 200 cells [i.e., for a target cell level T(0) .11] by evaluating equation A2,
u50.051310.95100311 20.5.53102320.5. 20.5 (A3)
which also shows that for D5100, the slope is approximately2dI, irrespective
of the number of activated CD41cells in the range of interest.
Although the slopes with which the virus RNA levels decline in the zidovudine data cannot be estimated because our first data point at 1 month is 2 weeks later than the true minimum (24), it is clear that patients treated with zidovudine typically have much smaller slopes. Zidovudine is less effective than lamivudine or ritonavir. Thus, in terms of the total fitness of the wild-type virus, we can no longer approximate 1/(11D).0, which means that we precisely have to know the effective drug concentration. In fact, if earlier samples of the RNA load were available, one could use equation A2 to estimate the effective drug concentration
D from the initial slope at which viral RNA declines if all other parameters are
known.
ACKNOWLEDGMENTS
This work was performed during a visit of N. I. Stilianakis to Utrecht University and a visit of R. J. De Boer to the Santa Fe Institute. N. I. Stilianakis thanks the Netherlands Science Foundation for supporting his visit to the Theoretical Biology group in Utrecht. R. J. De Boer thanks Alan S. Perelson and the Santa Fe Institute for their Theoret-ical Immunology Program supported by the Joseph P. and Jeanne M. Sullivan Foundation. N. I. Stilianakis now is a postdoctoral fellow at the Los Alamos National Laboratory supported by the German Cancer Research Centre.
REFERENCES
1. Back, N. K. T., M. Nijhuis, W. Keulen, C. A. B. Boucher, B. B. Oude Essink,
A. B. P. Van Kuilenburg, A. H. Van Gennips, and B. Berkhout.1996. Reduced replication of 3TC-resistant HIV-1 variants in primary cells due to a processivity defect of the reverse transcriptase enzyme. EMBO J. 15:4040– 4049.
2. Bofill, M., A. Mocroft, M. Lipman, E. Medina, N. J. Borthwick, C. A. Sabin,
A. Timms, M. Winter, L. Baptista, M. A. Johnson, C. A. Lee, A. N. Phillips, and G. Janossy. 1996. Increased numbers of primed CD81, CD381, CD5RO1T cells predict the decline of CD41T cells in HIV-1-infected patients. AIDS 10:827–834.
3. Boucher, C. A. B., M. Tersmette, J. M. A. Lange, P. Kellam, R. E. Y. De
Goede, B. J. W. Mulder, G. Darby, J. Goudsmit, and B. A. Larder.1990. Zidovudine sensitivity of human immunodeficiency viruses from high-risk, symptom-free individuals during therapy. Lancet 336:585–590.
4. Boucher, C. A. B., E. O’Sallivan, B. J. W. Mulder, C. Ramautarsing, P.
Kellam, G. Darby, J. M. A. Lange, J. Goudsmit, and B. A. Larder.1992. Ordered appearance of zidovudine resistance mutations during treatment of 18 human immunodeficiency virus-positive subjects. J. Infect. Dis. 165:105– 110.
5. Coffin, J. M. 1995. HIV-1 population dynamics in vivo: implications for
on November 9, 2019 by guest
http://jvi.asm.org/
genetic variation, pathogenesis, and therapy. Science 267:483–489. 6. De Boer, R. J., and C. A. B. Boucher. 1996. Anti-CD4 therapy for AIDS
suggested by mathematical models. Proc. R. Soc. Lond. B 263:899–905. 7. De Boer, R. J., and A. S. Perelson. Target cell limited and immune control
models of HIV infection: a comparison. Submitted for publication. 8. De Jong, M. D., J. Veenstra, N. I. Stilianakis, R. Schuurman, J. M. A. Lange,
R. J. De Boer, and C. A. B. Boucher.1996. Host-parasite dynamics and outgrowth of virus containing a single K70R amino acid change in reverse transcriptase are responsible for the loss of HIV-1 RNA load suppression by zidovudine. Proc. Natl. Acad. Sci. USA 93:5501–5506.
9. Embretson, J., M. Zupancic, J. L. Ribas, A. Burke, P. Racz, K. Tenner-Racz,
and A. T. Haase.1993. Massive covert infection of helper T lymphocytes and macrophages by HIV-1 during the incubation period of AIDS. Nature 362: 359–362.
10. Eron, J. J., S. L. Benoit, J. Jemsek, R. D. MacArthur, J. Santana, J. Quinn,
D. R. Kuritzkes, M. A. Fallon, and M. Rubin.1995. Treatment with lami-vudine, zidolami-vudine, or both in HIV-positive patients with 200 to 500 CD41 cells per cubic millimeter. N. Engl. J. Med. 333:1662–1669.
11. Essunger, P., and A. S. Perelson. 1994. Modelling HIV-1 infection of CD41 T-cell subpopulations. J. Theor. Biol. 170:367–391.
12. Fauci, A. S. 1993. Multifactorial nature of human immunodeficiency virus diseases: implications for therapy. Science 262:1011–1018.
13. Feinberg, M. B. 1996. Changing the natural history of HIV disease. Lancet
348:239–246.
14. Frost, S. D. W., and A. R. McLean. 1994. Quasispecies dynamics and the emergence of drug resistance during zidovudine therapy of HIV-1 infection. AIDS 8:323–332.
15. Goudsmit, J., A. De Ronde, D. D. Ho, and A. S. Perelson. 1996. HIV-1 fitness in vivo: Calculations based on a single zidovudine resistance mutation at codon 215 of reverse transcriptase. J. Virol. 70:5662–5664.
16. Goudsmit, J., A. De Ronde, E. R. De Rooij, and R. J. De Boer. Broad spectrum of in vivo fitness of HIV-1 subpopulations differing at reverse transcriptase codons 41 and 215. Submitted for publication.
17. Ho, D. D., A. U. Neumann, A. S. Perelson, W. Chen, J. M. Leonard, and M.
Markowitz.1995. Rapid turnover of plasma virions and CD4 lymphocytes in HIV-1 infection. Nature 373:123–126.
18. Holford, N. H., and L. B. Sheiner. 1982. Kinetics of pharmacologic response. Pharmacol. Ther. 16:143–166.
19. Kellam, P., C. A. B. Boucher, and B. A. Larder. 1992. Fifth mutation in human immunodeficiency virus type 1 reverse transcriptase contributes to the development of high-level resistance to zidovudine. Proc. Natl. Acad. Sci. USA 89:1934–1938.
20. Keulen, W., C. A. B. Boucher, and B. Berkhout. 1996. Nucleotide substitu-tion patterns can predict the requirements for drug-resistance of HIV-1 proteins. Antiviral Res. 31:45–57.
21. Larder, B. A., G. Darby, and D. D. Richman. 1989. HIV-1 with reduced sensitivity to zidovudine (AZT) isolated during prolonged therapy. Science
243:1731–1734.
22. Larder, B. A., and S. D. Kemp. 1989. Multiple mutations in HIV-1 reverse
transcriptase confer high-level resistance to zidovudine (AZT). Science 246: 1155–1158.
23. Larder, B. A., P. Kellam, and S. D. Kemp. 1991. Zidovudine resistance predicted by direct detection of mutations in DNA from HIV-infected lym-phocytes. AIDS 5:137–144.
24. Loveday, C., S. Kaye, M. Tenant-Flowers, M. Semple, U. Ayliffe, I. V. D.
Weller, and R. S. Tedder.1995. HIV-1 RNA serum-load and resistant viral genotypes during early zidovudine therapy. Lancet 345:820–824. 25. Mackall, C. L., C. V. Bare, L. A. Granger, S. O. Sharrow, J. A. Titus, and
R. E. Gress.1996. Thymic-independent T cell regeneration occurs via anti-gen-driven expansion of peripheral T cells resulting in a repertoire that is limited in diversity and prone to skewing. J. Immunol. 156:4609–4616. 26. Malone, J. L., T. E. Simms, G. C. Gray, K. F. Wagner, J. R. Burger, and D. S.
Burke.1990. Sources of variability in repeated T-helper lymphocyte counts from human immunodeficiency virus type 1 infected patients: total lympho-cyte counts fluctuation and diurnal cycle are important. J. Acquired Immune Defic. Syndr. 3:144–151.
27. Mansky, L. M., and H. M. Temin. 1995. Lower in vivo mutation rate of human immunodeficiency virus type 1 than that predicted from the fidelity of purified reverse transcriptase. J. Virol. 69:5087–5094.
28. McLean, A. R., and M. A. Nowak. 1992. Competition between zidovudine-sensitive and zidovudine-resistant strains of HIV. AIDS 6:71–79. 29. McLean, A. R., and C. A. Michie. 1995. In vivo estimates of division and
death rates of human lymphocytes. Proc. Natl. Acad. Sci. USA 92:3707–3711. 30. Najera, I., A. Hoguin, M. E. Quinones-Mateu, M. A. Munoz-Fernandez, R.
Najera, C. Lopez-Galindez, and E. Domingo.1995. pol gene quasispecies of human immunodeficiency virus: mutations associated with drug resistance in virus from patients undergoing no drug therapy. J. Virol. 69:23–31. 30a.Nijhuis, M., et al. Unpublished data.
31. Pantaleo, G., C. Graziosi, J. F. Demarest, L. Butini, M. Montroni, C. H. Fox.,
J. M. Orenstein, D. P. Kotler, and A. S. Fauci.1993. HIV-1 infection is active in lymphoid tissue during the clinically latent stage of disease. Nature 362: 355–358.
32. Perelson, A. S., D. E. Kirschner, and R. J. De Boer. 1993. Dynamics of HIV-1 infection of CD41T cells. Math. Biosci. 114:81–125.
33. Perelson, A. S., A. U. Neumann, M. Markowitz, J. M. Leonard, and D. D. Ho. 1996. HIV-1 dynamics in vivo: virion clearance rate, infected cell lifespan and viral generation time. Science 271:1582–1586.
34. Richman, D. D., J. M. Grimes, and S. W. Lagakos. 1990. Effect of stage of disease and drug dose on zidovudine susceptibilities of isolates of human immunodeficiency virus. J. Acquired Immune Defic. Syndr. 3:743–746. 35. Schuurman, R., M. Nijhuis, R. Van Leeuwen, P. Schipper, D. De Jong, P.
Collis, S. A. Danner, J. Mulder, C. Loveday, C. Christopherson, S. Kwok, J. Sninsky, and C. A. B. Boucher.1995. Rapid changes in human immunode-ficiency virus type 1 RNA load and appearance of drug-resistant virus pop-ulations in persons treated with lamivudine. J. Infect. Dis. 171:1411–1419. 36. Wei, X., S. K. Ghosh, M. E. Taylor, V. A. Johnson, E. A. Emini, P. Deutsch,
J. D. Lifson, S. Bonhoeffer, M. A. Nowak, B. H. Hahn, M. S. Saag, and G. M. Shaw.1995. Viral dynamics in human immunodeficiency virus type 1 infec-tion. Nature 373:117–122.