Pharmacodynamic (PD) models of certain new Formulations
Thesis submitted to
The Tamilnadu Dr.M.G.R. Medical University, Chennai, India in partial fulfillment of the requirements
for the degree of Doctor of Philosophy
Submitted by
S.MURALIDHARAN, M.Pharm, M.B.A,
JUNE 2010
J.S.S. COLLEGE OF PHARMACY
OOTACAMUND - 643001
DECLARATION
I hereby declare that the thesis entitled
“Development and validation of
Pharmacokinetic (PK) and Pharmacodynamic (PD) Models of Certain New
Formulations”
submitted by me for the award of degree of
Doctor of
Philosophy
of the Tamilnadu Dr.M.G.R. Medical University, Chennai is a record
of research work done by me at J.S.S. College of Pharmacy, Ootacamund - 643
001, Tamilnadu, India during the years 2007-2010 under the supervision of
Dr.S.N.Meyyanathan and that the thesis had not previously formed the basis for
the award of any degree, diploma, associateship, fellowship or other similar title
previously.
CERTIFICATE
This is to certify that the thesis entitled
“Development and validation of
Pharmacokinetic (PK) and Pharmacodynamic (PD) Models of Certain New
Formulations”
is a record of research work done by Mr.S.Muralidharan at J.S.S.
College of Pharmacy, Ootacamund - 643 001, Tamilnadu, India during the years
2007-2010 under my supervision and that the thesis had not previously formed
the basis for the award of any degree, diploma, associateship, fellowship or other
similar title previously. I also certify that the thesis represents independent work
done by the candidate.
Dr.S.N.Meyyanathan
This is to certify that the thesis entitled
“Development and Validation of
Pharmacokinetic (PK) and Pharmacodynamic (PD) Models of Certain New
Formulations”
is a record of research work done by Mr.S.Muralidharan at J.S.S.
College of Pharmacy, Ootacamund - 643 001, Tamilnadu, India during the years
2007-2010 under my supervision as co-guide.
Dr.E.P.Kumar
J.S.S. MAHAVIDYAPEETHA
J.S.S. COLLEGE OF PHARMACY, OOTACAMUND
Constituent college of J.S.S. University, Mysore
CERTIFICATE
This is to certify that the thesis entitled
“Development and validation of
Pharmacokinetic (PK) and Pharmacodynamic (PD) Models of Certain New
Formulations”
is a record of research work done by Mr.S.Muralidharan at J.S.S.
College of Pharmacy, Ootacamund - 643 001, Tamilnadu, India during the years
2007-2010 under the supervision of Dr.S.N.Meyyanathan.
Dr.K.Elango
Principal i/c
I express my gratitude to Dr.S.N.Meyyanathan
,
Supervisor for his
support and guidance throughout the course of this work. His trust on me to
explore and pursue my own interests gave me confidence that will remain with
me for the rest of my career. Most importantly, his patience and understanding
allowed me to complete this work even when faced with some very serious
challenges, both experimental and emotional.
I thank Dr. B. Suresh
,
Vice Chancellor, J.S.S. University, Mysore, for his
encouragement and the facilities extended to me for carrying out this project.
I thank Dr.K.Elango
,
Principal i/c, J.S.S. College of Pharmacy,
Ootacamund for his support and encouragement.
I thank Dr.M.J.Nanjan
,
Director, Post graduate studies and Research,
J.S.S.College of Pharmacy, Ootacamund for his support and advice.
I thank Mr.Puttarajappa
,
Superintendent, J.S.S. College of Pharmacy,
Ootacamund for his support and encouragement.
I thank Mr.J.S.K.Nagarajan
,
Deputy Director, CADRAT, J.S.S. College of
Pharmacy, Ootacamund for his direct help in completing the bioavailability
study.
I thank Dr.E.P.Kumar for consenting to assume the role of my co-advisor
in the area of pharmacokinetics.
I thank Dr.M.Ramanathan
,
Principal, PSG College of Pharmacy,
Coimbatore for his direct help in completing the Pharmacodynamic study.
Mr.Kaliaperumal Krishnaraj, Mrs. Gowarama, Mr. B.Babu, Mr. N.
Muruganandam and 2006-2009 PG Students for their support.
I thank all the faculty, staff members, my fellow graduate students and
researchers of the J.S.S.College of Pharmacy, Ootacamund.
My most sincere pranams to Lotus feet of His Holiness Jagadguru Sri
Shivarathri Deshikendra Mahaswamigalavaru
,
Suttur Mutt, Mysore for his
blessings to my endeavor.
I thank my entire family for always being there for me, without their
constant support and encouragement this work would not have been possible. I
thank my family for their constant support.
I thank Indian Council of Medical Research (ICMR), New Delhi for
providing me Senior Research Fellowship (SRF).
Page No
1.0 Introduction
01
2.0 Aim and objectives
12
3.0 Review of literature
14
4.0
Place
of
research
work
24
5.0 Scope and plan of work
25
6.0
Materials
and
methods
28
7.0 Results and Discussion
56
8.0 Summary and conclusion
68
Bibliography
Annexure I
Drug
Profiles
Annexure II
Certificate Copies of Institutional review board
Annexure III
1
1. INTRODUCTION
The cost of bringing a new drug to market is estimated to be between $800 million and $1 billion. Currently, there is a huge gap between the number of candidate drug compounds in testing and the ones that actually get approved. Less than 10% of drugs in phase I clinical trials make it to the approval phase. Two key reasons the drugs fail at late stages are a lack of understanding of the relationship between dose-concentration response and unanticipated safety events. Given this scenario, it is critical to have enabling tools that help predict how a drug will perform in vivo and assist in the success of a clinical therapeutic candidate. Pharmacokinetics (PK) characterizes the absorption, distribution, metabolism, and elimination properties of a drug. Pharmacodynamics (PD) defines the physiological and biological response to the administered drug.
Pharmacokinetic - pharmacodynamic (PK-PD) modeling:
2
impact.
PK/PD testing is typically performed at every stage of the drug development process. Because development is becoming increasingly complex, time consuming, and cost intensive, companies are looking to make better use of PK/PD data to eliminate flawed candidates at the beginning and identify those with the best chance of clinical success. A major factor in the drug development process is time. Predictive modeling tools can provide invaluable information to better streamline the drug development process. Pharmaceutical companies traditionally perform sequential testing of drug candidates by screening and selecting the best performers at every phase of the clinical drug-development cycle. This can take as long as six to 10 years and cost several hundred million dollars. Hence, it is imperative for companies to adopt technologies that improve the quality of the drug development process and improve speed to market.
Traditional PK/PD modeling in drug development defines parameters such as drug dose concentration, drug exposure effects, drug half-life, drug concentrations against time, and drug effects against time. "When used more broadly, quantitative techniques such as drug modeling, disease modeling, trial modeling, and market modeling can support the entire development process, which results in better decisions through explicit consideration of risk and better utilization of knowledge,". However, implementing a PK/PD modeling approach can be challenging. "One has to invest time and resources up front in the drug development process. From a modeling standpoint, one needs to identify and build into the trial design frequent measures of clinical efficacy and/or toxicity as well as representative biomarkers for effective modeling,".
3
physiologic processes (disease, age, gender, etc.) are considered. PK-PD modeling is the mathematical description of the relationships between PK and PD. PK-PD modeling allows the estimation of PK-PD parameters and the prediction of these derived, clinically relevant parameters as well. PK-PD simulations allow the assessment of the descriptive parameters as functions of dose and dose rate. These simulations can provide the dose–response curve for onset, magnitude, and duration of effect. This information can be valuable in optimizing dose and dosing regimens1. Currently, there is growing recognition of the importance of PK-PD studies in all phases of drug development2–5. In preclinical studies, PK-PD is used to interpret toxicokinetics data and via physiological modeling and allometric scaling, it is also used to extrapolate results from animals to humans6,7. During early clinical testing, PK-PD is used to aid in the interpretation of dose–response and escalation studies. In addition, there are several instances in which PK-PD modeling has been used by regulatory agencies to recommend a dose and/or regimen not originally studied as part of the clinical program8. As in the case of pharmacokinetics, methods to measure pharmacologic effects and bio-mathematical models had to be developed to characterize and evaluate pharmacodynamic processes.
4
usually are translated into inter- and intravariability. In the case of PD variability, it becomes important to identify the useful predictor (covariates) of PD individuality to facilitate individually optimized pharmacotherapy. It is necessary, therefore, to establish very comprehensive patient profiles during the development of studies. Moreover, the study populations must be representative of the target patient population with respect to age, gender, race, and environmental and pathophysiological characteristics. If these requirements are absent, the relevance and usefulness of covariates may be questionable10,11.
5
Sustained Release Dosage forms
The sustained release (SR) mode of drug administration has certain features that have an important impact on the magnitude of the pharmacologic response: (a) it minimizes fluctuation in blood drug concentrations (i.e. between peak and trough). However, due to the pronounced non-linear relationship between drug concentration and pharmacologic effect (i.e. pharmacodynamics) the impact of this property differs considerably as a function of the shape of the pharmacodynamic profile and the position of the specific range of concentrations on the curve of this profile; (b) it produces a slow input rate which tends to minimize the body’s counteraction to the drug’s intervening effect on regulated physiological processes; and (c) it provides a continuous mode of drug administration. This important pharmacodynamic characteristic may produce, in certain cases, an opposite clinical effect than that attained by an intermittent (pulsatile) mode of administration of the same drug. For many drugs with non-concentration-dependent pharmacodynamics, the exposure time, rather than the AUC, is the relevant parameter and it can therefore be optimized by SR preparations. The slow input function may minimize hysteresis in cases where the site of action is not in a rapid equilibrium with the blood circulation. The pharmacodynamics of the desired effect(s) and/or adverse effect(s) may also be influenced by the site of administration, especially in cases where the drug is delivered directly to its site of action. These factors demonstrate the important influence of the mode of administration on the pharmacological and clinical outcomes. In addition, they highlight the need to include these pharmacodynamic considerations in all stages from drug development to the optimization of their clinical use.
Estimation of the drugs in biological medium
Methods of measuring drugs in biological media are increasingly important problems related to the following studies and are highly dependent on biopharmaceutical analytical methodology;
6
• New drug development
• Clinical pharmacokinetics
• Research in basic biomedical and pharmaceutical sciences
The most common samples obtained for biopharmaceutical analysis are blood and urine. Faeces are also utilized, especially if the drug or metabolite is poorly absorbed or extensively excreted in the bile. Other media that can be utilized include saliva, breath and tissue.
The choice of sampling media is determined largely by the nature of the drug study. Whole blood is usually collected by venipuncture with either a hypodermic syringe or a vacutainers apparatus. The volume of blood collected at any one sampling time is usually limited to 5 to 15 ml (depending on the assay sensitivity and the total number of samples taken for a given study). If the blood is allowed to clot and is centrifuged, about 30 to 50% of the original volume is collected as serum (upper level). Generally plasma is preferred because of its greater yield from blood. The greater the yield, the greater the amount of drug and the fewer the problems with sensitivity. Blood, serum or plasma samples can be utilized for drug studies and may require protein denaturation steps before further manipulation.
Detection of a drug or its metabolite in biological media is usually complicated by the matrix. Because of this, various types of clean up procedures involving techniques such as solvent extraction and chromatography are employed to effectively separate drug components from endogenous biological material. The ultimate sensitivity and selectivity of the assay method may be limited by the efficiency of the clean up methodology.
7
more complex biological matrix. The number of steps in a separation procedure should be kept to a minimum to prevent loss of drug or metabolite. Sometimes, the separation steps are preceded by a sample pretreatment.
In order to avoid decomposition or other potential chemical changes in the drugs to be analyzed, biological samples should be frozen immediately upon collection and thawed before analysis. When drugs are susceptible to plasma esterases, the addition of esterase inhibitors such as sodium fluoride to blood samples immediately after collection helps to prevent drug decomposition.
In most cases, preliminary treatment of a sample is needed before proceeding to the measurement step. Drug analyses are required in samples as diverse as plasma, urine, faeces, saliva, bile, sweat and seminal fluid. Each of these samples has its own set of factors that must be considered before an appropriate pretreatment method can be selected. Such factors as texture and chemical composition of the sample, degree of drug-protein binding, chemical stability of the drug and types of interferences can affect the final measurement step.
Biological materials such as plasma, faeces and saliva contain significant quantities of protein that can bind a drug. The drug may have to be freed from protein before further manipulation. Protein denaturation is important because the presence of proteins, lipids, salts and other endogenous materials in the samples can cause rapid deterioration of HPLC columns and also interfere the assay. Protein denaturation procedures include the use of tungstic acid, ammonium sulfate, heat, alcohol, trichloro acetic acid and perchloric acid.
Extraction of drugs and metabolites from biological samples
8
faeces), it is an example of liquid-solid extraction. If the extraction involves two liquid phases, it is an example of liquid-liquid extraction.
Liquid-solid extractions occur between a solid phase and a liquid phase. Either phase may initially contain the drug substance. Among the solids that have been used successfully in the extraction (usually via adsorption) of drugs from liquid samples are XAD-2 resin, charcoal, alumina, silica gel and aluminum silicate. Liquid-solid extraction is often particularly suitable for polar compounds that would otherwise tend to remain in the aqueous phase. The method could also be useful for amphoteric compounds that cannot be extracted easily from water.
The liquid solid extraction method provides a convenient isolation procedure for blood samples, thus avoiding solvent extraction, protein precipitation, drug losses and emulsion formulation. It is possible, however, that strong drug-protein binding could prevent sufficient adsorption of the drug to resin.
Liquid-liquid extraction is probably the most widely used technique because it can remove a drug or metabolite from larger concentrations of endogenous materials that might interfere with the final analytical determination and also this technique is simple, rapid and has a relatively small cost factor per sample.
9
the combined extracts now contain the total extracted drug, it is desirable to calculate the number of extractions necessary to achieve maximum extraction.
Factors that influence partition coefficient and hence recovery of drugs in liquid-liquid extraction are the choice of the solvent, pH and ionic strength of the aqueous phase. It is generally accepted that diethyl ether and chloroform are the solvents of choice for acidic and basic drugs, respectively, especially when the identity of the drugs in the samples is unknown. Chemically neutral drugs are extracted into either solvent depending on their relative partition tendencies.
The presence of metabolites or more than one drug in a biological sample usually demands a more sophisticated separation for their measurement especially, when two or more drugs are of similar physical and chemical nature.
Chromatography is a separation technique that is based on differing affinities of a mixture of solutes between at least two phases. The result is a physical separation of the mixture into its various components. The affinities or interactions can be classified in terms of a solute adhering to the surface of a polar solid (adsorption), a solute dissolving in a liquid (partition) and a solute passing through or impeded by a porous substance based on its molecular size (exclusion).
Most of the drugs in biological samples can be analyzed by HPLC method because of several advantages like rapidity, specificity, accuracy, precision, ease of automation and eliminates tedious extraction and isolation procedures.
10
Methods for analyzing drugs in biological samples can be developed, provided one has knowledge about the nature of the sample, namely, its molecular weight, polarity, ionic character and the solubility parameter. An exact recipe for HPLC, however, cannot be provided because method development involves considerable trial and error procedures. The most difficult problem usually is where to start, what type of column is worth trying with what kind of mobile phase. In general, one begins with reverse phase chromatography, when the compounds are hydrophilic in nature with many polar groups and are water soluble.
The organic phase concentration required for the mobile phase can be estimated by gradient elution method. For aqueous sample mixtures, the best way to start is with gradient reverse phase chromatography. Gradient can be started with 5 - 10 % organic phase in the mobile phase and the organic phase concentration (acetonitrile or methanol) can be increased up to 100 % within 20-30 min. Separation can be optimized by changing the initial mobile phase composition and the slope of gradient according to the chromatogram obtained from preliminary run. The initial mobile phase composition can be estimated on the basis of where the compounds of interest were eluted, namely, at what mobile phase composition.
Elution of drug molecules can be altered by changing the polarity of the mobile phase. The elution strength of a mobile phase depends upon its polarity, the stronger the polarity, higher is the elution. Ionic samples (acidic or basic) can be separated, if they are present in undissociated form. Dissociation of ionic samples may be suppressed by proper selection of pH.
11
Whenever acidic or basic samples are to be separated it is strongly advisable to control mobile phase pH by adding a buffer and the pH of the buffer should be adjusted before adding organic phase. The buffer selected for a
particular separation should be used to control pH over the range of pKa ± 1.0. The buffer should transmit light at or below 220 nm so as to allow low UV detection.
12
2. AIM AND OBJECTIVES
The main role of preclinical pharmacokinetics and pharmacodynamics in drug discovery and development is to optimize candidate selection for the target therapeutic area, taking into consideration the type of agent required, and to predict the dose and dosing regimen for initial clinical trials with due concern to the requirements for effective treatment in the target therapeutic area. In order for this approach to be successful, a clear understanding is required for both the pharmacological target and drug disposition (absorption, clearance and distribution) of new chemical entities. A fundamental tenet in linking the pharmacokinetic and pharmacodynamic phases is that free drug in the systemic circulation is in equilibrium with the receptors. In the pharmacokinetic phase, only free drug can be cleared and drug is reversibly bound to tissues and blood. The pharmacodynamic phase is further subdivided into the interaction with the drug receptor triggering post-receptor events, eventually leading to actual drug effect. In this phase, only free drug can exert pharmacological effect and the free concentration of drug in plasma is in direct equilibrium with the interstitial fluid bathing most cells, since the capillary wall contains sufficient aqueous pores to allow the rapid passage of relatively small molecules, regardless of physicochemistry. Most receptor targets are accessed extracellularly. Therefore, one can expect that all drugs regardless of physicochemistry will be in direct equilibrium, at these targets, with free drug in plasma.
The development of a correlation is based on the scientific principles associated with mathematical modeling, statistical evaluation, and numerical deconvolution. The development and validation of a PK/PD is based on the ability of fraction of the drug absorbed versus fraction of the drug-dissolved relationship of various formulations.
For the estimation of the drugs present in the biological fluids, HPLC method20-24, is considered to be more suitable since it is a powerful and rugged method and also extremely specific, linear, precise, accurate, sensitive and rapid.
13
14
3. REVIEW OF LITERATURE
Several investigations have been carried out in the past on PK-PD and method development for analyzing drugs in biological fluids. A survey of literature was carried out in such investigations. In what follows, some of the important investigations are discussed.
Andreas Jostel and coworkers25 have reported a new sustained-release preparation of human growth hormone and its pharmacokinetic, pharmacodynamic and safety profile. The objective of this study was to evaluate a new sustained-release preparation of human growth hormone and its pharmacokinetic, pharmacodynamic and safety profile. Adult GH replacement is currently given by daily subcutaneous (sc) injections. Recently, sustained-release (SR) preparations of GH have been developed, the preparations being characterized by a dominant early release, resulting in supraphysiological early GH peaks, and a rapid decline thereafter. Design employed was phase I /II study of hGH-Biosphere (SkyePharma AB, Malmö, Sweden), a new SR preparation of recombinant human GH in amylopectin microspheres coated with polylactide-coglycolide. Patients included are eight adults with severe, untreated GH deficiency (stimulated GH peaks between < 1 and 1·7 µg/l), aged 36·1 years (range22–49 years) in good general health. Measurments were pharmacokinetic (PK), pharmacodynamic (PD) and safety data over a period of 28 days. The systemic and local tolerability of the drug was satisfactory, and no serious adverse events occurred. PK analysis showed a smaller early serum hGH peak followed by a broad sustained second peak of hGH (Cmax 1·20 µg/l at 7·2 days), and hGH levels were maintained above baseline for at least 14 days. The mean GH level never exceeded 1·1µg/l, making the GH fluctuations comparable to continuous sc infusion. Resultant IGF-I concentrations were characterized by sustained elevation at a level near
15
with superior efficacy in achieving target IGF-I levels without causing supraphysiological GH concentrations. Our data suggest the suitability of this preparation for longer-term trials in adults with injection frequencies of no more than once every 2–3 weeks.
16
9.6%). The different values of the drug-specific pharmacodynamic parameters are consistent with the different opioid μ receptor subtypes involved in the antinociceptive and respiratory depressant effects.
17
pneumoniae to 859 for Haemophilus influenzae, and AUC/MIC90 ratios ranged from 139 to 9303, respectively. The Cmax/MIC90 ratios in ACs ranged from 25.9 for M. pneumoniae to 1727 for H. influenzae, and AUC/MIC90 ratios ranged from 254 to 16917, respectively. The Cmax/MIC90 and AUC/MIC90 ratios provide a pharmacokinetic rationale for once-daily administration of a 1000 mg dose of levofloxacin and are favourable for the treatment of communityacquired respiratory pathogens.
S. Narasimha Murthy and coworkers28 have reported clinical pharmacokinetic and pharmacodynamic evaluation of transdermal drug delivery systems of salbutamol sulfate. Transdermal drug delivery formulation containing 5 mg/patch of salbutamol sulfate (SS), providing an input rate of 100 µg/h of SS was formulated and subjected for pharmacokinetic and pharmacodynamic evaluation in moderately asthmatic patients (n = 6). A linear correlation was observed between cumulative amount of drug diffused in vitro
and cumulative AUC0–t of serum concentration–time curve (r2 = 0.99). A steady-state serum concentration of 2.87 ± 0.1 ng/ml (per milligram dose) was attained after an initial lag period of 4.67 ± 1.03 h. The elimination half-life, clearance rate and elimination rate constant was 3.35 ± 1.07 h, 256.12 ± 3.55 ml/min and 0.24 ± 0.09 h−1, respectively. The mean forced expiratory volume in one minute (FEV1) of the patients was 2.2 ± 0.14 l during steady state. The pharmacokinetic results correlated well with the FEV1 response of patients.
18
future derivatives with a potentially higher efficacy and a more favourable safety profile. This article reviews data thus far present both on the pharmacokinetics as well as on the putative mechanisms of action of the interferon-betas, glatiramer acetate, and mitoxantrone in the immunopathogenesis of MS.
Yoshiyuki Ohno and coworkers30 have reported pharmacokinetic and pharmacodynamic analysis of systemic effect of topically applied timolol maleate ophthalmic gelling vehicle. The objective of this study was to evaluate the degree of systemic absorption and the systemic side effect after instillation of timolol maleate ophthalmic gelling vehicle in human. A volunteer study was employed, and a randomized crossover design with the two phases was used. In one phase, the volunteers instilled a single drop of the 0.5% timolol maleate ophthalmic gelling vehicle; in the other phase, the volunteers instilled a single drop of the 0.5% timolol maleate ophthalmic solution. The plasma concentration of timolol and the heart rates were studied during the following 120 min and 60 min, respectively. The area under the blood concentration time curve (AUC) in timolol maleate ophthalmic gelling vehicle was lower than that in timolol maleate ophthalmic solution (p < 0.05). No differences were observed in heart rates between ophthalmic gelling vehicle and ophthalmic solution. The correlation between the calculated occupancy of beta-adrenergic receptors and the systemic side effects after instillation could be successfully analyzed with a pharmacokinetic and pharmacodynamic model, showing the predictability of the model for the systemic side effects of timolol. The result of their analysis clearly shows that timolol maleate ophthalmic gelling vehicle reduced the systemic absorption below that of ophthalmic solution, but the degree in difference of systemic effects was negligible.
Linda S. Handerson and coworkers31 have reported pharmacokinetic and
19
heart failure, as well as the reduction of cardiovascular mortality in clinically stable post–myocardial infarction patients with left ventricular dysfunction. Carvedilol is a racemic mixture of R (+) and S (-) enantiomers that combines β1-, β2-, and alpha adrenoceptor blockade. For all indications, the immediate-release (IR) formulation of carvedilol is taken twice daily. A controlled-release (CR) formulation of carvedilol that allows once-daily dosing has recently been developed. In this double blind, parallel-group, crossover study, 122 patients with essential hypertension were randomly allocated to receive low and high doses of carvedilol or placebo. Patients received either a constant low dose (CR 20 mg once daily or IR 6.25 mg twice daily) or were titrated to a high dose (CR 80 mg once daily or IR 25 mg twice daily) before being crossed over to an equivalent dose of the alternative formulation. The pharmacokinetic (PK) and pharmacodynamic (PD) profiles were compared between patients receiving carvedilol CR and carvedilol IR. The PK profiles for R (+)- and S (-)-carvedilol for the two formulations were equivalent (based on area under the curve,
maximum plasma concentration [Cmax], and trough drug concentration).
Consistent with an extended-release formulation, carvedilol CR delayed Cmax
20
hypertension under steady-state conditions. Notably, carvedilol CR provides consistent β1-adrenergic blockade over 24 h with a once-daily dose.
Amnon Hoffmana and coworkers32 have reported pharmacokinetic and pharmacodynamic aspects of gastroretentive dosage forms. Controlled release gastroretentive dosage forms (CR-GRDF) enable prolonged and continuous input of the drug to the upper parts of the gastrointestinal (GI) tract and improve the bioavailability of medications that are characterized by a narrow absorption window. CR-GRDF provide a means to utilize all the pharmacokinetic (PK) and pharmacodynamic (PD) advantages of controlled release dosage forms for such drugs. Thus, CR-GRDF may improve therapy with clinically used medications, as well as enable oral administration of drugs, or drug candidates, that hitherto had to be infused parenterally. This manuscript discusses the complexity of the PK and PD factors that influence the treatment benefits of CR-GRDF and summarizes the results of their recent in vivo investigations in animal models (rats and dogs) and in human subjects. They found that a CR-GRDF formulation was superior to the other modes of administration for levodopa and riboflavin, but not for metformin. The PK and PD rationales of GRDFs for the studied drugs are presented and discussed. They conclude that due to the complexity of the PK and PD factors for a certain drug, the rationale for continuous administration obtained by CR-GRDF should be assessed and established in vivo.
21
measured in soft tissue of patients and healthy subjects. The simulation for patients resulted in effective killing, whereas bacterial regrowth was detected for healthy subjects. Their in vitro simulation showed that bacterial killing may be effective in severely ill patients despite relatively low concentrations of piperacillin at the target site. This finding is due to impaired renal function and subsequently prolonged tissue and plasma half-lives of piperacillin in intensive care patients.
22
Jorn Lotsch35 has reported pharmacokinetic–pharmacodynamic
modeling of opioids. The effects of opioids usually parallel the plasma concentrations but with a temporal shift. This temporal shift differs between opioids. It is small with alfentanil or remifentanil and very long with the active metabolite of morphine, morphine-6-glucuronide (M6G). The mathematical and experimental techniques for modeling these pharmacokinetic pharmacodynamic (PK/PD) relationships were developed in the late 1970s. The delay between plasma concentrations and effects is accounted for by the introduction of a hypothetic effect compartment, which is linked to the plasma compartment by a first-order transfer function with a rate constant ke0. The effects are then linked to the concentrations at effects site by standard
pharmacodynamic models such as sigmoid (“Emax”) models or power models,
depending on the actual effect measure. These principles were first applied to the opioids fentanyl and alfentanil in 1985. Since then, PK/PD of opioids have been repeatedly assessed, using EEG derived parameters, pupil size, and experimental and clinical pain as effect measures. The opioids of the fentanyl group, methadone, morphine, and piritramid, are today well characterized with respect to their PK/PD properties. Alfentanil and remifentanil are very fast equilibrating opioids with equilibration half-lives between plasma and effect site of about 1 min. They are followed by fentanyl and sufentanil, each with equilibration half-lives of about 6 min. Methadone equilibrates with a half-life of about 8 min. Morphine, in contrast, equilibrates with a half-life of 2–3 h. The slowest opioid with respect to plasma-effect site transfer is M6G, with an equilibration half-life of about 7 h. PK/PD modeling has advanced the understanding of the time course of the clinical effects of opioids after various dosing regimens. It may provide a rational basis for the selection of opioids in clinical circumstances. PK/PD modeling of opioids may also be employed for the design and the interpretation of experiments addressing clinical effects of opioids.
23
24
4. PLACE OF RESEARCH WORK
1) Research work was conducted at the Department of Pharmaceutical
Analysis, J.S.S. College of Pharmacy, Ootacamund – 643001, Tamilnadu,
India.
2) Part of Research work was conducted at ISO 9001-2000 certified
bioequivalence centre at the Centre For Advanced Drug Research And
Testing (CADRAT), J.S.S. College of Pharmacy, Ootacamund – 643001,
25
5. SCOPE AND PLAN OF WORK
PK-PD modeling has emerged as a major tool in clinical pharmacology to optimize drug use by designing rational dosage forms and dosage regimes. Quantitative representation of the dose–concentration–response relationship should provide information for prediction of the level of response to a certain level of drug dose. Several mathematical approaches can be used to describe such relationships, depending on the single dose or the steady-state measurements carried out.
The project was carried out in the following stages:
Stage I: Preformulation studies
• Determination of physical properties of the drugs such as physical nature (amorphous or crystalline), solubility, melting point, etc.
• Compatibility studies was performed by IR and DSC spectral matching approach.
Stage II: Development of oral sustained drug delivery systems
Development of matrix tablets by wet granulation formulation and characterization of granules for
• Angle of repose,
• Loose bulk density,
• Tapped bulk density,
• Compressibility index and
• Drug content.
Compression of the formulated granules into tablets and evaluation of the tablets as per the pharmacopoeial specifications for
• Average weight and weight variation,
• Thickness,
• Diameter,
• Drug content and content uniformity,
26
• In vitro drug release behavior and comparison of the release profile with the marketed conventional dosage forms and
• Optimization of certain process and formulation variables on the physicochemical properties and in vitro drug release profile of the formulated tablets.
Stage III: Stability studies as per the ICH guidelines
Selected batches from the above studies were subjected to stability studies at different temperature and humidity conditions as prescribed by the International Conference on Harmonization (ICH)37.
• 25°C with 60 % RH
• 40°C with 75 % RH
Samples were withdrawn at different time intervals and evaluated for their physicochemical parameters and in vitro drug release behavior.
Stage IV: Bioavailability study design and data handling
A randomized, two treatment, two period, two sequence, single dose, crossover bioequivalence study was conducted for the innovator conventional formulation and test modified formulation in twelve healthy, adult, male, human subjects under fasting conditions.
Stage V: Development HPLC methods for the estimation of selected drugs in plasma samples
Various chromatographic conditions such as,
• Chromatographic conditions like
• Selection of wavelength,
• Selection of initial separation conditions,
• Nature of the stationary phase,
• Nature of the mobile phase (pH, peak modifier, ratio and flow rate) and
27
Stage VI: Validating the developed method Validation parameters such as,
• Accuracy,
• Precision,
• Linearity and Range,
• Limit of detection (LOD) / Limit of quantitation (LOQ),
• Selectivity / specificity,
• Robustness / ruggedness and
• Stability and System suitability of the developed methods were validated.
Stage VII: Pharmacokinetic parameters
After estimating the selected drugs in human plasma, the following pharmacokinetic parameters were calculated and confirmed statistically.
• Cmax Maximum plasma concentration
• Tmax Time of maximum plasma concentration
• AUC0-t Area under plasma concentrations time curve 0 to 24 h
• AUC0- ∞ Area under plasma concentrations time curve 0 to ∞ h
• t 1/2 Elimination half-life and
• kel Elimination rate constant
Stage VIII: Development of PK/PD Model
28
6. MATERIALS AND METHODS 1. Reagents and Chemicals used
Acetonitrile, methanol, ortho phosphoric acid, sodium acetate, perchloric acid and triethylamine were supplied by Qualigens Fine Chemicals and S.D. Fine chemicals. Water (HPLC grade) was obtained from Milli-QR system. All the reagents and chemicals used were of HPLC or Analytical grade.
Working standards of dexibuprofen was purchased from Noven Life sciences (Hyderabad, India) and Losartan Potassium was a gift sample from Vasudha Pharma Chem Ltd (Hyderabad, India). HPMC (Methocel – K100–CR, apparent viscosity, 2% in water at 20°C is 80,000-12000 cP), xanthen and starch 1500 were gift samples from Colorcon Asia Pvt Ltd (Goa, India). Polyvinyl pyrrolidine (PVP-K-30) was a gift sample from Anshul Agencies (Mumbai, India). Aerosil was purchased from Degussa India Pvt Ltd (Mumbai, India).
1.1. Instruments used
i. Sartorius single pan digital balance (R200D & 1702)
ii. Systronics pH meter, μ pH system 361
iii. Shimadzu LC 2010A HT HPLC system with the following configurations;
• Low pressure gradient quaternary pump
• Auto injector
• Multi wavelength UV array detector
• Column oven and Degasser
• Class-VP 6.01 data station
iv. Electrolab dissolution testing apparatus
• USP Type II apparatus TDL-08L
29
vi. ShimadzuFT IR 8400S spectrophotometer
vii. Ultra Sonicator
viii. Solid phase Extractor
ix. Analytical column such as,
• Princeton SPHER HPLC C18 (250× 4.6mm, 5µ)
• Phenomenex Luna C18 (250× 4.6mm, 5µ)
• Kromasil C18 (250× 4.6mm, 5µ)
• Zorbax C8 (250× 4.6mm, 5µ)
• Hypersil C4 (250× 4.6mm, 5µ)
• Solid phase extraction cartridges used Samprep - SPE Columns C18 (50µm, 70A) 100mg/1ml
2. Experimental
This chapter describes the experimental details of the preformulation study, tablet manufacture, bio availability study design and data handling, optimization and validation of the bio analytical methods for the estimation of dexibuprofen and losartan potassium in human plasma samples, preparation of standard and sample solutions, development of in vitro dissolution methods, in vitro data analysis, in vivo data analysis, statistical analysis of pharmacokinetic data and development of pharmacokinetic-pharmacodynamic model (PK-PD).
2.1. Preformulation Study
30
2.1.1. Evaluation of Granulations
The following parameters were used for the characterization of prepared granules
(1) Flow properties
(2) Granular densities
(3) Percentage of fines
2.1.1.1. Flow Properties
The flow properties are critical for an efficient tableting operation. A good flow of the powder or granulation is necessary to assure efficient mixing and acceptable weight uniformity for the compressed tablets. In some cases, dry powder has to be pre-granulated to improve their flow properties. During the pre-formulation, the flow ability of the drug and granulation should be studied especially when the anticipated dose of the drug is large.
When a heap of powder is allowed to stand with only the gravitational force acting on it, the angle between the free surface of the static heap and the horizontal plane can achieve a certain maximum value for a given powder. This angle is defined as the static angle of repose and is a common way of explaining flow characteristics of powder granulation. In most pharmaceutical powders and granules, the angle of repose values range from 25-40°, with lower values indicating better flow characteristics.
The angle of repose is defined as the maximum angle possible between the surface of a pile of powder or granules and the horizontal plane.
Tan θ = h/r
where,
h and r are the height and radius of the powder cone
31
2.1.1.2. Bulk Density
The weighed amount of the powder was introduced into a graduated measuring cylinder. The cylinder was fixed on the bulk density apparatus and the timer knob was set for 100 tapping. The volume occupied by the powder was noted. Further, another 50 tapping may be continued and final volume was noted. This final volume is bulk volume. Bulk density is defined mathematically as given below
Bulk density = mass of powder / Bulk volume.
Bulkiness = 1 / Bulk density
2.1.1.3. Percentage of fines
Percentage of fines was determined by passing the granules through sieves 22 and 40. The particles which pass through # 40 are considered fines.
2.2. Differential Scanning Calorimeter
The possibility of drug–excipient interaction was investigated by differential scanning calorimetry. The DSC thermograms of pure drugs dexibuprofen, losartan potassium respectively, individual excipients and drug– excipient mixtures were recorded.
2.3.Compatibility studies
32
3. Tablet Manufacture
3.1.Development of Dexibuprofen Sustained Release (SR) tablets
Dexibuprofen SR tablets were prepared by the wet granulation method (Figure 1). All the composition, with the exception of magnesium stearate and aerosil were thoroughly mixed in a tumbling mixer for 5 min and wetted in a mortar with isopropyl alcohol. The wet mass was sieved (16 mesh) and granules were dried at 40°C for 16 h.The dried granules were sieved (22 mesh) and these granules were lubricated with a mixture of magnesium stearate and aerosil (2:1). The dexibuprofen tablets were prepared using an electrically operated punching machine. Compression was performed after granulation process with a single punch press applying a compression force of a 9 KN (preliminary work) or 12 KN (experimental design), equipped with a 12 mm flat-faced punch. For the preliminary work, batches of 100 tablets were prepared. Each batch of experimental design consisted of 100 tablets (drug content in the tablet was 300 mg). Three batches were prepared for each formulation and the compositions of different batches of dexibuprofen SR tablets are given in Table 1. The compressed tablets were evaluated for average weight and weight variation, thickness, diameter, drug content & content uniformity, hardness, friability, disintegration and In vitro drug release.
3.2. Development of Losartan potassium Sustained Release (SR) tablets
33
mm flat-faced punch. For the preliminary work, batches of 100 tablets were prepared. Each batch of experimental design consisted of 100 tablets (drug content in the tablet was 25 mg). Three batches were prepared for each formulation and the compositions of different batches of losartan potassium SR tablets are given in Table 2. The compressed tablets were evaluated for average weight & weight variation, thickness, diameter, drug content and content uniformity, hardness, friability, disintegration and In vitro drug release.
3.3. Evaluation of Tablets
The prepared tablets were evaluated for the following properties:
1. Thickness
2. Hardness
3. Friability
3.3.1. Hardness
The hardness of a tablet is indication of its strength. It is tested by measuring the force required to break the tablet across the diameter. The force is measured in kg and the hardness of about 4 kg is considered to be satisfactory for uncoated tablets. Monsanto hardness tester is used for this purpose. The hardness of 10 tablets was measured and the average hardness was calculated.
3.3.2. Friability Test
34
Pharmacopoeia (IP). Percentage friability was determined by using the formula given below:
% friability = (W1 - W2 / W1) × 100
where W1 = weight of tablets before test
W2 = weight of tablets after test
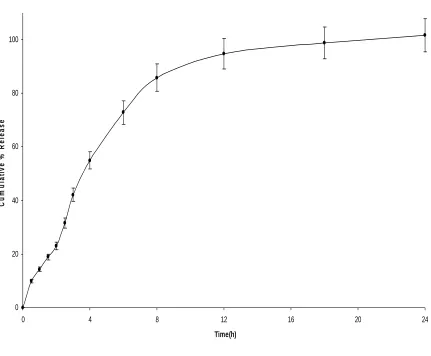
3.3.3. In vitro drug release
Dissolution was performed using an Electro lab – Tablet dissolution Tester, USP XXIII Model. The media used was phosphate buffer pH 6.8 and maintained at 37°C±0.5. Dissolution tests were performed on six tablets and the amount of drug released was analyzed by HPLC.
3.3.4. Stability studies as per the ICH guidelines
Developed SR tablets were packed in High Density Poly Ethylene (HDPE) containers and were subjected to stability studies at the following different temperature and humidity conditions as prescribed by the International Conference on Harmonization (ICH).
• 25°C with 60 % RH
• 40°C with 75 % RH
Samples were withdrawn at 1, 2, 3 and 6 months intervals and evaluated for their physical properties and in vitro drug release.
4.0. Bioavailability studies
35
A randomized, two-treatment, two-period, two-sequence, single dose, cross over bioavailability studies were carried out in healthy human volunteers between the developed sustained release (SR) formulation and the marketed conventional immediate release (IR) formulation to prove the safety and efficacy of the developed SR formulation. A reproducible analytical technique was developed for the estimation of the drugs in the plasma samples. Various pharmacokinetic parameters such as Cmax, Tmax, t1/2, kel, AUC0-t and AUC0-∞ were
estimated.
The subjects for the bioavailability study were selected from the panel of volunteers enrolled with the Centre of Bioequivalence, J.S.S. College of Pharmacy, Ootacamund. Volunteers were screened for inclusion in the study 7 days prior to the commencement of the study. Restrictions on admission into the study were based on the following safety considerations:
• Healthy males, 22-30 years of age,
• Not more than ±15 % from ideal weight for subject’s height and elbow breadth,
• General good health as determined by medical history and physical examination within 30 days prior to the start of the study (without a history of clinically significant organ - system disorders or ongoing infectious diseases, history of benign prostatic hypertrophy, prostate infections or urinary retention, history of asthma and drug allergy history of peripheral neuropathy, history of alcohol abuse or drug addiction requiringtreatment within the last 12 months),
• No prescription drugs within 14 days or Over The Counter (OTC) preparations, herbal remedies or nutritional supplements (excluding vitamins) within 7 days prior to drug administration and
36
On the basis of this preliminary screening, 24 volunteers were selected and their liver function, renal function and haematological parameters such as hemoglobin content, RBC and WBC counts, blood sugar, cholesterol, bilirubin and ECG were examined by standard clinical and biochemical investigations. No grapefruit juice or grapefruit containing products for at least 72 h and caffeine or xanthine consumption for at least 12 h prior to drug administration was allowed in each period. No concomitant medication (other than the study drug) was allowed during the study phase. Volunteers were also instructed to refrain from consuming alcohol, smoking or other stimulant drinks during this period.
Prior to the commencement of the study, each subject was provided with an information sheet giving details of the investigational drugs, procedure, potential risk involved and a written consent was obtained. They were instructed that they are free to withdraw their consent and to discontinue their participation in the study at any time without prejudice.
All the volunteers were made to assemble in the bioequivalence Centre, 12 h prior to the initiation of the study. After overnight fasting, the volunteers were given code numbers and allocated to the treatment in accordance with the randomized code. Their pulse rates and blood pressures were recorded and a sterile intravenous cannula (size 20) introduced with strict aseptic precautions for blood collection. Volunteers received either test or reference formulations (Table 3) according to their code numbers with 240 ml of water. The order of treatment administration was randomized in two sequences (AB and BA) in blocks of two.
37
starting of the analysis. A similar procedure adopting cross over design in drug treatment was repeated after 7 days of wash out period.
The study was monitored by a physician and a clinical pharmacologist. In addition, a staff nurse and a technician were present throughout the study for blood collection and plasma separation. The blood pressure and pulse rate were measured at 0.5, 1, 2, 3, 6, 12 and 24 h post dosing. The volunteers were monitored for abnormal symptoms during the study period and for one week, after the study period and if noticed, the details were entered in the case report sheets and tabulated at the end of the study.
Standard breakfast was provided after 3 h post dosing. Subjects were instructed to eat their entire breakfast in 30 min. Lunch and dinner, consisting of caffeine-free, xanthine-free, grapefruit-free foods and beverages were served after 7 and 12 h post dosing during the in house portion of the study.
Blood samples were collected using disposable syringes in pre-heparinised centrifugal tubes at different time intervals. The samples were centrifuged at 4000 rpm for 7 min to separate plasma. They were transferred into air tight containers and stored at deep freeze condition until starting of analysis. A similar procedure adopting cross over design in drug treatment was repeated after 7 days of wash out period.
The plasma samples of dexibuprofen were extracted using solid phase extraction (SPE) and the plasma samples of losartan potassium were extracted using protein precipitation. Their drug levels were quantified using HPLC techniques.
38
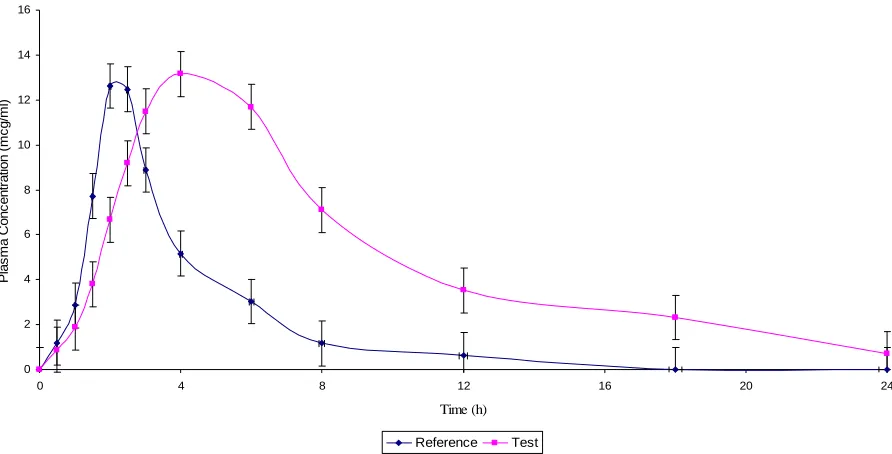
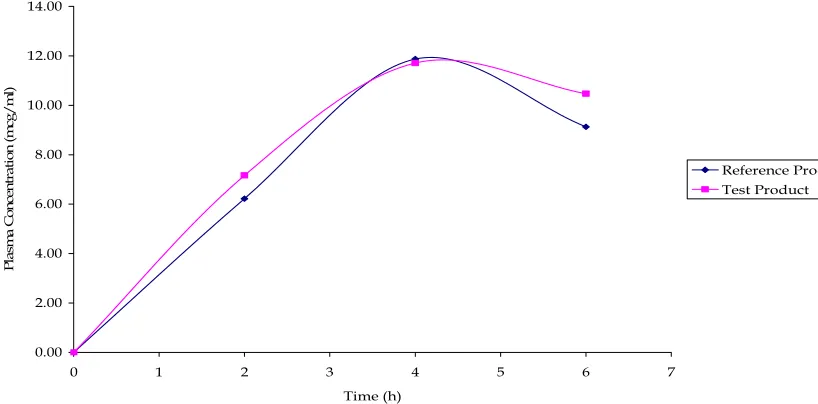
Pharmacokinetic parameters such as peak plasma concentration (Cmax), Time to peak concentration (Tmax), Area under the plasma concentration - time curve (AUC0-t & AUC0-∞), elimination rate constant (kel) and Elimination half-life
(t1/2) were calculated separately and the blood level data of the reference product and the test products were compared statistically.
5.0. Estimation of drugs
5.1. Optimization of chromatographic conditions for the estimation
Proper selection of the chromatographic method depends upon the nature of the sample (ionic or neutral molecule), its molecular weight and solubility. The drugs selected for the present study are polar in nature and hence either reverse phase or ion pair or ion exchange chromatography can be used. For the present study reverse phase HPLC methods are considered to be more suitable because they are extremely specific, linear, precise, accurate, sensitive and rapid methods.
5.1.1. Selection of detection wavelength for dexibuprofen and losartan potassium
10 µg/ml of dexibuprofen and losartan potassium were prepared, individually in solvent mixtures of methanol and water (1:1). These solutions were scanned in the UV region of 200 - 400 nm and the UV spectrums were recorded (Figures 2 and 3). From the spectra, detection wavelength 222 and 225 nm was selected for dexibuprofen and losartan potassium, respectively.
5.1.2. Initial separation conditions
39
Stationary phase : Phenomenex Luna C18 Column, (5 µ, 25 cm X 4.6 mm i.d and 5 µ, 10 cm X 4.6 mm i.d)
Mobile phase : Solvent A : 50 mM Sodium acetate buffer / 0.5% trifluoro acetic acid
Solvent B : Acetonitrile / Methanol
Solvent ratio : Gradient run, 10 to 100% Solvent B for 20 min
Flow rate : 1.0 ml/min
Sample size : 50 µl
Temperature : Room temperature of 200± 10 C
From the above gradient run, the approximate percentage of acetonitrile or methanol in the acetate buffer or trifluoro acetic acid buffer required to elute the drugs from the column was determined (Table 4). This ratio was used for subsequent isocratic separation and the chromatograms were recorded.
5.1.3. Effect of chromatographic variables
To optimize the chromatographic conditions, the effect of chromatographic variables such as mobile phase pH, solvent strength, addition of peak modifiers, flow rate, solvent ratio and the nature of stationary phase on the peak separation were studied. The resulting chromatograms were recorded and the chromatographic parameters such as capacity factor, asymmetric factor, resolution and column efficiency were calculated. The conditions that gave the best symmetry and capacity factor were selected for the estimation.
40
Dexibuprofen peak eluted with void volume at pH range 5.0 to 7.0, whereas losartan potassium well retained and symmetrical peaks were obtained. These conditions were, therefore, selected for further studies.
As peak modifier, 0.1 % triethylamine was added separately to the mobile phase to improve the peak shape. Triethylamine (0.5%) in buffer did not improve the peak retention or shape and hence 0.5% triethylamine in acetonitrile was not selected as peak modifier.
5.1.4. Nature of the stationary phase
Different reverse phase stationary phases (C4, C8 and C18) were used and the chromatograms were recorded. When C4 and C8 columns were used, the retention times of the drugs were reduced.
Based on the retention and peak shape, Princeton SPHER HPLC C18 column was selected for dexibuprofen, whereas, Phenomenox C18 reverse-phase
column was selected for losartan potassium.
Different mobile phases, namely, acetonitrile, methanol and acetate buffer were used at a flow rate of 1.0 or 0.5 ml/min. The strength of water, acetonitrile, methanol and acetate buffer in reverse phase chromatography were 0.0, 3.2, 2.6 and 4.5, respectively. For the initial separation conditions, acetonitrile was used. When acetonitrile was substituted by other solvents, the solvents to buffer ratios were calculated using solvent strength. The resulting ratios of the mobile phase were prepared and the drugs were chromatogrammed. These mobile phases gave well retained and symmetrical peaks. Methanol or acetonitrile was used as the mobile phase for further studies.
5.1.5. Selection of internal standard
41
present study was Aceclofenac and Nifedipine for Dexibuprofen and Losartan potassium, respectively. These internal standards provide well resolved and symmetrical peaks.
5.2. Optimized chromatographic conditions
Based on the above studies, the following chromatographic conditions were selected for the estimation of selected drugs in plasma samples and dissolution samples.
5.2.1. Chromatographic Conditions for Dexibuprofen
Stationary phase : Princeton SPHER C18 (250 x 4.6 mm i.d., 5μ)
Mobile Phase : Acetonitrile: 50 mM Sodium acetate buffer of pH 4.5
Mobile phase ratio : 60:40 % v/v Flow rate : 1. 0 ml/min
Sample volume : 50 μl using Rheodyne 7725i injector
Detection : 222 nm using SPD-M10A VP Diode Array Detector
Data station : Class VP data station Internal Standard : Aceclofenac
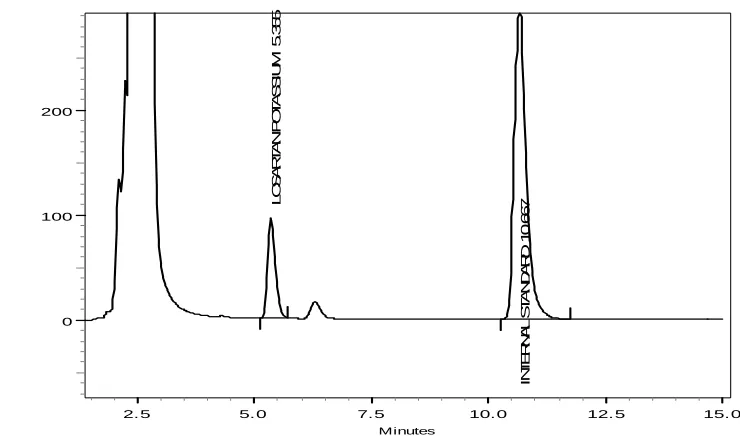
5.2.2. Chromatographic Conditions for Losartan Potassium
Stationary phase : Phenomenox C18 (250 x 4.6 mm i.d., 5μ)
Mobile Phase : Acetonitrile: 0.5% triethyl amine Mobile phase ratio : 40:60 % v/v
Flow rate : 1. 0 ml/min
Sample volume : 50μl using Rheodyne 7725i injector
Detection : 225 nm using SPD-M10A VP Diode Array Detector
42
6.0. Preparation of standard and sample solutions
6.1.Preparation of standard and sample Dexibuprofen solutions a. Standard stock solution of Dexibuprofen
10 mg of Dexibuprofen working standard was accurately weighed and transferred into a 10 ml volumetric flask and dissolved in methanol - water mixture (1:1) and made up to the volume with the same solvent to produce a 1mg/ml of dexibuprofen. The stock solution was stored in refrigerator at –20 ± 20 C until analysis.
The stock solution was diluted to suitable concentrations for spiking plasma to obtain calibration curve (CC) standards and quality control (QC) samples.
b. Calibration Curve Standards and Quality Control Samples
Working solutions for calibration and controls were prepared from the stock solution by an adequate dilution using water. Calibration standards for control plasma were prepared by spiking this stock solution to obtain the concentration levels of 0.6, 0.8, 1.8, 5.5, 7.5, 11.0 and 18.0 µg/ml in human plasma. Quality control samples were prepared as bulk, at a concentration of 0.6 µg/ml (LLOQ QC), 3.0 µg/ml (LQC), 7.5 µg/ml (MQC) and 11.0 µg/ml (HQC). These samples were stored below -50°C until use.
c. Standard stock solution of Aceclofenac (Internal Standard)
10 mg of aceclofenac internal standard was accurately weighed and transferred into a 10 ml volumetric flask, dissolved in acetonitrile - water mixture (1:1) and made up to the volume with the same solvent to produce a 1mg/ml of aceclofenac. The stock solution was stored in refrigerator at 20 ± 20 C until analysis.
43
d. Plasma samples
Calibration standards, validation QC samples and healthy volunteer plasma samples were prepared by adding 0.5 ml plasma to Eppendorf tube followed by adding 10.0 μl internal standard solution (1.0 μg/ml). All samples were mixed by vortexer for 30 s. After these procedures, Samprep SPE Column
C18 (50µm, 70Å) 100mg/1ml solid phase extraction cartridge was conditioned
with methanol, water sequentially and sample was loaded. The cartridge was washed with 2.0 ml of water. The drug and internal standard were eluted from the cartridge using 0.5ml of acetonitrile. The resulting solution was used for the analysis.
6.2. Preparation of standard and sample losartan potassium solutions a. Standard stock solution of losartan potassium
10 mg of losartan potassium working standard was accurately weighed and transferred into a 10 ml volumetric flask and dissolved in acetonitrile and water mixture (1:1) and made up to the volume with the same solvent to produce a 1mg/ml of losartan potassium. The stock solution was stored in refrigerator at –20 ± 20 C until analysis.
The stock solution was diluted to suitable concentrations for spiking plasma to obtain calibration curve (CC) standards and quality control (QC) samples.
b. Calibration Curve Standards and Quality Control Samples
Working solutions for calibration and controls were prepared from the stock solution by an adequate dilution using water. Calibration standards for control plasma were prepared by spiking this stock solution to obtain the concentration levels of 20.0, 60.0, 80.0, 101.0, 120.0, 150.0, 182.0, 300.0 ng/ml in human plasma. Quality control samples were prepared as bulk, at a concentration of 20.0 ng/ml (LLOQ QC), 101.0 ng/ml (LQC), 150.0 ng/ml (MQC) and 182.0 ng/ml (HQC).
44
c. Standard stock solution of Nifedipine (Internal Standard)
10 mg of nifidipine internal standard was accurately weighed and transferred into a 10 ml volumetric flask, dissolved in acetonitrile and water mixture (1:1) and made up to the volume with the same solvent to produce a 1 mg/ml of nifedipine. The stock solution was stored in refrigerator at –20 ± 20 C until analysis.
The stock solution was diluted to suitable concentration (100 μg/ml) with HPLC grade water, prior to use as internal standard.
d. Plasma samples
Calibration standards, validation QC samples and healthy volunteer plasma samples were prepared by adding 0.5 ml plasma to 2.0ml centrifuge tube and added 0.5 ml (10 µg/ml) of internal standard and 0.5 ml of precipitating agent (10% v/v perchloric acid) vortexed for 2 min. The resulting solution was centrifuged at 4000 rpm for 7 min. The supernatant layer was separated and estimated by HPLC.
7.0. Validation of HPLC methods
Validation is a process which involves confirmation or establishment by laboratory studies that a method / procedure / system / analyst can give the required accuracy, precision, sensitivity, ruggedness, etc. In the most basic form, validation of an analytical procedure demonstrates that the procedure developed is suitable for its intended purpose. Validation of the method was carried out after the development of the HPLC methods.
Validation parameters tested were,
1. Selectivity/ Specificity 2. Sensitivity
3. Linearity
4. Precision and Accuracy
45
c. Between batch / Inter-day precision and accuracy 5. Stabilities
a. Short Term Stock Dilution Stability
b. Long Term Stock Solution Stability c. Freeze Thaw Stability
d. Bench Top (BT) Stability e. Long-Term (LT) Stability f. Autosampler Stability 6. Recovery
7. Ruggedness 8. Robustness
7.1. Selectivity/ Specificity
A method is said to be specific when it produces a response only for a single analyte. Method selectivity is the ability of the method to produce a response for the analyte in the presence of other interferences. In order to prove that the method chosen was specific and selective the following two sets of samples were processed and injected into the HPLC using the extraction procedure.
1. Blank samples from six different lots of biological matrix (plasma containing K2 EDTA as anticoagulant).
2. Samples from the same six lots of biological matrix mentioned in step 1 spiked with the analyte at the lower limit of quantification (LLOQ) of the calibration curve and with the internal standard at the
concentration level in the study.
To calculate % interference, the response obtained for each sample in step 1 was compared with the response obtained for each corresponding sample in step 2.
46
7.2. Sensitivity
It is expressed as limit of quantitation. It is the lowest amount of analyte in a sample matrix that can be determined.
The lower limit of quantification for dexibuprofen was 0.6 µg/ml and losartan potassium was 20.0 ng/ml.
7.3. Linearity
Linearity and range of the methods were analyzed by preparing calibration curves using different concentrations of the standard solution containing the internal standard. The calibration curve was plotted using response factor and concentration of the standard solutions.
Linearity was established using four calibration curves over the range of (0.6 to 18.0 µg/ml for dexibuprofen, 20.0 to 300.0 ng/ml for losartan potassium) using the weighted least square regression analysis.
A calibration curve consisted of
• Aqueous standard at middle concentration level to check retention time of analyte and internal standard.
• Blank sample (matrix sample processed without internal standard and analyte)
• Zero sample (matrix sample processed with internal standard but without analyte)
• Eight non-zero standards covering the expected range. The lowest and highest standards were prepared in duplicates.
7.4. Precision and Accuracy
47
Precision
Precision is expressed as the percentage coefficient of variation (%CV) which is calculated as per the following expression:
% CV = (Standard Deviation /Mean) x 100 Intra-run Precision
Intra-run precision was determined by calculating the percentage coefficient of variation (% CV) of the results obtained in the same run.
Intra-day Precision
Intra-day precision was determined by calculating the percentage coefficient of variation (% CV) of the results obtained in the same day.
Inter-day Precision
Inter-day precision was determined by calculating the percentage coefficient of variation (% CV) of the results obtained over at least two days.
Accuracy
Accuracy is reported as % nominal of the analyzed concentration which is calculated as:
% Nominal = (Measured Concentration /Actual Concentration) x 100 Intra-run Accuracy
Intra-run accuracy was determined by calculating the percentage nominal of the calculated concentration from the actual values for quality control samples at each concentration level analyzed in a single run and the mean of percentage nominal at each level was reported.
Intra-day Accuracy
48
Inter-day Accuracy
Inter-day accuracy was determined by calculating the percentage nominal of the calculated concentration from the actual value for quality control samples at each concentration level analyzed over at least two days and the mean of percentage nominal at each level was reported.
7.5. Stock Solution Stability
7.5.1. Short Term Stock Dilution Stability
The stability of stock dilutions of analyte and the internal standard was evaluated at room temperature. Aqueous stock dilution of the analyte and the internal standard were prepared. One portion of the stock dilution was placed in the refrigerator between 2-8°C, while the other portion was placed at room temperature for 24 h. Stock dilution stored at room temperature (stability samples) was compared with refrigerated stock dilutions considered as ‘comparison samples’. Six replicate injections of the above solutions were made. Acceptance Criteria: % stability should be within 90 to 110% or the % change should be ± 10%.
% Stability = (Mean response of stability samples / Mean response of comparison samples) × 100
% Change = 100 – (Mean response of stability samples / Mean response of comparison samples × 100)
7.5.2. Long Term Stock Solution Stability
49
correction factor to nullify the difference between the measured weights or the dilutions made.
Correlation factor (CF) = Concentration of comparison stock / Concentration of stability stock
% Stability = (Mean response of stability samples / Mean response of comparison samples) × CF x 100
% Change = 100 – (Mean response of stability samples / Mean response of comparison samples) × CF × 100
7.5.3. Freeze Thaw Stability
This test was done to ensure that the analyte was stable in the biological matrix even after multiple freeze-thaw cycles.
1. Six quality control samples each at low and high concentrations stored below –50°C for at least 24 h were removed from the deep freezer and were allowed to thaw unassisted at room temperature (fT4 samples). These samples were frozen again below –50°C for at least 12 h.
2. Another set of six quality control samples at low and high concentration levels (fT3 samples) were removed from the deep freezer along with the fT4 samples and thawed unassisted. Both sets of samples were replaced back into the deep freezer.
3. At least after 12 h of freezing, fT4, fT3 and another set of six samples each at low and high concentration levels (fT2 samples) were removed from the deep freezer and thawed unassisted. All the samples were replaced back into the deep freezer.