Evaluation of the adequacy of ventilation
with low and conventional tidal volumes in
overweight and obese adults with normal
respiratory function undergoing elective
general surgical procedures - a prospective,
single-blinded, randomized controlled
study.
This Dissertation is in partial fulfillment of the requirement for the M.D. Degree
(Branch X) Anaesthesiology Examination of The Tamil Nadu Dr. M. G. R.
C E R T I F I C A T E
This is to certify that the dissertation entitled
‘Evaluation of the
adequacy of
ventilation with low and conventional tidal volumes in overweight or obese
patients undergoing elective general surgical procedures - a prospective,
single-blinded, randomized controlled study.’
is the bonafide original work
of Dr. Justin P. James, towards the M.D. Branch-X (Anaesthesiology) Degree
Examination of the Tamil Nadu Dr. M.G.R University, Chennai, to be
conducted in April 2011
.
Signature of the Guide & H.O.D
Dr. Sarah Ninan Professor and Head Department of Anaesthesia Christian Medical College, Vellore - 632004.
ACKNOWLEDGEMENTS
• I would like to express my sincere gratitude to my guide, Dr. Sarah Ninan, Professor
and Head of the Department of Anaesthesiology, for her meticulous guidance,
immense patience, and valuable suggestions while guiding me through this vital
period of life. Indeed, without her ideas, help and support, this effort would never
have seen the light of day.
• I would like to thank my co-guide Dr. Kunder Samuel Prakash, Assistant Professor
in the Department of Anaesthesiology, for all his ideas, suggestions, encouragement
and help. Without him, half the work would have taken double the time.
• I am grateful to the entire Department of Anaesthesiology, including faculty,
colleagues, and technicians, for all the support rendered in preparing this
dissertation.
• I am also thankful to the Department of General Surgery (for graciously allowing
access to their patients), and Department of Cardiothoracic Surgery (for kindly
allowing the use of their blood gas analyser) for their invaluable help in carrying out
• I extend my thanks to Mr. Prasanna Samuel and Mr. Velu Vasanth from the
Department of Biostatistics, for their help with the statistical analysis.
• I wish to thank all my patients for their co-operation in this study.
• I would like to thank my wife, Ms. Ranjitha Chacko, for love, encouragement,
persistence, and countless cups of coffee.
• I would finally like to thank God Almighty, who has brought me safely this far, and
will surely lead me onward.
CONTENTS
Page
Number
1.
Aim
6
2.
Objectives
7
3.
Introduction
8
4.
Review of Literature
10
5.
Methodology
31
6.
Results
38
7.
Discussion
58
8.
Limitations
65
9.
Conclusions
66
10.
Bibliography
68
AIM
The aim of this study is to evaluate and compare the adequacy of ventilation with two
different tidal volumes (6mL/kg and 10 mL/kg of ideal body weight) in overweight and obese
adults undergoing general surgical procedures under general anaesthesia with endotracheal
intubation and intermittent positive pressure ventilation (I.P.P.V.).
OBJECTIVES
1. To evaluate the adequacy of ventilation (as evidenced by continuous End-Tidal
Carbon Dioxide -ETCO2- monitoring) with two different tidal volumes (6 mL/kg and
10 mL/kg of ideal body weight) in overweight and obese adults undergoing general
surgical procedures under general anaesthesia with endotracheal intubation and
intermittent positive pressure ventilation.
2. To evaluate the occurrence of ventilation-perfusion mismatch (widening of the
PAO2-PaO2 gradient, decrease in the PAO2-PaO2/FiO2 ratio and widening of PaCO2-ETCO2
gradient) with two different tidal volumes (6 mL/kg and 10 mL/kg of ideal body
weight) in overweight and obese adults undergoing general surgical procedures under
general anaesthesia with endotracheal intubation and intermittent positive pressure
ventilation.
INTRODUCTION
A large number of surgeries are performed everyday under general anaesthesia with
controlled ventilation. The use of general anaesthesia with controlled ventilation has allowed
the performance of more and more complex surgical procedures for longer and longer
durations. However, this is not without risk. In fact, post-operative respiratory complications
form a significant proportion of the post-operative morbidity even after non-thoracic
surgery(1)(2). Further, the incidence of post-operative pulmonary complications is more in
overweight and obese individuals(2)(3)(4). This has significant implications for anaesthetic
practice.
Can improvements in intra-operative ventilatory strategies improve the post-operative
outcome? This question has been of interest to researchers for the past several decades. While
volume-control ventilation is probably the commonest utilized mode of controlled
ventilation, the ideal tidal volume is still a matter of debate. Healthy human lungs seem able
to tolerate a wide range of tidal volumes for varying lengths of time. However, there may be
subtle changes that, while not manifesting in the intra-operative period, may cause significant
post-operative problems.
The issue is further confused by the fact that patients with compromised lung function
require different ventilation strategies, which while appearing attractive, may not actually be
Traditionally, normal tidal volume has been taught as being around 10 mL/kg of the
body weight. However, several studies have been done with smaller and larger tidal volumes.
Of late, there has been increased interest in the use of lower tidal volumes, perhaps because
of fears of barotrauma to lungs subjected to higher tidal volumes. This issue is more
significant in overweight or obese individuals where normal tidal volumes (based on actual
body weight) may actually be higher tidal volumes (based on ideal body weight)
In the study, we have evaluated the use of low (6 mL/kg of ideal body weight) and
conventional (10 mL/kg of ideal body weight) tidal volumes in overweight and obese patients
without respiratory illnesses. It has been our attempt to determine the adequacy of these two
ventilatory strategies as reflected by the monitoring of end-tidal carbon dioxide levels and
arterial blood gas indices of oxygenation.
REVIEW OF LITERATURE
The review of literature is divided into the following topics:
A. History of mechanical ventilation
B. Relevance of I.P.P.V. in anaesthesia
C. Lung volumes
D. Effect of General Anaesthesia on Lung Volumes
E. Controlled Ventilation under Anaesthesia
F. Studies comparing Tidal Volumes
G. Atelectasis under Anaesthesia
H. Obesity, Lung Volumes and Anaesthesia
A. HISTORY
The Evolving Understanding of Respiration through the Ages(5)
Even a person without any scientific background intuitively recognizes the necessity of
breathing- by its constancy and regularity, by the distress caused by obstructed breathing
(whether by asthma or foreign body), or simply by the strong instinct to breath when we try
to hold our breath for as long as possible. In that sense, everyone knows the inseparable link
between breath and life, but the physiology behind it is complex, and it is enlightening as
well as entertaining to learn of how the human race grew in its understanding of this process.
Early Greco-Roman Era
The early understanding of respiration was innately linked to the understanding of
circulation. The ancient Greeks, including Galen and Aristotle, believed that the heart was
like an engine that distributed energy (as innate heat) to the body and that the lungs
functioned to cool the heart by the constant passage of air. The anatomical relationships of
the lungs, pulmonary circulation, systemic circulation, and heart were not well understood. In
the second century A.D., Galen was arguably the most influential physician in Greco-Roman
culture. He advanced their understanding of respiration a little further by suggesting that air
was carried by blood to all tissues, and that blood carried wastes to the lungs to be discharged
into the atmosphere.
Renaissance Era Physicians
There was little advancement in this field of knowledge from Galen's times till the 15th and
16th century. Interest in anatomy was triggered by Renaissance artists like Leonardo da Vinci
who strived for accuracy in their artistic depictions. This interest was carried forward by
colour during passage through the lungs and that this was the result of mixture of blood with
inspired air and the removal of 'sooty vapours'. In the early 17th century, William Harvey,
who is famous for elucidating the circular nature of blood flow, suggested as a direct result of
his findings, that blood must traverse the lung tissue through tiny channels. Marcello
Malpighi then provided the next link in the chain of discovery around 1650 using
microscopes to study tissues. He explained that air passes into microscopic sacs in the lung
but does not physically come into contact with blood which travels through capillaries
connecting arteries and veins. The final piece of the puzzle was put in place by a contribution
from the field of physical chemistry when the process of diffusion of air across membranes
was described.
Chemists and Physiologists
The 17th and 18th centuries also saw the development of understanding that air was composed
of different gases with differing properties. Specifically, they determined the existence
carbon dioxide that was found in exhaled air and would not support combustion or life, and
oxygen that would support both. The work of many scientists, including Antoine Lavoisier
and Robert Boyle, proved that life processes required the utilization of oxygen for reactions
similar to combustion (and the resultant production of carbon dioxide) in the peripheral
tissues. In the first half of the 19th century, devices were invented for measuring the content
of oxygen and carbon dioxide in blood- the precursors of our modern blood gas analysers.
However, it wasn't until the second half of the 20th century that practical electrodes were
developed for measuring oxygen and carbon dioxide tensions in solutions. The significance
of pH wasn't widely accepted till the work of Bjorn Ibsen during the Polio epidemic in
Copenhagen in 1952 relating respiratory insufficiency, hypercapnia and acidosis. As a result
of all these developments, the first commercial blood gas analyser measuring pH, PaO2 and
History of Endotracheal Intubation and Mechanical Ventilation(5)(6)
Galen
The history of intubation and ventilation also starts with Galen. He first demonstrated that it
was possible to inflate a dead animal's lungs by passing a reed into the trachea and blowing
air through it. Of course, he did not know what the purpose of ventilation was, and his
knowledge of the topic extended no further. During his work on dissection of animals, he
found that the animal would die shortly after their chest cavity was opened, preventing him
from observing the beating heart in action.
Vesalius and Vivisection
Almost one and a half millennia later, Andreas Vesalius, the father of anatomy, faced the
same problem. He too chanced upon the technique of blowing air into the animal's lungs with
a reed placed in the trachea. But his work went further, because he noticed that when he
performed this manoeuvre on animals whose heart had almost stopped beating after a
thoracotomy, their heart would start beating again. In 1664, Robert Hooke later showed that
an animal's heart could be kept beating for over an hour by this technique. His colleague,
Richard Lower, further demonstrated that on ventilating the lungs, blood would retain its
bright red colour instead of taking on a darker blue shade. Though this method of keeping
animals alive proved very helpful to the field of animal vivisection, its use in human beings
was not to be for over another hundred years.
Advent of Positive-Pressure Ventilation
In the middle of the 18th century, the first attempts at revival of drowning victims were
recorded. These attempts included mouth-to-mouth resuscitation. Soon, this advanced to the
the formation of, and were later encouraged by, the Royal Humane Society. However,
positive-pressure ventilation soon recieved a severe setback. In 1827, J. Leroy conducted a
series of dramatic experiments where he caused fatal pneumothorax in animals by
overzealous positive-pressure ventilation. Without knowledge of the high airway pressures
attained in the experiment, positive-pressure ventilation came into disrepute and was soon
condemned and abandoned in patients. However, it continued to be popular in the laboratory
for animal experiments. For almost the next hundred years, medical science would meander
through the use of negative-pressure ventilation.
Negative-Pressure Ventilators
Negative-pressure ventilators, including the famous Iron-Lung, came to be used very widely
in various conditions associated with respiratory insufficiency, most notably polio-induced
respiratory paralysis. Doubtless, they saved many lives. However, they were very large and
cumbersome (metal chambers covering the trunk or entire body) and made nursing care and
surgical interventions very difficult. In fact, to facilitate surgery, some negative-pressure
ventilators were made as large as a room, allowing the surgeon to stand inside. Only the
patient's head would be outside the room to allow the pressure difference to enable airflow.
Re-emergence of Positive-Pressure Ventilation
By the end of the 19th century, various surgical procedures were being performed under
anaesthesia with the widespread use of inhalational agents. Ether and Chloroform were
delivered by dropping onto a gauze piece placed over an ether mask (Open Drop method) and
the vapours were inhaled by the spontaneously-breathing patient. While this method was
adequate for most peripheral procedures, and upper abdominal procedures were merely
difficult due to the irregular movement of patient breathing, intra-thoracic procedures were
Opening the thoracic cavity resulted in a loss of negative intra-pleural pressure on the
same side and a consequent collapse of the ipsilateral lung. The term “Pendelluft” was used
to describe the to-and-fro movement of air between the two lungs with paradoxical motion of
the collapsed lung. This situation was not physiologically sustainable and would rapidly
degenerate to hypoxic arrest- the same problem encountered by Galen and Vesalius centuries
before. Thus, intra-thoracic surgeries were limited to extremely short procedures, and the
mortality associated with thoracic surgery was very high. It was obvious that the solution lay
in ventilating the lungs effectively. Two methods were suggested- negative-pressure
ventilation with the body inside a negative-pressure chamber, and positive-pressure
ventilation with the head inside a positive-pressure box. What's interesting to note is that
neither method involved intubation of the trachea. This was because, at the turn of the 20th
century, intubation for intra-operative management was still viewed with scepticism.
Actually, airway control had been in use already for several years. Snow, in 1858, had
anesthetized rabbits with Chloroform via a tracheostomy tube. Trendelenburg had devised a
cuffed tracheostomy tube for use in patients undergoing oral and laryngeal surgeries. This
prevented aspiration of blood and tissue debris, and necessitated administration of
inhalational agents through the tracheostomy tube. In 1880, MacEwen developed an uncuffed
metal oro-tracheal tube for upper airway obstruction. Within a few years, Joseph O'Dwyer, a
paediatrician also devised an uncuffed metal oro-tracheal tube to treat children with
Diphtheric airway obstruction. A surgeon named Fell had invented a bellows system for
positive-pressure ventilation. Fell and O'Dwyer combined their inventions to produce the
Fell-O'Dwyer apparatus which they used to ventilate apnoeic drug-overdose patients. As
early as the turn of the century, Matas used the Fell-O'Dwyer apparatus for thoracic surgery.
obviously too invasive for elective procedures, uncuffed oro-tracheal tubes did not solve the
problem of aspiration, and most of the intubations described till date had been “blind” ones.
The next three decades saw the development of practical laryngoscopes (Kirstein,
Jackson) and cuffed endotracheal tubes (Dorrance, Guedel). By 1934, Guedel and Treweek
showed that hyperventilating a patient and deep plane of anaesthesia resulted in apnoea so
that ventilation could be controlled by manual bag ventilation and provide a quiet surgical
field. Despite all these developments, endotracheal intubation and controlled ventilation were
not widely accepted till the advent of non-depolarizing muscle relaxants in the 1940s.
Mechanical ventilators had been devised in the first half of the 20th century for use in
apnoeic patients. Devices for providing intermittent positive pressure ventilation (I.P.P.V.)
were also developed for military purposes and later introduced to the medical field. During
the polio epidemic in Copenhagen in 1952, Bjorn Ibsen, an anaesthesiologist, conclusively
showed that ventilation could dramatically reduce mortality. With the number of
negative-pressure ventilators available being grossly inadequate for the number of patients, Ibsen
turned to manual bag (positive-pressure) ventilation. It is estimated that as many as 1500
medical and dental students were recruited to provide round-the-clock bag ventilation to these
patients. The Copenhagen epidemic fuelled interest in the development of mechanical
positive-pressure ventilators and also in the development of I.C.U.s (intensive care units)
where sick patients requiring mechanical ventilation could be grouped together and cared for
B. RELEVANCE OF I.P.P.V. IN ANAESTHESIA
Endo-tracheal intubation and mechanical ventilation is just one of many modes of respiratory
management under general anaesthesia. The other modes of management include:
1. Supplementary oxygen via face mask during Total Intra-Venous Anaesthesia
(T.I.V.A.);
2. Mask-holding with spontaneous inhalation of anaesthetic;
3. Bag-mask ventilation with/ without paralysis;
4. Supra-glottic airway device used with spontaneous respiration;
5. Supra-glottic airway device used with controlled/ assisted ventilation;
6. Endo-tracheal intubation with spontaneous ventilation.
Endo-tracheal intubation and controlled ventilation offer several advantages during the
peri-operative period. Some of these are:
1. Protection of lung from aspiration;
2. Prevention of patient movement;
3. Reduces patient effort;
4. Adjustment of ventilator settings to manipulate carbon dioxide levels in the blood;
5. Allows use of lighter planes of anaesthesia due to concomitant use of muscle
relaxants.
For these and other reasons, controlled ventilation with an endotracheal tube is preferred for a
large variety of situations under general anaesthesia including:
2. Patients with respiratory distress or insufficiency;
3. Patients with poor lung compliance;
4. Patients with haemodynamic instability;
5. Long-duration procedures;
6. Situations where aspiration of extraneous material into the airway is a concern;
7. Procedures where lack of patient movement is essential / preferable;
8. Most laparoscopic, upper abdominal, intra-thoracic, intra-cranial and airway surgery.
However, there are disadvantages to the technique when compared with other technique of
respiratory management under general anaesthesia. These include:
1. Greater haemodynamic alterations during insertion and removal;
2. More likelihood of trauma to airway structures;
3. Needs use of muscle relaxant to prevent ventilator-patient dys-synchrony;
4. Possibility of barotrauma.
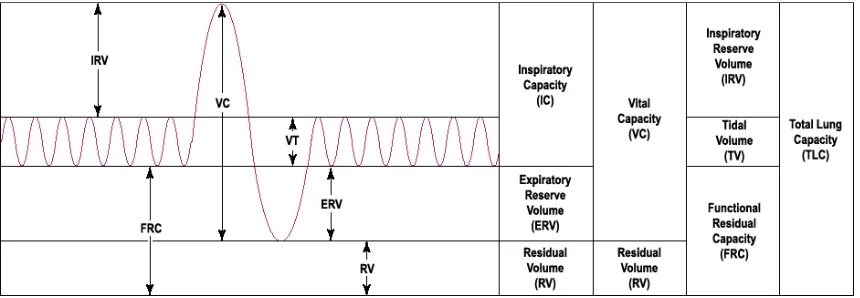
C. LUNG VOLUMES(7)(8)
The various lung volumes are shown in Fig. 1. The various volumes and capacities are about
20-25 % smaller for women than for men of the same age, and larger for taller and more
athletic people than for shorter or less athletic people of the same age. They are as follows:
• Tidal Volume: The volume of air breathed in or out during quiet breathing. It has been
measured as being 6-8 mL/kg or about 500 mL in an adult male.
• Inspiratory Reserve Volume: The volume of air inspired in addition to the tidal
volume on making maximum effort after a tidal expiration. It is about 3000 mL in a
FIG. 1: NORMAL LUNG VOLUMES.
• Inspiratory Capacity: The sum of tidal volume and inspiratory reserve volume is
normally around 3.5 litres.
• Expiratory Reserve Volume: The volume of air exhaled in addition to the tidal
volume on maximum effort after a tidal inspiration. It is about 1100 mL in an adult
male
• Vital Capacity: The maximum volume that can be inhaled after a maximal exhalation
or the maximal volume that can be exhaled after a maximal inspiration. It is the sum
of tidal, inspiratory reserve, and expiratory reserve volumes and measures about
60-70 mL/kg or 4600 mL in an adult male.
• Residual Volume: Volume of air remaining in the lungs after a maximal exhalation. It
is about 1200 mL in a normal adult male.
• Functional Residual Capacity: It is the volume of air remaining in the lungs at the end
of a tidal exhalation and is the sum of residual and expiratory reserve volume. It is
• Total Lung Capacity: It is the maximum volume to which the lungs can be inflated by
a person’s own effort. It is the sum of vital capacity and residual volume and is
around 5.8 litres in an adult male.
D. EFFECT OF GENERAL ANAESTHESIA ON LUNG VOLUMES(9)
General anaesthesia invariably results in a reduction in the Functional Residual Capacity
(F.R.C.). This is in addition to the reduction in F.R.C. seen on changing from erect to supine
position. This is probably caused by loss of skeletal muscle tone affecting the respiratory
muscles resulting in a cranial shifting of the diaphragm’s resting position and also a decrease
in the transverse thoracic area. The average reduction is about 20% of the awake F.R.C. This
reduction occurs at induction and does not increase with muscle paralysis and controlled
ventilation.
E. CONTROLLED VENTILATION UNDER ANAESTHESIA
Controlled ventilation is utilized very commonly under general anaesthesia due to the many
advantages mentioned earlier. Ventilators attached to the latest anaesthesia workstations are
very advanced and allow various modes of ventilation. However, the earliest ventilators were
stand-alone devices which often had only volume-control mode of ventilation. Even today,
simple volume-control ventilators are probably the most commonly used ventilators,
especially where finances are not plentiful. Indeed, the simplest modes, volume-control and
pressure-control, are more than adequate for most patients undergoing most surgical
procedures. Thus, for reasons of availability, economy, familiarity, and adequacy,
F. STUDIES COMPARING TIDAL VOLUMES
Traditionally, tidal volumes of 10 mL/kg or more have been used during controlled
ventilation(7)(10)(11)(12)(13)(14)(15). A significant proportion of patients receiving
controlled ventilation are those with lung injury due to various reasons. Growing suspicion
that controlled ventilation worsens pre-existing lung injury lead to experimentation with
ventilatory parameters including tidal volume. A number of studies compared lower tidal
volumes, usually around 6-7 mL/kg, with conventional tidal volumes of 10 mL/kg(16) in
patients fulfilling the criteria(17) for acute lung injury (A.L.I.) or acute respiratory distress
syndrome (A.R.D.S.) or at high risk for the same. While these studies produced inconclusive
results showing no difference in major outcome variables, there was nonetheless, a growing
interest in limiting tidal volumes to reduce damage caused by overdistention. This was even
recommended by a consensus conference in 1993(18).
In May 2000, the New England Journal of Medicine published the landmark
study(19) of the Acute Respiratory Distress Syndrome Network (ARDSNet) which showed
that lower tidal volumes decreased mortality and duration of mechanical ventilation in
patients with A.L.I. and A.R.D.S(19)(20). The issue is far from settled and various
subsequent publications have questioned the validity of the conclusions drawn from this
study(11). It has been suggested that the main difference in intervention that reduces
mortality is not a specific tidal volume, but the limitation of plateau pressures(16).
Nonetheless, it cannot be denied that the article in question has had a significant
impact on ventilatory practices throughout the world. There has been a change in practice in
ventilation strategies being followed in intensive care units, where a significant proportion of
patients have compromised lung function(21)(22). Such practices are extending into the
anaesthesia. However, it must not be forgotten that most patients we come across in the field
of anaesthesiology have normal lung function, in contrast to most patients requiring
ventilation in an intensive care unit. The effect of lower tidal volumes on patients with
normal lung function is unclear. There is no real evidence that such a practice may be
beneficial in patients with normal respiratory function. Further, it should be noted that the
ARDSNet study(19) was performed using P.E.E.P. (Positive End-Expiratory Pressure).
Indeed, most patients with pre-existing lung-injury are ventilated with, and do better with, the
use of P.E.E.P., sometimes at very high levels. However, the use of P.E.E.P. in patients with
normal respiratory function undergoing anaesthesia is uncommon, mostly because it is
considered unnecessary(23) and is not without adverse effects(9).
Visick et al(24) and Tweed et al(25) have advocated the use of larger tidal volumes in
patients with no pre-existing lung injury. More recently, however, Cai et al(26) have
suggested that low tidal volumes are no different from conventional tidal volumes and
Wolthuis et al(27) have suggested that the use of low tidal volumes may even be protective
for normal lungs.
Some studies comparing low and high tidal volumes have used tidal volumes that
would today be considered unphysiological. For example, Caruso et al(28) compared tidal
volumes of 6 mL/kg and 24 mL/kg while Bardoczky et al(29) compared tidal volumes of 13
mL/kg to 22 mL/kg. Since such volumes are extremely unlikely to be used in clinical
practice, the significance of such studies to the topic in question is put in doubt.
Studies comparing different tidal volumes have used various parameters to determine
harm or benefit. These include arterial blood gas analysis(30)(31), computed tomography
(C.T. scan)(30)(32), and evidence of inflammation(33)(34)(28)(27). Arterial blood gas
used to measure the volume of atelectasis developing in the lungs, and evidence of
inflammation is gathered by histological examination of lung tissue and comparing local
(pulmonary) and systemic levels of various endogenous mediators of inflammation like
Interleukins and cytokines.
G. ATELECTASIS UNDER ANAESTHESIA(35)(9)
Atelectasis is defined as collapse of lung tissue affecting all or part of the lung. Three
different mechanisms(36)(37) have been proposed that may cause or contribute to atelectasis.
These mechanisms are applicable under anaesthesia also.
1. Compression Atelectasis: occurs when the transmural pressure reduces to such a level
that it is unable to prevent the tendency of the alveoli to collapse. Under anaesthesia,
this is mostly due to decreased diaphragmatic tone and cephalad displacement of the
diaphragm. Other contributing factors include change in the chest wall geometry and
pooling of peripheral blood in the abdominal cavity pushing the diaphragm further up.
2. Resorption Atelecatsis: (Gas Atelectasis) occurs by two mechanisms. First, when
smaller airways leading to alveolar units are closed, the gas trapped in the alveoli
gradually gets absorbed by the blood. With no new gas entering the alveoli, they
collapse. Second, in alveolar units where the FiO2 is high and the V/Q
(ventilation-perfusion) ratio is low, uptake of gas into the bloodstream is faster than entry of new
gas into the alveoli causing a progressive depletion of alveolar volume and finally,
collapse.
3. Surfactant Impairment: Surfactant is chiefly composed of phospholipids. It coats the
FIG 2: MECHANISMS OF ATELECTASIS UNDER ANAESTHESIA(37)
of the alveoli. Impaired surfactant formation or function can lead to atelectasis. It has been
shown that anaesthesia impairs surfactant function.
All three mechanisms may be operational and contributory to the atelectasis seen in
the peri-operative setting. This is summarized in Fig 2. Atelectasis was first described in the Compression Resorption Impaired Surfactant Function A T E L E C T A S I S
General Anaesthesia
Duration of Surgery
Procedure (e.g. thoracic,
upper abdominal, use of
packing & retraction)
Position
Age
Body Habitus
Lung Disease
Increased FiO2
Low V/Q Ratio
Anaesthetic Agents
Duration of Surgery
peri-operative setting in 1928 by Lee et al(38) who described it as a post-operative
complication. In 1963, Bendixen et al(39) noticed a progressive decline in compliance of the
respiratory system as well as in PaO2 under anaesthesia and suggested that it was due to
atelectasis. In 1985, Brismar et al(40), studying CT (Computerized Tomography) changes in
lung tissue under anaesthesia, noted that within five minutes of induction, areas of increased
density appeared in the dependant regions of the lungs. They suggested that the densities
(from -100 to +100 Hounsfield units) represented atelectasis(32).
Further investigation has borne out their theory and today, it is known that nearly 90%
of all patients develop some amount of atelectasis under anaesthesia(32)(35). It is also known
that the amount of atelectasis increases with the use of low tidal volume ventilation(41), use
of higher FiO2(42), and in obese patients(43)(4). Atelectasis causes an increase in the
ventilation-perfusion mismatch. Specifically, it causes an increase in shunt(36)(37) which is a
situation where blood flow occurs through pulmonary capillaries without gas flow in the
corresponding alveolar units. The gas-exchange impairment has been correlated with the
degree of atelectasis(30)(35)(43)(44), and even a mathematical relationship has been
suggested:
Shunt = (0.8 × Atelectasis) + 1.7 (9)(45)
Where: Shunt- expressed as percentage of cardiac output; and
Atelectasis- expressed as percentage of lung area.
This atelectasis can reasonably be expected to raise the alveolar-arterial oxygen
gradient and arterial oxygen-inspired oxygen ratio(46), and possibly the arterial- end-tidal
carbon dioxide gradient. These changes can be easily detected by an arterial blood gas
Atelectasis is related to post-operative pulmonary complications(47)(48) as a cause of
hypoxaemia(35)(36) and as a focus of infection(49). The respiratory system is the source of
most post-operative complications following non-cardiac surgery(1) and these can be
attributed, to at least some extent, to atelectasis(36). Post-operative pulmonary complications
(incidence about 4% of elective surgery(50)) have a significant impact on morbidity,
mortality, duration of hospital stay, and cost of health care(35)(47)(2). Also, these
complications are more likely in obese patients(36)(51).
Several methods have been described to prevent or treat atelectasis(9)(36)(37). Some
of these are:
1. Use of P.E.E.P.: has been shown to reduce the amount of atelectasis, although it
does not eliminate it completely. However, this method is not ideal for several
reasons. P.E.E.P. has its own problems. It increases dead-space ventilation, and it
reduces venous return and thus, the cardiac output. Further, the recruited lung
units collapse almost immediately on cessation of P.E.E.P.
2. Maintenance of Muscle Tone: prevents atelectasis. Ketamine, which does not
impair muscle tone, does not lead to formation of atelectasis as long as muscle
relaxants are not used. Phrenic nerve stimulation, to maintain diaphragmatic
muscle tone, has also been shown to reduce atelectasis.
3. Use of lower FiO2: High FiO2 is often used in the beginning of anaesthesia to
provide a safety margin in case of a difficult airway. This has been shown to
increase the amount of atelectasis. Use of lower FiO2 during anaesthesia may be
recommended.
4. Recruitment Manoeuvres: Inflating lungs to 40 cm H2O and maintaining the
inflation for 7-8 seconds(36) re-opens collapsed lung units. This, however, can
Interestingly, the first methods used to prevent or reduce the formation of atelectasis
under anaesthesia were the use of larger tidal volumes(7) (which is why conventional tidal
volumes during mechanical ventilation are 10 mL/kg body weight even though resting awake
spontaneous tidal volumes in normal adults is 6-8 mL/kg body weight) and the “Sigh” button
on older mechanical ventilators, which delivered a larger tidal volume over a longer period of
time (than the ventilator settings) at regular intervals to open up collapsed lung units.
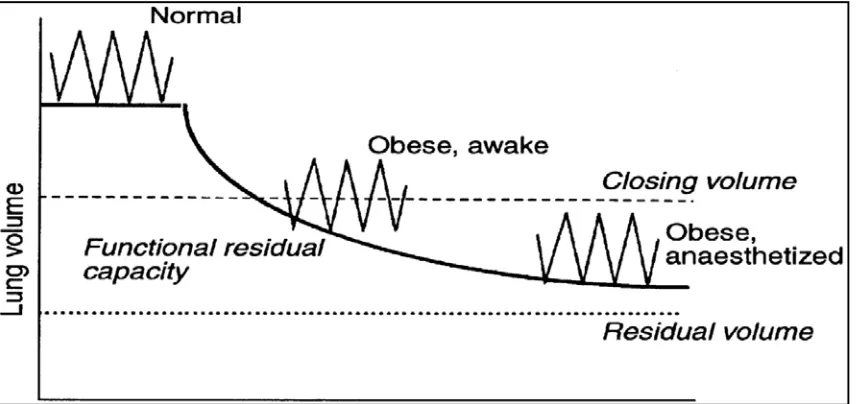
H. OBESITY, LUNG VOLUMES AND ANAESTHESIA
The obvious anaesthetic implications of obesity in the respiratory system include Obstructive
Sleep Apnoea (O.S.A.) and concerns about a difficult airway. With regard to lung volumes,
obesity is associated with reductions in the Total Lung Capacity (T.L.C.), Functional
Residual Capacity (F.R.C.) and Expiratory Reserve Volume (E.R.V.)(3). This is shown in
Figure 3. This has been attributed to the relative upward displacement of the diaphragm and
its decreased excursion due to accumulation of adipose tissue in the abdominal cavity. Often,
the F.R.C. drops below the Closing Capacity resulting in small airway closure and
ventilation-perfusion mismatch leading on to arterial hypoxaemia.
The reduction in F.R.C. is worsened under anaesthesia as shown in Figure 4. In fact
the F.R.C. may be reduced by as much as 50% in morbidly obese patients under anaesthesia
compared to a 20% reduction in F.R.C. in normal adults(53). This means such patients have a
lower reserve of oxygen for periods of apnoea such as during induction and airway
manipulation resulting in a greater incidence of hypoxaemia and desaturation under
anaesthesia. Methods to increase the F.R.C. include controlled ventilation with larger tidal
increases the F.R.C. more but at the cost of decreased cardiac output and decreased systemic
[image:28.612.97.523.197.424.2]oxygen delivery(9).
FIG. 3: CHANGE IN LUNG VOLUMES WITH OBESITY(52)
[image:28.612.96.524.513.715.2]I. VARIOUS FORMULAE USED IN THIS DOCUMENT
1. Classification of Obesity based on Body Mass Index: The classification of overweight
as a Body Mass Index (B.M.I.) of 25.0 or more, and obese as a B.M.I. of 30.0 or more
is based on the W.H.O. (World Health Organisation) B.M.I. cut-off points(54) which
is an international classification.
2. Calculation of Ideal Body Weight: The formula for Ideal Body Weight (I.B.W.) has
been taken from Lemmens et al(55), which correlates well with other published
formulae derived for the same purpose. The formula is
IBW (ideal body weight) = 22 x [Height (in metres)]2
The concept of ideal body weight arose from weight tables created by insurance
companies in an attempt to link body weight and mortality. Subsequently, various
formulae have been given to calculate ideal body weight. This particular formula
simply gives the body weight at which the individual would have a B.M.I. (Body
Mass Index) of 22 which lies exactly midway through the normal range of B.M.I.
(19.0 to 24.9).
3. Alveolar Gas Equation: The formula is given as
PAO2 = [FiO2 x (760 – 47)] – [PACO2/R] + [PACO2 x FiO2 x {(1 – R)/R}] (56)
where PAO2 : partial pressure of oxygen in alveolar gas (mm Hg)
FiO2 : oxygen concentration of inspired gas mixture (%)
760 : atmospheric pressure (mm Hg)
47 : partial pressure of water vapour in atmospheric air (mm Hg)
R : respiratory quotient
The assumptions made in this formula are:
a. There is no CO2 in the inspired gas mixture. This is ensured by the use of
CO2 absorber with the circle system.
b. PACO2 = PaCO2. Alveolar and arterial partial pressures of carbon dioxide
are the same if respiratory function is normal. However, this assumption
may be incorrect if significant shunt is present, when arterial PCO2 is
higher than alveolar PCO2.
c. Respiratory Quotient (R) is assumed to be 0.8 under normal metabolic
conditions. It can, in reality vary from 0.7 to 1.0 depending on the
METHODOLOGY
INTERVENTION AND PROCEDURE IN DETAIL
This study compares two different tidal volumes during ventilation under anaesthesia.
Informed consent is obtained prior to transferring the patient into the operating room.
Standard monitoring is established as indicated for the procedure including continuous
end-tidal carbon dioxide monitoring (ETCO2). A standard general anaesthetic is administered
with standard drugs. The dosage of drugs and the use of additional regional techniques for
anaesthesia / analgesia are decided by the primary care-giver anaesthesiologist.
Continuous ETCO2 monitoring is performed from the point of induction.
Volume-controlled ventilation is provided with the anaesthesia ventilator built into the Datex-Ohmeda
Aestiva/5 workstation via a circle system. The tidal volumes are 6 mL/kg and 10 mL/kg of
the IBW (ideal body weight) in the two arms (called Group I and Group II respectively) of
the study.
IBW is determined by the formula:
IBW = 22 x [Height (in metres)]2 (55)
The tidal volume is then calculated and rounded off to the nearest 25 mL based on the
minute) initially. The upper pressure limit is set at 35 cm H2O to avoid barotrauma. The FiO2
is set at 0.6 as far as possible.
After induction, intubation and confirming air entry, the circle system is connected to
the ventilator and the ventilator is activated. An ABG (arterial blood gas) analysis is
performed immediately after initiating controlled ventilation. This is called Sample A. The
ETCO2 at the time of collecting the arterial blood sample is noted. The arterial sample is
collected with the smallest possible needle (preferably 26 gauge) from the radial artery at the
wrist unless the patient already has an arterial cannula inserted for monitoring. The site of
collection is compressed and a compressive dressing is placed. At the end of the procedure,
the site is checked for bleeding and palpability of the pulse.
The PAO2 (partial pressure of oxygen in the alveoli) is calculated using the formula:
PAO2 = [FiO2 x (760 – 47)] – [PACO2/R] + [PACO2 x FiO2 x {(1 – R)/R}] (56)
Where: R (respiratory quotient) = 0.8 (under normal metabolic conditions); and
PACO2 (alveolar) = PaCO2 (with normal respiratory function)
Thus, the PAO2-PaO2 (alveolar-arterial oxygen) gradient, the PaO2-FiO2 ratio, and the
PaCO2-ETCO2 (arterial to end-tidal carbon dioxide) gradient can be determined. Another
ABG analysis is performed two hours after the first ABG with similar precautions as
mentioned before. This is called Sample B. The above-mentioned gradients are calculated
once more. Development of primary respiratory acidosis or alkalosis is also noted.
During the procedure, anaesthesia, analgesia, and muscle relaxation is as per the
care-giver’s decision following existing standards of care.
Continuous ETCO2 (end-tidal carbon-dioxide) monitoring is performed. Allowable
upper and lower limits of ETCO2 are predetermined (upper limit- 40 mm Hg; lower limit- 24
to bring the ETCO2 back to the acceptable range. The rate is increased by 2 bpm at a time if
the ETCO2 rises and decreased at a similar rate if the ETCO2 falls. The need to change the
respiratory rate is noted. If the ETCO2 does not come back to the acceptable range despite
changing the respiratory rate to 18 bpm or 6 bpm, the tidal volume is changed similarly by 50
mL at a time.
Any clinically significant abnormality detected on ABG is treated as required.
Respiratory acidosis is treated with hyperventilation and respiratory alkalosis with decreased
ventilation. Any indication of atelectasis (decrease in oxygenation) is treated with a vital
capacity manoeuvre (manual inflation upto 40 cm H2O maintained for 7-8 seconds). After
collecting the second ABG, ventilatory settings are re-adjusted as deemed necessary by the
primary care-giver.
Withdrawal of anaesthesia, reversal of neuro-muscular blockade, extubation and
post-operative care is carried out as per existing standards of care.
KEY INCLUSION / EXCLUSION CRITERIA
Inclusion Criteria:
ASA (American Society of Anaesthesia) physical status 1 & 2 adult patients with a BMI
(body mass index) of 25 or more undergoing general surgical procedures under general
anaesthesia with IPPV.
Exclusion Criteria:
1. ASA physical status 3 & 4;
3. BMI of less than 25;
4. Known case of bronchial asthma, COPD (chronic obstructive pulmonary disease), or
other respiratory pathology;
5. Pre-existing acid-base abnormality;
6. Patients with a history of smoking;
7. Laparoscopic procedures;
8. Emergency procedures;
9. Procedures involving thoracotomy or alteration of ventilatory parameters for surgical
purposes;
10.Procedures expected to last for less than 2 hours duration;
11.Refusal / inability to give consent.
SETTING OF THE STUDY
The study is carried out under the Department of Anaesthesiology, Christian Medical
College, Vellore in the main Operating Theatre complex. The subjects are taken from among
patients coming for elective surgery under the Department of General Surgery.
STUDY DESIGN
The study is a randomized controlled trial involving two arms (or groups). Patients are
randomly selected to either arm of the study. The two arms are named Group I (where
patients receive tidal volumes of 6 mL/kg) and Group II (where patients receive tidal volumes
METHOD OF RANDOMIZATION
Subjects are assigned to the study groups using simple randomization. The groups to which
the patients are to be allocated are written on pieces of paper in equal numbers and placed in
opaque envelopes. The envelopes are mixed in a bag. An envelope is taken from the bag
before the start of each case and the envelope opened to determine the group to which the
patient is allocated. The calculation of initial tidal volume is done after this.
METHOD OF ALLOCATION CONCEALMENT
Allocation is concealed using opaque envelopes.
BLINDING AND MASKING
The study is single-blinded. The patient will be unaware of which group he / she is placed in.
We are unable to perform double-blinding under the circumstances as the investigator is the
one setting the ventilator controls (tidal volume and respiratory rate).
OUTCOMES
Primary Outcome:
ETCO2 surpassing allowable limits and requiring a change in respiratory rate and tidal
volume for normalization.
Secondary Outcomes:
2. Change in the PAO2-PaO2 gradient,
3. Change in the PAO2-FiO2 ratio,
4. Change in the PaCO2-ETCO2 gradient.
TARGET SAMPLE SIZE AND RATIONALE
A pilot study was carried out to determine the sample size.
Based on the pilot study:
Patients in 6mL/kg group expected to have primary outcome = 75%
Patients in 10mL/kg group expected to have primary outcome = 30%
Thus, expected difference = 45%
Significance level = 5%
Power = 80%
Thus, based on the formula: (Zα + Zβ)2 [P1(1-P1) + P2(1-P2)]
d2
Sample size = 18 in each group,
= 36 patients in total.
STATISTICAL ANALYSES
Descriptive statistical methods like mean, standard deviation and confidence intervals is
The primary outcome is the occurrence of inadequate ventilation as defined by
abnormal ETCO2. This outcome variable is compared between the two groups using
Chi-Square tests to determine statistical significance.
For the continuous variables, mean difference between the groups is compared using
the Two-Sample T Test for independent and paired samples.
All data analysis is performed using the software SPSS 14.0 and Microsoft Office
RESULTS
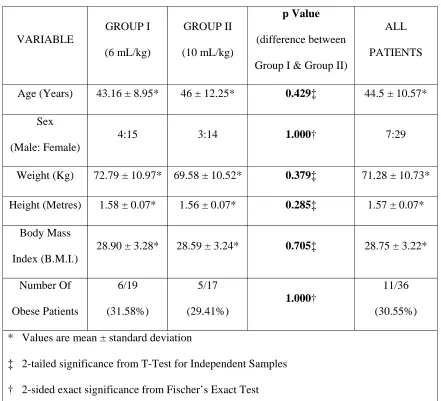
The two groups in this study are Group I (6 mL/kg) and Group II (10 mL/kg). There are 19
patients in Group I and 17 patients in Group II making a total of 36 patients.
DEMOGRAPHIC VARIABLES
The demographic variables are listed in Table 1. All demographic variables are equally
distributed in the two groups. As can be seen from the p-Values given in Table 1, there is no
significant difference in the distribution of the various demographic variables between the
two intervention groups.
The average age in Group I is 43.16 years and in Group II is 46 years.
There are 4 males in Group I and 3 males in Group II. The percentage distribution of
males and females is similar in the two groups.
The average weight of the patients in Group I is 72.79 kg. The weights range from 57
kg to 96 kg. In Group II, the average weight of the patients is 69.58 kg and the range is from
58 kg to 100 kg.
TABLE 1: DEMOGRAPHIC VARIABLES VARIABLE GROUP I (6 mL/kg) GROUP II (10 mL/kg) p Value (difference between
Group I & Group II)
ALL
PATIENTS
Age (Years) 43.16 ± 8.95* 46 ± 12.25* 0.429‡ 44.5 ± 10.57*
Sex
(Male: Female)
4:15 3:14 1.000† 7:29
Weight (Kg) 72.79 ± 10.97* 69.58 ± 10.52* 0.379‡ 71.28 ± 10.73*
Height (Metres) 1.58 ± 0.07* 1.56 ± 0.07* 0.285‡ 1.57 ± 0.07*
Body Mass
Index (B.M.I.)
28.90 ± 3.28* 28.59 ± 3.24* 0.705‡ 28.75 ± 3.22*
Number Of Obese Patients 6/19 (31.58%) 5/17 (29.41%) 1.000† 11/36 (30.55%)
* Values are mean ± standard deviation
‡ 2-tailed significance from T-Test for Independent Samples
† 2-sided exact significance from Fischer’s Exact Test
The Body Mass Index (B.M.I.) of patients in Group I range from 25.00 to 38.46, the
average being 28.90. In Group II, the average B.M.I. is 28.59, with a range extending from
25.15 to 35.43. The surgical procedures performed included thyroidectomies, neck
dissections, mastectomies, laparotomies and hernioplasties. The commonest were
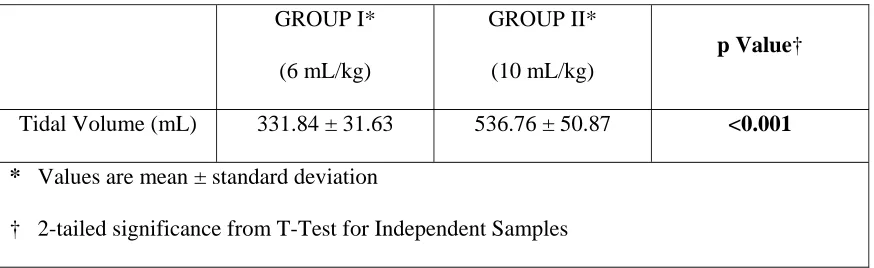
TABLE 2: INTERVENTION GROUPS
GROUP I*
(6 mL/kg)
GROUP II*
(10 mL/kg)
p Value†
Tidal Volume (mL) 331.84 ± 31.63 536.76 ± 50.87 <0.001
* Values are mean ± standard deviation
† 2-tailed significance from T-Test for Independent Samples
The patients in the study were randomized to receive either tidal volumes of either 6
mL/kg or 10 mL/kg of ideal body weight (I.B.W.). The difference is shown in Table 2. As is
evident from the p-Value of <0.001, there is a significant difference in the tidal volumes
delivered in the two groups. As there is no statistical difference in other variables (as shown
by Table1), any significant difference in the outcomes can be reasonably assumed to be due
to this difference in intervention.
ETCO
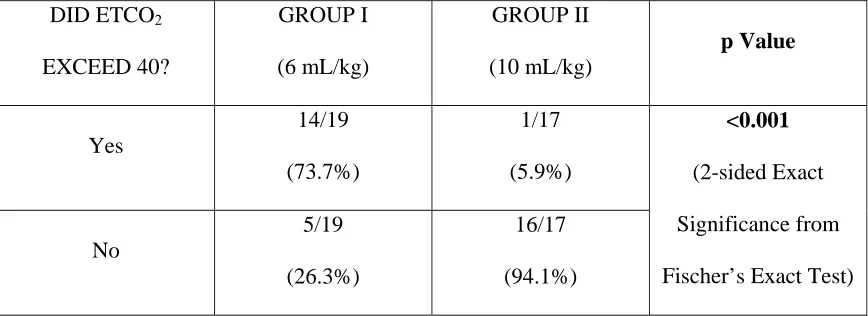
2EXCEEDING DEFINED LIMITS (PRIMARY OUTCOME)
The acceptable ETCO2 limits were set as 24 to 40. If the ETCO2 exceeded these limits, the
ventilator settings were changed. The results are given in Table 3A and Table 3B.
In Group I (6 mL/kg) nearly 74% of patients (14 out of 19 cases) had inadequate ventilation
as measured by ETCO2 exceeding the acceptable upper limit of 40 while in Group II (10
mL/kg), only 6% of patients (only 1 out of 17 cases) had inadequate ventilation. This is a
TABLE 3A: ETCO2 EXCEEDING UPPER LIMIT OF 40 DID ETCO2 EXCEED 40? GROUP I (6 mL/kg) GROUP II (10 mL/kg) p Value Yes 14/19 (73.7%) 1/17 (5.9%) <0.001 (2-sided Exact Significance from
Fischer’s Exact Test) No
5/19
(26.3%)
16/17
(94.1%)
FIG. 5: COMPARISON BETWEEN GROUPS ON PRIMARY OUTCOME
YES 14/19 73.7% YES 1/17 5.9% NO 5/19 26.3% NO 16/17 94.1% 0% 25% 50% 75% 100%
6 mL/kg 10 mL/kg
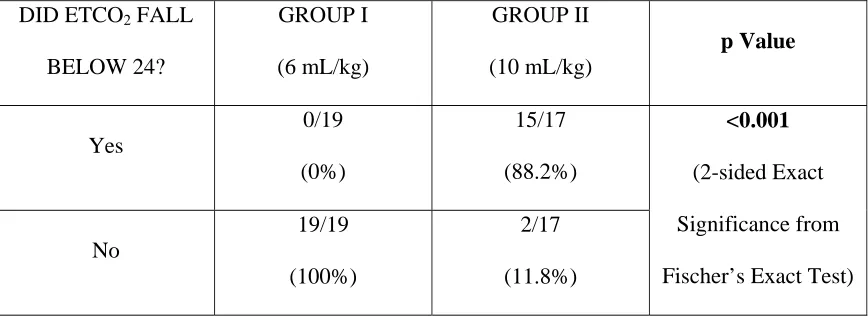
[image:41.612.93.527.368.689.2]TABLE 3B: ETCO2 DROPPING BELOW LOWER LIMIT OF 24
DID ETCO2 FALL
BELOW 24? GROUP I (6 mL/kg) GROUP II (10 mL/kg) p Value Yes 0/19 (0%) 15/17 (88.2%) <0.001 (2-sided Exact Significance from
Fischer’s Exact Test) No
19/19
(100%)
2/17
(11.8%)
Table 3B displays the number of cases in each group in which the ETCO2 exceeded
the acceptable lower limit of 24. None of the patients in Group I (6 mL/kg) showed an
ETCO2 value below 24 at any given time. On the other hand, in Group II (10 mL/kg), there
were 15 (out of 17) patients in whom the ETCO2 dropped below 24.
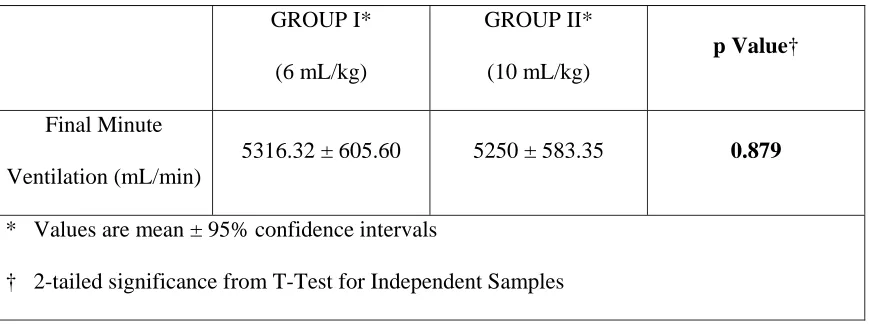
VENTILATOR SETTINGS
Based on the changes in ETCO2, the ventilator settings were changed as specified in the
Methodology section. We attempted to derive a possible best tidal volume (per kilogram of
ideal or actual body weight) such that, had we started the ventilation with that tidal volume,
the ETCO2 would have stayed within the defined limits. The settings at which the ETCO2
stayed within defined limits (24-40) were noted and the final minute ventilation calculated as
[image:42.612.90.524.103.261.2]Final Minute Ventilation (total) =
(Final Tidal Volume) x (Final Respiratory Rate)
Table 4 shows that there was no difference between the two groups in terms of the
[image:43.612.91.528.268.432.2]final minute ventilation needed to maintain the ETCO2 between defined limits.
TABLE 4: FINAL MINUTE VENTILATION
GROUP I*
(6 mL/kg)
GROUP II*
(10 mL/kg)
p Value†
Final Minute
Ventilation (mL/min)
5316.32 ± 605.60 5250 ± 583.35 0.879
* Values are mean ± 95% confidence intervals
† 2-tailed significance from T-Test for Independent Samples
The final minute ventilation was divided separately by the ideal body weight and
actual body weight to provide the final minute ventilation per kilogram of ideal and actual
body weight.
Final Minute Ventilation (per kg IBW) =
Final Minute Ventilation (total)
Ideal Body Weight
Final Minute Ventilation (per kg BW) =
Final Minute Ventilation (total)
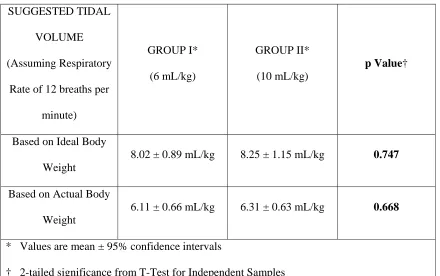
These products were finally divided by 12 (assuming 12 breaths per minute) to derive
a possible best tidal volume to start with, such that the ETCO2 would have stayed within
defined limits from the beginning.
Suggested Tidal Volume (per kg IBW) =
Final Minute Ventilation (per kg IBW)
12
Suggested Tidal Volume (per kg Actual BW) =
Final Minute Ventilation (per kg BW)
[image:44.612.88.528.414.690.2]12
TABLE 5: SUGGESTED TIDAL VOLUMES
SUGGESTED TIDAL
VOLUME
(Assuming Respiratory
Rate of 12 breaths per
minute)
GROUP I*
(6 mL/kg)
GROUP II*
(10 mL/kg)
p Value†
Based on Ideal Body
Weight
8.02 ± 0.89 mL/kg 8.25 ± 1.15 mL/kg 0.747
Based on Actual Body
Weight
6.11 ± 0.66 mL/kg 6.31 ± 0.63 mL/kg 0.668
* Values are mean ± 95% confidence intervals
The results are given in Table 5. In both groups, the suggested tidal volume is about 8
mL/kg of ideal body weight (7-9 mL/kg taking the 95% confidence intervals into
consideration). There is no significant difference in the suggested tidal volumes between the
two groups.
ARTERIAL BLOOD GAS VARIABLES
Arterial blood samples were drawn for analysis at the beginning (sample A) of controlled
ventilation and two hours after the first sample (sample B). The means with confidence
[image:45.612.88.528.454.670.2]intervals for the variables are given in Table 6A and Table 6B.
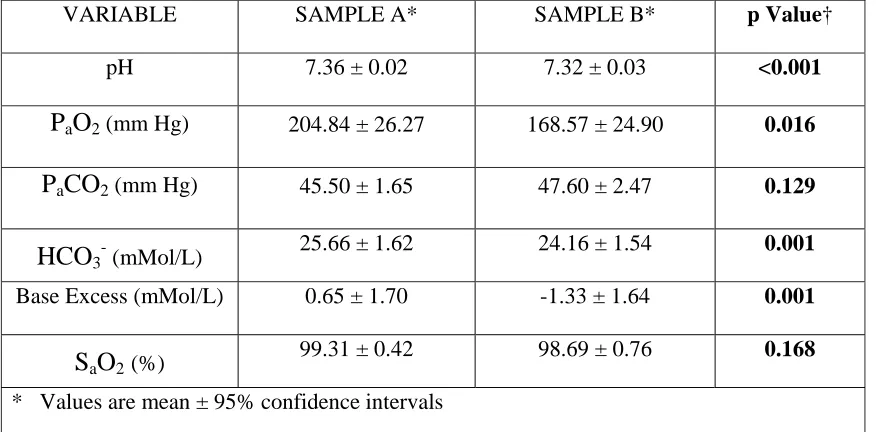
TABLE 6A: A.B.G. ANALYSIS FOR GROUP I (6 mL/kg)
VARIABLE SAMPLE A* SAMPLE B* p Value†
pH 7.36 ± 0.02 7.32 ± 0.03 <0.001
P
aO
2 (mm Hg) 204.84 ± 26.27 168.57 ± 24.90 0.016P
aCO
2 (mm Hg) 45.50 ± 1.65 47.60 ± 2.47 0.129HCO
3
(mMol/L) 25.66 ± 1.62 24.16 ± 1.54 0.001
Base Excess (mMol/L) 0.65 ± 1.70 -1.33 ± 1.64 0.001
S
aO
2(%)99.31 ± 0.42 98.69 ± 0.76 0.168
* Values are mean ± 95% confidence intervals
In Table 6A, the comparison between Sample A and Sample B for the patients in
Group I is shown. As can be seen, there was a significant drop in the pH and oxygenation at
the end of two hours of low tidal volume ventilation. There was also a rise in the PaCO2 at the
end of two hours but it was not significant.
In Table 6B, the comparison between Sample A and Sample B for the patients in
Group II is shown. As can be seen, there was no change in the pH and oxygenation at the end
of two hours of conventional tidal volume ventilation but there was a significant drop in the
PaCO2.
In Table 6A and Table 6B, there seems to be a statistically significant difference in
[image:46.612.91.523.462.669.2]HCO3- concentration and Base Excess between Sample A and Sample B in both low and
TABLE 6B: A.B.G. ANALYSIS FOR GROUP II (10 mL/kg)
VARIABLE SAMPLE A* SAMPLE B* p Value†
pH 7.42 ± 0.02 7.41 ± 0.03 0.400
P
aO
2 (mm Hg) 231.38 ± 34.85 237.06 ± 24.28 0.733P
aCO
2 (mm Hg) 38.54 ± 3.43 35.86 ± 2.23 0.026HCO
3
(mMol/L) 25.01 ± 1.19 23.36 ± 0.97 0.001
Base Excess (mMol/L) 0.09 ± 1.12 -1.75 ± 1.07 <0.001
S
aO
2(%)99.21 ± 1.03 99.74 ± 0.19 0.297
* Values are mean ± 95% confidence intervals
conventional tidal volume groups. However, the means and confidence intervals lie within
the clinically normal range and the change is minimal in actual terms and does not represent
any metabolic acid-base abnormality.
The inter-group comparisons of sample A and sample B are given in Table 6C and
Table 6D. Sample A (Table 6C) was taken as soon as possible after putting the patient on the
ventilator. There seems to have been a rapid effect on the pH and PaCO2 which were
statistically different between the two groups. However, there was no difference in PaO2
between the two groups. The possible explanation for the difference in pH and PaCO2 will be
discussed later.
[image:47.612.90.526.425.667.2]Sample B was taken two hours after sample A in both the low tidal volume and
TABLE 6C: FIRST ARTERIAL BLOOD GAS ANALYSIS (SAMPLE A)
VARIABLE
GROUP I*
(6 mL/kg)
GROUP II*
(10 mL/kg)
p Value†
pH 7.36 ± 0.02 7.42 ± 0.02 0.003
P
aO
2 (mm Hg) 204.84 ± 26.27 231.38 ± 34.85 0.236P
aCO
2 (mm Hg) 45.50 ± 1.65 38.54 ± 3.43 0.001HCO
3
(mMol/L) 25.66 ± 1.62 25.01 ± 1.19 0.537
Base Excess (mMol/L) 0.65 ± 1.70 0.09 ± 1.12 0.600
S
aO
2(%)99.31 ± 0.42 99.21 ± 1.03 0.865
* Values are mean ± 95% confidence intervals
TABLE 6D: SECOND ARTERIAL BLOOD GAS ANALYSIS (SAMPLE B)
VARIABLE
GROUP I*
(6 mL/kg)
GROUP II*
(10 mL/kg)
p Value†
pH 7.32 ± 0.03 7.41 ± 0.03 <0.001
P
aO
2 (mm Hg) 168.57 ± 24.90 237.06 ± 24.28 0.001P
aCO
2 (mm Hg) 47.60 ± 2.47 35.86 ± 2.23 <0.001HCO
3
(mMol/L) 24.16 ± 1.54 23.36 ± 0.97 0.408
Base Excess (mMol/L) -1.33 ± 1.64 -1.75 ± 1.07 0.684
S
aO
2(%)98.69 ± 0.76 99.74 ± 0.19 0.017
* Values are mean ± 95% confidence intervals
† 2-tailed significance from T-Test for Independent Samples
conventional tidal volume groups. As shown in Table 6D, there was a significant drop in pH
and PaO2, and a significant rise in the PaCO2 in the low tidal volume group. There was also a
statistically significant but clinically non-significant difference in SaO2 between the two
groups.
RESPIRATORY ACIDOSIS OR ALKALOSIS (SECONDARY OUTCOME)
The limits for acceptable pH were defined as being from 7.35 to 7.45(9)(7). Based on the
presence of an abnormal pH with a corresponding change in the PaCO2 outside the normal
TABLE 7A: RESPIRATORY ACIDIOSIS GROUP I (6 mL/kg) GROUP II (10 mL/kg) p Value* (difference between
Group I and Group II)
SAMPLE A 3/19 (15.79%) 1/17 (5.88%) 0.605 SAMPLE B 9/19 (47.37%) 1/17 (5.88%) 0.008 p Value* (difference between
Sample A and Sample B)
0.079 1.000
* 2-sided Exact Significance from Fischer’s Exact Test
FIG. 6: COMPARISON BETWEEN GROUPS ON SECONDARY OUTCOME
YES 9/19
47.37% 1/17YES
5.88% NO 10/19 52.63% NO 16/17 94.12% 0% 25% 50% 75% 100%
6 mL/kg 10 mL/kg
[image:49.612.95.525.461.722.2]Respiratory acidosis is considered in Table 7A. There is no significant difference
between the two groups at the beginning (sample A). However, at the end of two hours
(sample B), 47% of patients in Group I (6 mL/kg) had respiratory acidosis as compared to
only 6% of cases in Group II (10 mL/kg) which is a statistically significant difference as
shown in Figure 6.
Furthermore, 6 patients out of 19 (about one third) in Group I (6 mL/kg) ended up
developing respiratory acidosis during the two hours of low tidal volume ventilation while no
additional patients developed respiratory acidosis in Group II (10 mL/kg). This difference
[image:50.612.89.525.426.697.2]was tending towards statistical significance (p = 0.079).
TABLE 7B: RESPIRATORY ALKALOSIS
GROUP I
(6 mL/kg)
GROUP II
(10 mL/kg)
p Value*
(difference between Group I
and Group II)
SAMPLE A 0/19 (0%) 4/17 (23.53%) 0.040 SAMPLE B 0/19 (0%) 3/17 (17.65%) 0.095 p Value*
(difference between Sample A
and Sample B)
Not
Applicable
1.000
Table 7B displays the results on development of respiratory alkalosis. About one-fifth
of the patients in Group II (10 mL/kg) showed respiratory alkalosis in both sample A and
sample B while none of the patients in Group I (6mL/kg) had respiratory alkalosis in either
arterial blood sample. The difference between the two groups in terms of presence of
respiratory alkalosis is statistically significant in the beginning (sample A) and tending
towards statistical significance at the end of two hours (sample B).
INDICES OF OXYGENATION
The alveolar-arterial oxygen gradient (A-a Gradient: difference between PAO2 and PaO2) and
the PaO2-FiO2 ratio (P/F Ratio: PaO2 divided by FiO2) for each arterial blood sample were
calculated. Because of the large standard deviations and confidence intervals, we suspected
that the data may not follow a normal distribution. We performed the Kolmogorov-Smirnov
test of normality for the data which showed that the distribution of some of the variables was
significantly different from a normal distribution. Under the circumstances, non-parametric
tests are a better choice for analysing significant differences. The results are displayed in
Table 8A and Table 8B.
The difference between the two groups is highlighted in Table 8A. There is no
statistical difference in alveolar-arterial oxygen gradient or PaO2-FiO2 ratio between the two
groups in the beginning but at the end of two hours of ventilation with low or conventional
tidal volumes, there is a significant rise in the alveolar-arterial oxygen gradient and a
TABLE 8A: OXYGENATION INDICES (COMPARING GROUP I & GROUP II)
VARIABLE
GROUP I*
(6 mL/kg)
GROUP II*
(10 mL/kg)
p Value†
SAMPLE A
A-a Gradient 172.91 ± 25.90 154.02 ± 33.18 0.366
P/F Ratio 341.40 ± 43.79 385.65 ± 58.08 0.267
SAMPLE B
A-a Gradient 206.87 ± 25.05 151.30 ± 23.09 0.004
P/F Ratio 280.95 ± 41.51 395.10 ± 40.46 0.001
* Values are mean ± 95% confidence intervals
† 2-tailed significance from Mann-Whitney test
TABLE 8B: OXYGENATION INDICES (COMPARING SAMPLE A & SAMPLE B)
VARIABLE SAMPLE A* SAMPLE B* p Value†
GROUP I (6 mL/kg)
A-a Gradient 172.91 ± 25.90 206.87 ± 25.05 0.016
P/F Ratio 341.40 ± 43.79 280.95 ± 41.51 0.011
GROUP II (10 mL/kg)
A-a Gradient 154.02 ± 33.18 151.30 ± 23.09 0.653
P/F Ratio 385.65 ± 58.08 395.10 ± 40.46 0.421
* Values are mean ± 95% confidence intervals
[image:52.612.85.526.473.697.2]The Wilcoxon Signed Ranks test for paired samples displays the same results
comparing variables at the beginning and end of the intervention. This is displayed in Table
8B where there is no difference in oxygenation indices in Group II between sample A and
sample B but a significant difference between the two samples in the low tidal volumes group
(Group I). This difference is also shown in Figure 7 and Figure 8. It is noteworthy that in
the low tidal volume group, the P/F Ratio after two hours of ventilation drops below 300,
FIG.7: COMPARISON OF ALVEOLAR-ARTERIAL OXYGEN GRADIENTS
FIG.8: COMPARISON OF PaO2-FiO2 RATIO
Sample A
172.91 Sample A
154.02 Sample B
206.87
Sample B 151.31
125 150 175 200 225
Group I Group II
A‐a Gradient
Sample A
341.4
Sample A
385.65
Sample B 280.95
Sample B
395.1
250 300 350 400
Group I Group II
[image:54.612.96.527.468.703.2]CHANGE IN INDICES OF OXYGENATION (SECONDARY OUTCOME)
The changes in alveolar-arterial oxygen gradient and PaO2-FiO2 ratio from Sample A to
Sample B were analysed in all patients. Again, a non-parametric test (the Mann-Whitney test)
was performed to assess for significant differences between the two groups. The results are
given in Table 9. There is hardly any change in the alveolar-arterial oxygen gradient and
PaO2-FiO2 ratio in the conventional tidal volume group (Group II) while there is a significant
rise in the alveolar-arterial oxygen gradient and significant drop in the PaO2-FiO2 over two
[image:55.612.89.526.440.691.2]hours of low tidal volume ventilation (Group I). This is displayed in Figure 9 and Figure 10.
TABLE 9: CHANGE IN INDICES OF OXYGENATION
GROUP I*
(6 mL/kg)
GROUP II*
(10 mL/kg)
p Value†
A-a Gradient
Difference
(Sample B - Sample A)
+33.96 (± 26.81) -2.73 (± 32.08) 0.018
P/F Ratio Difference
(Sample B – Sample A)
-60.46 (± 44.65) +9.59 (± 53.32) 0.012
* Values are mean (± 95% confidence intervals)
FIG. 9: CHANGE IN ALVEOLAR-ARTERIAL OXYGEN GRADIENT
FIG. 10: CHANGE IN PaO2-FiO2 RATIO 33.96
‐2.73
‐10 0 10 20 30 40
GROUP I GROUP II
‐60.46
9.59
‐80
‐60
‐40
‐20 0 20
[image:56.612.95.524.470.703.2]CHANGE IN PaCO2-ETCO2 GRADIENT (SECONDARY OUTCOME)
The change in PaCO2-ETCO2 gradient from Sample A to Sample B was calculated for each
patient. The results are given in Table 10. As shown, there is no significant difference
between the changes in PaCO2-ETCO2 gradient between the two groups. However, the
gradient is more in the low tidal volume group in both samples (the difference is statistically
[image:57.612.92.526.310.510.2]significant in sample B).
TABLE 10: CHANGE IN PaCO2-ETCO2 GRADIENT
PaCO2-ETCO2 gradient
GROUP I*
(6 mL/kg)
GROUP II*
(10 mL/kg)
p Value†
Sample A 12.24 ± 2.24 9.59 ± 2.47 0.136
Sample B 11.71 ± 1.96 8.51 ± 1.47 0.031
Change in Gradient
(Sample B - Sample A)
-0.53 (± 2.14) -1.09 (± 1.81) 0.874
* Values are mean (± 95% confidence intervals)
DISCUSSION
This study compares two different tidal volumes of 6 mL/kg of ideal body weight and 10
mL/kg of ideal body weight during controlled ventilation under general anaesthesia.
Traditionally, tidal volumes of 10 mL/kg have been used. Even greater tidal volumes of upto
15 mL/kg are commonly recommended. It must be remembered that resting tidal volumes in
normal adults is actually around 7-8 mL/kg. Supra-physiological volumes of 10 mL/kg or
more were recommended to counter the near-universal reduction in Functional Residual
Capacity (F.R.C.) seen under general anaesthesia.
However, interest in lower tidal volumes was kindled by observations that
conventional tidal volumes resulted in exacerbation of lung injury and longer periods of
ventilatory support in patients with pre-existing lung injury. Studies have gone on to prove
that lower tidal volumes definitely reduce morbidity, mortality and duration of mechanical
ventilation in patients with Acute Lung Injury (A.L.I.) and Acute Respiratory Distress
Syndrome (A.R.D.S.). As a result, the use of lower tidal volumes is increasing, and this usage
is spilling over into the peri-