Int. J. Electrochem. Sci., 14 (2019) 6444 – 6453, doi: 10.20964/2019.07.58
International Journal of
ELECTROCHEMICAL
SCIENCE
www.electrochemsci.orgHighly Ordered Pt-Np Catalyst from Self-Assembly of Block
Copolymer and Its Durability in Fuel Cell Application
Xi Yang1,2, Jianguo Duan1, Yingjie Zhang1,*, Peng Dong1,*, Dan Su2, Mingyu Zhang2
1 Faculty of Metallurgical and Energy Engineering, Kunming University of Science and Technology,
Kunming 650093, China;
2 Yunnan Provincial Energy Research Institute Co. Ltd, Kunming 650599, China *E-mail: [email protected]
Received: 11 March 2019/ Accepted: 30 April 2019 / Published: 10 June 2019
Employing platinum-nanoparticle (Pt-Np) arrays with highly ordered and uniform arrangements of Nps in fuel cell is a possible approach to reduce the Pt-Np aggregation and improve catalyst durability during catalyst functioning. While the current methodologies for Pt-Np catalysts' synthesis can hardly achieve the homogeneously distributed Pt-Np layer due to the difficulty of control over the growing/located sites of Pt Nps precisely on carbon supporters. In this work, highly uniform and ordered Pt-Np arrays supported on carbon paper are prepared by pattern formation based on the self-assembly of PS-P2VP block copolymers (BCs). Cyclic voltammetry (CV) test of the arrays and the endurance test of the corresponding fuel cell indicate that, due to the absence of the Pt-Np aggregation, no significant performance loss is caused after 10000 cycles of CV and 100-hour running of the fuel cell. The aggregation can be successfully overcome by the quasi-homogeneous spacing distribution, which leads to higher electrocatalytic stability and better catalyst durability compared to the commonly used Johnson Matthey Pt/C commercial catalyst with the same Pt loading. After the endurance test, the Pt-Np arrays show almostly invariable size and spacing distributions, it has great potential in improving fuel-cell lifetime. The BC route is a promising strategy to achieve ultra-long-life and high- efficient functioning of the fuel cell.
Keywords: Pt-NP arrays, Spacing distribution, BC route, Cathodic catalysts, Fuel cell
1. INTRODUCTION
occupies more than 55% of the total cost [6]. Although non-Pt catalysts for fuel cell have recently draw great attention and been frequently studied in order to lower the cost [7-10], Pt catalysts, particularly carbon-supported Pt nanoparticles (Pt Nps), are the only electrocatalysts used in applied fuel cells presently and remain irreplacable in the short term [11]. This is because carbon-supported Pt has not only the highest catalytic activity for the oxygen reduction reaction (ORR) among all pure metals [11], but also an excellent stability in the harsh chemical conditions of a fuel cell [12].
In view of this, constant efforts to obtain high-performance fuel cell with the least usage amount of Pt possible have been made by improving Pt-catalyst utilization, which mainly include two strategies: improving the intrinsic activity and improving the durability [13]. The former can be achieved by a great number of methods, such as alloying, core-shell method, size control and shape control of Pt-Np catalysts [14-18], after which both the Pt-reactant binding interaction and the Pt usage amount are able to be optimized [19-22]. The latter can be achieved by adding metallic or organic species such as gold clusters or carbon black to stabilize Pt Nps against dissolution [23-24]. Compared to the former, however, significant results for durability improving have been reported less. This may be attributed to the unavoidable Pt-Np aggregation during the running of fuel cell, which is another important factor shortening the service life of Pt-Np catalyst besides Pt oxidation [12].
Employing the Pt-Np catalysts with highly dispersed and ordered arrangements of Nps is a possible approach to reduce the Pt-Np aggregation. Theoretically, the arrangements require a homogeneous spacing distribution of the catalyst particles, namely, a same center-to-center distance for all the adjacent Pt Nps located on the surface of the supporting material, rely on which the Pt-Np aggregation can be generally minimized due to the absence of the relatively dense-arranged area of the particles [25]. Unfortunately, owing to the difficulty of control over the growing/located sites precisely on carbon supporters, most of the current methodologies for Pt-Np catalysts' synthesis, including thermal reduction process, microwave-assisted process , electrodeposition and many others [11], can hardly achieve the homogeneously distributed Pt-Np layer discussed above.
Pattern formation based on self-assembly of block copolymers (BCs) is known as one of the most significant methodologies for the preparation of highly uniform Np arrays [26-28]. The copolymers formed by two inverse blocks, such as poly (styrene)-block-poly(2,4-vinylpyridine) (PS-b-P(2,4)VP), are preferred because of their formation of micelle composed of a insoluble core and a soluble corona in the selective solvent. By means of spin-coating or dip-coating, these micelles can be loaded on supporting materials as ordered BC nanopatterns for the fabrication of nanostructures [25]. It has been reported that the Pt precursors such as chloroplatinate or chloroplatinic acid (H2PtCl6) can protonate the
In this work, highly ordered Pt-Np arrays supported on carbon paper have been prepared from BC nanopatterns consisting of PS-b-P2VP micelles. Size and spacing statistic results show approximately ideal hexagonal arrangements of the Pt-NP arrays. Electrocatalytic stability of the arrays and durability of the PEMFC using the arrays as the cathode are investigated in detail by the following cyclic voltammetry (CV) test and the endurance test, respectively. Morphology of the arrays after 100 hours of PEMFC running are also investigated.
2.EXPERIMENTAL
2.1 Pt-Np Arrays Preparation
PS(16000)-b-P2VP(3500) (Polymer Source Inc. Canada, the molecular weights of the blocks are given within the brackets) was selected to synthesize the BC nanopatterns and used as received. 20 milliliter of tetrahydrofuran (THF) solution added with 0.5 wt % PS(16000)-b-P2VP(3500) was first prepared to obtain self-assembled micelles, each of which was composed of a P2VP(3500) core and a PS(16000) corona. Then the Pt precursor H2PtCl6∙6H2O purchased from Shanghai Chemical Reagent
Co. was dissolved in the micelle solution at an H2PtCl6/2VP molar ratio of 0.824. Carbon paper
(HCP120, 20*10*0.21 mm) obtained from Hesen Co. Ltd. was cleaned with a stream of nitrogen (N2)
for 15 minutes and selected as the supporter. The subsequent spin-coating process of the H2PtCl6/micelle
solution on carbon paper was conducted at 5000 rpm for 2 minutes by an KW-4A spin-coater purchased from Institute of Microelectronics of Chinese Academy of Sciences. Then the carbon paper coated with H2PtCl6/micelle was dried in air for 24 hours, and finally placed in an YZD08-2C plasma cleaner (110W,
Tonson Tech.) for a 15-minute cleaning, after which the BC nanopatterns were removed and the Pt precursors were reduced, resulted in the formation of carbon-supported Pt-Np arrays.
2.2 Characterization
An S-4800 scanning electron microscope (SEM) at 2.0 kV was employed to observe the surface morphology of the as-prepared specimens. The investigations of the Pt-Np arrays’ bonding energy were carried out by X-ray photo electron spectroscopy (XPS) detection with an ESCALAB 250Xi spectrometer equipped with an Mg Kα source. Pt-loading calculations of the specimens were achieved by X-ray fluorescence (XRF) measurements with an AXIOSmAX-PETRO facilities, and 5 μg Ir was selected as a reference sample during the measurements.
2.3 Electrochemistry
CHI600E tri-electrode electrochemical system purchased from Shanghai chinstruments Inc. was employed to evaluate the electrocatalysis performance of the specimens, in which saturated mercury/mercurous sulfate electrode (Hg/Hg2SO4, -0.7 V vs. reversible hydrogen electrode (RHE)), Pt
wafer (10*10 mm), 0.5 M H2SO4 solution saturated by N2 and as-prepared Pt-Np coated carbon paper
the counter electrode, the electrolyte and the working electrode, respectively. The electrocatalysis stabilities were examined by CV method at a scanning rate of 50 mV∙s-1 within a range of -0.65 ~ 0.6 V versus Hg/Hg2SO4 (0.05 ~ 1.3 V versus RHE) on the tri-electrode system described above.
2.4 Membrane-Electrode Assembly Preparation
To evaluate the durability of the Pt-Np arrays in corresponding fuel cell, another half of the carbon-supported Pt-Np arrays prepared from section 2.1 (10*10*0.21 mm) were fabricated as a membrane-electrode assembly (MEA) for a single PEMFC, within which the arrays were placed as the cathode, the carbon paper sputtered by Johnson Matthey Pt/C 20% commercial catalyst (JM 20%, Pt content of the catalyst: ~20 wt% , average Pt particle size: ~3nm) with a Pt loading of 0.4 mg∙cm-2 was
selected as the anode, and DuPont Nafion membrane (NRE212, 30*30 mm) as the proton exchange membrane, which was placed between the cathode and the anode after the cleaning processes of both boiling H2O2 and H2SO4. No hot pressing process was carried out in consideration of the vulnerability
of the arrays’ high-dispersed and ordered particle arrangements, and the arrays-membrane-JM 20% structures were compacted directly by a PEMFC fixture.
3.RESULTS AND DISCUSSION
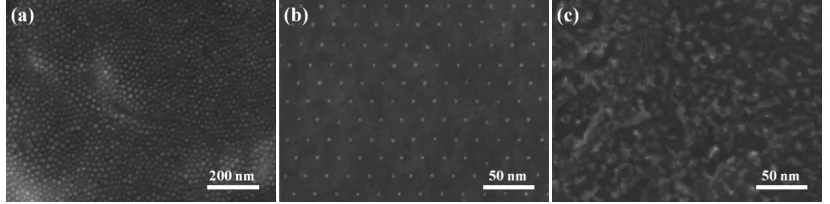
[image:4.596.92.507.535.637.2]Typical SEM images of the as-prepared BC nanopatterns and the obtained Pt-Np arrays are shown in Fig.1a and 1b, respectively. The BC micelles were regularly coated on carbon paper, resulting in the formation of carbon-supported Pt-Np arrays exhibited as highly uniform and ordered particle arrangements as other reported arrays synthesized from BC route [31, 33, 36]. Fig.1c gives the SEM micrograph of the JM 20% catalysts sputtered on the carbon supporter with a same Pt loading as the arrays, which shows disordered and overlapped particle arrangements.
Figure 1. SEM images of (a) as-prepared BC nanopatterns, (b) BC-patterned Pt-Np arrays and (c) the JM 20% catalysts with a same Pt loading as the Pt-Np arrays.
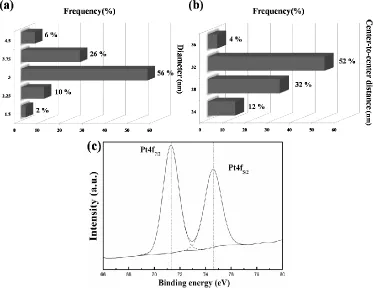
given in Fig.2a and 2b, in which diameters of over 95% particles are within a range of 3 ± 0.75 nm and center-to-center distances of near 90% pairs of adjacent particles are within 32 ± 4 nm, demonstrating that the as-prepared Pt Nps are arranged as quasi-homogeneously distributed arrays. The XPS measurement of the Pt-Np arrays is shown in Fig.2c. Main Pt (4f7/2) peak of the Nps is centered at 71.3
eV as the Pt (0) Nps reported previously [37]. Meanwhile, no peaks attributed by Pt (II) are observed in the spectrum, suggesting that PtO species are barely produced on the surface of the Nps synthesized from our BC route, which is beneficial for the increasing of Pt utilization.
Figure 2. (a) Diameter and (b) center-to-center distance statistic results of the Pt Nps; (c) XPS spectrum of the Pt-4f region for the BC-patterned Pt-Np arrays.
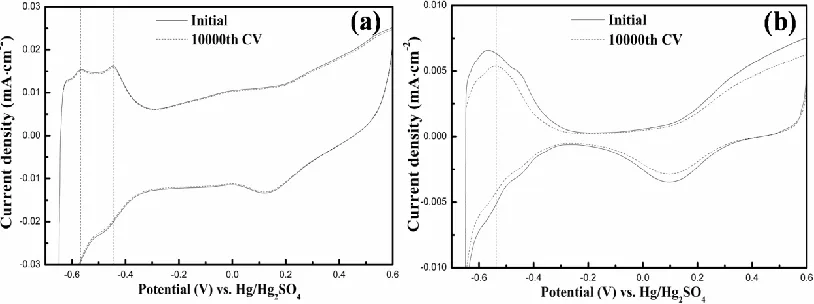
Area-normalized curves of initial and 10000th CV cycle were investigated for both the Pt-Np arrays (Fig.3a) and the JM 20% (Fig.3b). A negligible area loss less than 2% is found for the adsorption– desorption of hydrogen (-0.65 to -0.3 V versus Hg/Hg2SO4, namely, 0.05 to 0.4 V versus RHE) in Fig.3a,
[image:5.596.112.485.208.496.2]
Figure 3. CV curves of (a) the Pt-Np arrays and (b) the JM 20%, in which solid curves represent for the initial CV, dashed curves for the 10000th CV.
According to the previous reports of Pt-based catalysts [38-40], the loss of electrocatalytic activity during long-time CV running is mainly attributed to Pt-Np aggregation and Pt loss, and the latter arises mostly from Pt oxidation, which follows by Pt corrosion or passivation [12]. Moreover, it has been widely confirmed that the particular voltammetric profile which constructs hydrogen adsorption– desorption area is closely connected with the specific surface structure of Pt Nps [41]. Therefore, each H-desorption peak can be identified as the presence of wide domains, terraces, steps or sites of the corresponding Pt crystal face [42]. This also means that relative shifts of the H-desorption peaks will be observed after Np aggregation or Pt loss due to the changes of particle surface structure. For the Pt-Np arrays synthesized from our BC route, neither of the two H-desorption peaks (Fig.3a, marked by dashed lines) has shifted after 10000th CV, suggesting that no significant Pt-Np aggregation or Pt loss is caused. In consideration of the same testing conditions as the Pt-Np arrays, Pt loss of JM 20% could also be ignorable, which has been demonstrated by the nearly invariable value of Pt loading shown in Table 1. Thus, Pt-Np aggregation is the main reason caused the H-desorption peak shifts (Fig.3b, marked by dashed line) and the electrocatalytic activity loss of JM 20% after 10000th CV. We believe that, the large-scale particle overlapping and close packing of the JM 20% result in a higher possibility of Pt-Np aggregation, which leads to significantly larger loss of the electrocatalytic activity compared to the arrays. Furthermore, there is no major difference between the two tested specimens except the arrangements of the Pt Nps on supporting surface. In view of this, quasi-homogeneous spacing distribution, namely, ordered and uniform particle arrangement, has contributed most to the absence of the Pt-Np aggregation as well as the optimization of the electrocatalytic stability.
Table 1. Specimens' Pt loading (μg ∙cm-2) measured by XRF before CV test and after 10000th CV.
Specimen Initial 10000th
Arrays 0.186 0.183
JM 20% 0.184 0.182
[image:6.596.97.504.72.224.2] [image:6.596.85.510.668.716.2]
includes one pair of both bipolar plates and current collectors composed of graphite and copper, respectively. The center of each bipolar plate is patterned with serpentine-type channel as the flow fields. Thermostatic control of the PEMFC was achieved by HD701 temperature controller (Tianjin ida Co. Ltd.) linked to the two copper current collectors. The MEA of the arrays mentioned in section 2.4 and the MEA fabricated by the JM 20% specimen were sandwiched in the middle of two identical silica-gel seals, respectively. Both of the silica-gel seals were center-hollowed, which insured the direct contact between the MEAs and the flow fields. 100-hour endurance of the PEMFC was evaluated on a same electronic load as Gan reported [34] at both a constant current density and a constant temperature of 0.5A∙cm-2 and 80℃, respectively, during which 0.1MPa fully humidified H
2 as well as O2 was used and
the cell potential (E) was recorded every 5 hours.
[image:7.596.163.436.427.629.2]We believe that, due to the same testing conditions, the Pt loss of the arrays and the JM 20% after 100-hour running of the fuel cell are almost same. Meanwhile, based on the results discussed above, more serious Pt-Np aggregation within the fuel cell may be found for the JM 20% compared to the arrays. Hence the fuel cell assembled by the arrays' MEA may exhibit better durability than JM 20%- fabricated fuel cell. This has been demonstrated by the E vs. time (t) plots shown in Fig.4, in which a negligible E loss of 1.2 mV is found after 100 hours for the fuel cell using the arrays, yet a significant loss of 8.6 mV for that using the JM 20%. In addition, due to the open space for the Pt/reactants contact and periodic catalytic active sites [25, 34], the arrays show larger hydrogen adsorption–desorption area as well as higher ECSA (Fig.3) compared to the JM 20%, leading to higher E at the same current densities (Fig.4).
Figure 4. E vs. t plots of the fuel cell within 100 hours using the arrays and the JM 20% as cathodic catalysts.
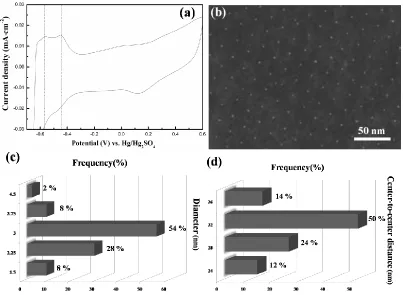
environment within the fuel cell, Pt-Np aggregation can be successfully overcome by quasi-homogeneous spacing distribution. The results in Fig.3, Fig.4 and Fig.5a demonstrate that, because of the ordered and uniform particle arrangements, Pt-Np arrays synthesized from our BC route are not only able to show more excellent catalyst durability compared to the commercial Johnson Matthey catalyst with the same Pt loading, but also capable of ensuring long-life and highly efficient functioning of the fuel cell.
Figure 5. (a) CV curve of the Pt-Np arrays after endurance test; (b) SEM image and the distribution of (c) diameter and (d) center-to-center distance of the corresponding arrays
[image:8.596.99.502.189.484.2]
fuel cell, and the ordered and uniform Pt-Np arrays from BC are perfectly suitable for the cathodic application of fuel cell.
4.CONCLUSION
In this work, carbon paper loaded with highly ordered and uniform Pt-Np arrays has been obtained based on PS-P2VP nanopatterns. The statistic results show that the arrays' distributions of both size and spacing are quasi-homogeneous distribution. The following CV measurements exhibit a higher electrocatalytic stability of the arrays than the JM 20% catalyst with the same Pt loading, and ECSA loss of the arrays is negligible after 10000 cycles of CV. Similar to the results of CV tests, the arrays show higher catalyst durability than the JM 20% within the PEMFC, and the potential of the PEMFC using the arrays maintains nearly constant after 100-hour running. According to the invariable locations of the H-desorption peaks, no significant Pt-Np aggregation or Pt loss is caused for the arrays after those two tests. Meanwhile, quasi-homogeneous spacing distribution can successfully overcome the Pt-Np aggregation, thus excellent stability and durability have been shown by the arrays. Further morphology investigations of the arrays after the endurance test show almostly invariable size and spacing distributions compared to the initial ones, in view of which the arrays have great potential for the improvement of fuel-cell life, and employing BC route to synthesis ordered and uniform Pt arrays is a promising tactic to achieve ultra-long-life and highly efficient functioning of the fuel cell.
ACKNOWLEDGEMENTS
The project was supported by National Natural Science Foundation of China (No. 51764029)
References
1. M.H. Shao, Q.W. Chang, J.P. Dodelet and R. Chenitz, Chem. Rev., 116 (2016) 3594. 2. B. Fang, J.H. Kim, M.S. Kim and J.S. Yu, Acc. Chem. Res., 46 (2013) 1397.
3. S.J. Guo and E. Wang, Nano Today, 6 (2011) 240. 4. Y.M. Li and G.A. Somorjai, Nano Lett., 10 (2010) 2289. 5. R. Bashyam and P. Zelenay, Nature, 443 (2006) 63.
6. X. Lin, L. Zheng, G. Gao, Y. Chi and G. Chen, Anal. Chem., 84 (2012) 7700.
7. K. Strickland, E. Miner, Q. Jia, U. Tylus, N. Ramaswamy, W. Liang, M.T. Sougrati, F. Jaouen and S. Mukerjee, Nat. Commun., 6 (2015) 7343.
8. A. Serov, K. Artyushkova, E. Niangar, C. Wang, N. Dale, F. Jaouen, M.T. Sougrati, Q. Jia, S. Mukerjee and P. Atanassov, Nano Energy, 16 (2015) 293.
9. E. Negro, A. Videla, V. Baglio, A.S. Aricò, S. Specchia and G. Koper, Appl. Catal. B, 166-167 (2015) 75.
10. F. Roncaroli, E.S. Dal Molin, F.A. Viva, M.M. Bruno and E.B. Halac, Electrochim. Acta, 174 (2015) 66.
11. Y.J. Wang, N. Zhao, B.Z. Fang, H. Li, X.T. Bi and H.J. Wang, Chem. Rev., 115 (2015) 3433. 12. T.H. Oliver and W.S. Joseph, Platinum Metals Rev., 57 (2013) 259.
14. C.V. Rao and B. Viswanathan, J. Phys. Chem. C, 113 (2009) 18907.
15. K. Okaya, H. Yano, H. Uchida and M. Watanabe, ACS Appl. Mater. Interfaces, 2 (2010) 888. 16. B.R. Cuenya, Thin Solid Films, 518 (2010) 3127.
17. J. Wu and H. Yang, Acc. Chem. Res., 46 (2013) 1848.
18. C.J. Zhong, J. Luo, B. Fang, B.N. Wanjala, P.N. Njoki, R. Loukrakpam and J. Yin, Nanotechnology, 21 (2010) 062001.
19. V. Stamenkovic, B.S. Mun, K.J. Mayrhofer, P.N. Ross, N.M. Markovic, J. Rossmeisl, J. Greeley and J.K. Nørskov, Angew. Chem. Int. Ed., 45 (2006) 2897.
20. P. Strasser, S. Koh, T. Anniyev, J. Greeley, K. More, C. Yu, Z. Liu, S. Kaya, D. Nordlund, H. Ogasawara, M.F. Toneyand and A. Nilsson, Nat. Chem., 2 (2010) 454.
21. H. Yang, X.W. Teng, S.I. Maksimuk, B. Corain, C.G. Schmid and N. Toshima, Metal Nanoclusters in Catalysis and Materials Science: The Issue of Size Control. Part II: Methodologies, Elsevier, (2008) Amsterdam, Holland.
22. H. Bönnemanna and G. Khelashvili, Appl. Organometal. Chem., 24 (2010) 257.
23. Y. Li, E. Zhu, T. McLouth, C.Y. Chiu, X.Q. Huang and Y. Huang, J. Am. Chem. Soc., 134 (2012) 12326.
24. J. Zhang, K. Sasaki, E. Sutter and R.R. Adzic, Science, 315 (2007) 220 .
25. Y. Gan, Z.D. Wang, Y. Shi, C.Q. Guo, H.Y. Tan and C.F. Yan, J. Mater. Sci., 53 (2018) 4089. 26. F.S. Bates, Science, 251 (1991) 898.
27. L.G. Li, Y.K. Che, D.E. Gross, H.L. Huang, J.S. Moore and L. Zang, ACS Macro Lett., 1 (2012) 1335.
28. T. Kawazoe, K. Hashimoto, Y. Kitazawa, H. Kokubo and M. Watanabe, Electrochimica Acta, 235 (2017) 287.
29. J. Matos, L.K. Ono and F. Behafarid, Phys. Chem. Chem. Phys., 14 (2012) 11457. 30. B.R. Cuenya, J.R. Croy and S. Mostafa, J. Am. Chem. Soc., 132 (2010) 8747. 31. P.S. Joahim, M. Stefan, H. Christoph and M. Martin, Langmuir, 16 (2000) 407.
32. J. Frascaroli, S. Brivio, F.F. Lupi, G. Seguini, L. Boarino, M. Perego and S. Spiga, ACS Nano, 9 (2015) 2518.
33. H. Mizuno and J.M. Buriak, ACS App. Mater. Interfaces, 1 (2009) 2711.
34. Y. Gan, Z.D. Wang, Y. Shi, C.Q. Guo, H.Y. Tan, Z.X. Lu and C.F. Yan, Electrochimica Acta, 283 (2018) 1.
35. Y. Gu, J. St-Pierre and H.J. Ploehn, Langmuir, 24 (2008) 12680.
36. J. Croy, S. Mostafa, H. Heinrich and B. Cuenya, Catal Lett., 131 (2009) 21. 37. S.K. Oh, Y.G. Kim, H.C. Ye and R.M. Crooks, Langmuir, 19 (2003) 10420.
38. A. Balamurugan, T. Takanori and Y. Takeo, ACS Appl. Mater. Interfaces, 7 (2015) 16311. 39. A.W. Jarrid, J. Zheng and Y.S. Yan, ACS Catalysis, 4 (2014) 3145.
40. S.I. Choi, S.L. Lee and W.Y. Kim, ACS Appl. Mater. Interfaces, 4 (2012) 6228.
41. J. Solla-Gulloń, P. Rodrıǵ uez, E. Herrero, A. Aldaz and J.M. Feliu, Phys. Chem. Chem. Phys., 10 (2008) 1359.
42. A. Roberto, M. ez-Rodrıǵ uez, F.J. Vidal-Iglesias, J. Solla-Gulloń, R.C. Carlos and M.F. Juan, J. Am. Chem. Soc., 136 (2014) 1280.