stress distributions within selective laser melted Ti6Al4V components
.
White Rose Research Online URL for this paper:
http://eprints.whiterose.ac.uk/146395/
Version: Published Version
Article:
Ali, H., Ghadbeigi, H., Hosseinzadeh, F. et al. (2 more authors) (2019) Effect of
pre-emptive in-situ parameter modification on residual stress distributions within selective
laser melted Ti6Al4V components. International Journal of Advanced Manufacturing
Technology. ISSN 0268-3768
https://doi.org/10.1007/s00170-019-03860-6
[email protected] https://eprints.whiterose.ac.uk/
Reuse
This article is distributed under the terms of the Creative Commons Attribution (CC BY) licence. This licence allows you to distribute, remix, tweak, and build upon the work, even commercially, as long as you credit the authors for the original work. More information and the full terms of the licence here:
https://creativecommons.org/licenses/
Takedown
If you consider content in White Rose Research Online to be in breach of UK law, please notify us by
ORIGINAL ARTICLE
Effect of pre-emptive in situ parameter modification on residual
stress distributions within selective laser-melted Ti6Al4V components
Haider Ali1&Hassan Ghadbeigi1&Foroogh Hosseinzadeh2&Jeferson Oliveira2&Kamran Mumtaz1
Received: 13 February 2019 / Accepted: 7 May 2019 #The Author(s) 2019
Abstract
The effect of thermally induced residual stresses is not dynamically considered during a selective laser melting (SLM) build; instead, it processes using invariable parameters across the entire component’s cross-section. This lack of pre-emptive in situ parameter adjustment to reduce residual stresses during processing is a lost opportunity for the process with the potential to improve compo-nent mechanical properties. This investigation studied the residual stresses introduced during manufacturing of SLM Ti6Al4V benchmark components and adapted process parameters within a build (layer-to-layer specific modifications) to manage and redistribute stresses within these components. It was found that temporarily switching to an increased layer thickness during the build, directly below highly stressed regions within the component, redistributed stresses and reduced the overall stresses within the structure by 8.5% (within the 80–320-MPa residual stress range) compared to standard invariable SLM processing parameters. This work demonstrates the need for current SLM systems to focus on developing a more intelligent processing architecture with parameters that adapt on the fly during a build, in order to manage residual stresses within the built structure.
Keywords Residual stress . Geometrical dependence . Cooling rate . Selective laser melting . Additive manufacturing . Ti6Al4V . Contour method
1 Introduction
Additive manufacturing (AM) techniques are gradually be-ing adopted by high value, high-performance industries (i.e. aerospace, automotive) due to the greatly expanded design freedoms and parts customization [1–3]. Selective laser melting (SLM) is an AM technique that creates high-density 3D parts by selectively melting and fusing metallic powder. Cross-sections of a 3D geometry are successively fused on top of each other in a layer-wise manner. A sig-nificant challenge associated with the manufacture of SLM metallic components is the potential development of high internal residual stress [3]. Rapid repeated heating and cooling cycles of successive layers of the powder
feed-stock during the SLM build process results in high cooling rates and large temperature gradients associated with the process generating high residual stress build up in the SLM built components. Parts can fail during an SLM build, or later in service, due to these high internal residual stresses [3–12]. Post-processing stress relief heat treatment cycles can potentially remove most of the internal residual stress-es, but adds up to the manufacturing time and cost of SLM components [13].
A correct understanding of the numerous physical phe-nomena associated with this complex fabrication process is required in order to prevent defects from forming [14]. All additive manufacturing processes including SLM can be broken down into pre-process, in-process and post-process stages with varying parameters at each stage af-fecting the final part properties [2, 12]. Considerable re-search has focused on the in-process parameters and their effect on the residual stress build up in the SLM compo-nents; within this work, there is some consensus but also some contradiction, primarily due to the variation in benchmark components tested during these studies [3, 5,
6,8,9,11,15–27].
* Kamran Mumtaz
1
Department of Mechanical Engineering, University of Sheffield, Sheffield, UK
2
School of Engineering & Innovation, The Open University, Milton Keynes MK7 6BJ, UK
1.1 SLM residual stress reduction
The SLM process can be approximated by stacking of thou-sands of welds together. Understanding the dynamics of a single weld or in SLM terminology, a single melt pool is important. Melt pool size increases with increasing energy input [28]. Laser power has a more pronounced effect on maximum temperature than laser exposure time [28]. Lower laser power leads to lower maximum temperature [28–30], smaller melt pool and higher cooling rates [29]. High laser power results in lower deformation and lower residual stress [25], while Alimardani et al. [30] reported lower residual stresses for lower laser power. Lower scan speed leads to lower temperature gradients [21], lower cooling rates [29], lower residual stresses [31] and reduces the potential for geo-metric deformation. Higher scan speed leads to increased cooling rate and increased cracking [32], while Pohl et al. [24] reported lower deformation for higher scan speed. Lower power and higher exposure combination (for constant energy density) lead to increased porosity and thus reduced yield strength in 316-L SLM samples [33]. Ali et al. [34] reported lower residual stress for lower power and higher ex-posure combination (for constant energy density). According to Ali et al. [34] for an energy density of 76.92 J
mm3, SLM
Ti6Al4V blocks manufactured with 150 W power and 133-μs exposure combination resulted in 34.6% lower resid-ual stress compared to their 200 W power and 100-μs expo-sure counterparts [34].
1.1.1 Effect of layer thickness
Powder particle size determines the lower limit of the layer thickness, while the need for melt pool penetration into under-lying layers determines the upper limit. Larger layer thick-nesses can increase productivity at the detriment of geometri-cal resolution and as well as the roughness of side surfaces. It has been reported [5,8,9] that increasing layer thickness results in reduced residual stresses due to a reduction in cooling rate. Kruth et al. [5] reported that for the same energy density, doubling the layer thickness reduced the curling angle of bridge geometry by 6%. Roberts et al. [11] found that dou-bling the layer thickness reduced the residual stress by 5%. While Zaeh et al. [8] reported that increasing the layer thick-ness by 2.5 times decreased the deformation of the ends of a T-shaped cantilever by 82%. Sufiiarov et al. [35] reported an increase in yield strength and a decrease in elongation for decreasing layer thickness in IN718 SLM parts. Guan et al. [36] reported that layer thickness had no effect on the mechan-ical properties of 304 stainless steel SLM components. Delgado et al. [37] reported that increasing layer thickness had a negative effect on the mechanical properties of AISI 316-L SLM components. Parts are created with different layer
thickness using the same parameters [5, 8, 9, 11,35–37], optimised for one layer thickness (i.e. achieving full density). The work by Ali et al. [34] optimised parameters for each layer thickness and found that 75-μm layer thickness blocks had 27.1% less residual stress compared to their 50-μm layer thickness counterparts [34].
1.1.2 Effect of geometry
SLM part length and moment of inertia of the build section affects the magnitude of the residual stress build up [27]. According to Casavola et al. [3], circular specimens warp (due to residual stress) less as opposed to components where the geometrical dimensions have a higher aspect ratio. This work also concluded that for the same diameter, thicker spec-imens have lower stresses as opposed to thinner specspec-imens. Yadroitsava et al. [22] compared residual stresses in a paral-lelepiped built directly onto the substrate with a cantilever beam, where the overhanging parts were supported and found that the residual stresses in the cantilever structure were much higher than the parallelepiped. This work concluded that re-sidual stress depends on the material properties, as well as sample and supports geometry. Mugwagwa et al. [38] studied the effect of geometrical features on residual stress using a T-shaped geometry and concluded that higher residual stresses are generated at sharper edges of the specimens and increasing the curvature of the corners relaxed these stresses due to a reduction in sharpness.
Ali et al. [34,39–42] measured residual stress with the strain gage hole-drilling method [34, 39–45] in SLM Ti6Al4V 30 × 30 × 10 mm blocks. Residual stress is inversely proportional to bed temperature and 570 °C bed pre-heat tem-perature completely mitigated residual stress [42]. Residual stress is inversely proportional to layer thickness and 75-μm layer thickness resulted in minimum residual stress [40]. For constant energy density of 76.9 J
mm3, 150 W power and 133-μs
exposure combination resulted in the lowest residual stress [40].
1.2 In situ parameter modification for stress
reduction/redistribution
location-specific application of stress reduction strategies across regions of an SLM component cross-section and its effect on residual stress distribution. This work studies the effect of varying parameters across the building height and applying stress reduction strategies to specific regions across the cross-section of SLM Ti6Al4V components. Specifically, the effect of varying laser power and exposure combinations for a constant energy density and layer thickness on residual stress on an SLM Ti6Al4V I-Beam section is undertaken. The contour method is used for residual stress measurement and Matlab image analysis is used in combination with experi-mental trials to understand the underlying phenomena associ-ated with the residual stress build up in a complex SLM Ti6Al4V sample.
2 Experimental methodology
2.1 Material and processing parameters
Table1shows the composition of Ti6Al4V-ELI powder with a particle size of 15–45μm from Technik Spezialpulver (TLS), used within this investigation.
Both SLM125 [42] and AM250 [39] have a maximum power of 200 W. Previous work from both systems for param-eter optimisation trials showed that 200 W power and 100-μs exposure combination led to nearly fully dense (99.9%) parts for 100 °C bed temperatures [39, 42]. Therefore, the manufacturing of benchmark test specimens was carried out on a standard Renishaw AM250 machine using the process parameters presented in Table2. A high bed temperature sam-ple was manufactured using a modified Renishaw SLM125 machine with retrofitted high-temperature platform at the University of Sheffield.
2.2 Density and microstructure analysis
Density and microstructure for parameter combinations shown in Table3were analysed based on an optical micros-copy methodology presented in the work by Ali et al. [39,42].
2.3 Application of location-specific residual stress
reduction strategies
Experiments were designed to first establish a benchmark for residual stress concentration studies in an I-Beam geometry. SLM stress reduction strategies (developed based on 30 ×
30 × 10 mm block samples and strain gage hole-drilling meth-od) identified in the work by Ali et al. [34] were then applied locally to these identified high-stress areas to understand their local effect in an I-Beam geometry. I-Beam sections were designed (see Fig. 1a) and built on the SLM250 platform using optimum SLM parameters for Ti6Al4V, found in the work by Ali et al. [34]. The contour method was used to measure residual stress in the I-Beam, cross-sectioned through the XZ plane. The 2D residual stress map identified the high-stress regions in the I-Beam. Figure1bshows the dimensions of the four regions for strategic application of residual stress reduction strategies, across the height of the entire cross-sec-tion. Table 4 shows the details of the different I-Beam test cases manufactured for this study.
In test case IB-1, the standard I-Beam was manufactured using the optimum combination of parameters for 50-μm lay-er thickness to obtain the highest density as is reported in [34,
42]. The work by Ali et al. [34] showed that increasing layer thickness reduces residual stress. From the different layer thicknesses evaluated in the work (25, 50 and 75 μm), 75-μm layer thickness resulted in the overall lowest stress. Therefore, 75-μm layer thickness was applied as a stress re-duction strategy to strategic regions (as shown in Fig.1b) of test cases IB-2 and IB-5, while the remaining sections were built with an optimum combination of parameters for 50-μm layer thickness from density optimisation trials presented in the work by Ali et al. [34,42]. It is also reported that [34] for a constant energy density, decreasing power and increasing ex-posure led to a reduction in residual stress. From the different combinations of power and exposure for a constant energy density of 76.92mmJ3 was calculated from the optimum
com-bination of parameters for 50-μm layer thickness from density optimisation trials presented in the work by Ali et al. [34,42] using Eq. 1, 150 W power and 133-μs exposure led to the lowest residual stress in SLM Ti6Al4V parts [34]. Therefore, 150 W power and 133-μs exposure were applied as a stress reduction strategy to strategic regions of test cases IB-3 and IB-6, while the remaining sections were built with optimum combination of parameters (200 W power and 100-μs exposure) for 50-μm layer thickness from density op-timisation trials presented in the work by Ali et al. [34,42].
ED¼ P:t
pd:h:lt
ð1Þ
where (P) stands for power, (t) for exposure time, (pd) for
point distance, (h) for hatch distance, and (lt) for layer
thick-ness. Increasing bed pre-heat temperature led to a reduction in residual stress [34,42]. Therefore, a bed pre-heat temperature of 570 °C in combination with optimum combination of pa-rameters for 50-μm layer thickness (from density optimisation trials presented in the work by Ali et al. [34,42]) resulted in a significant reduction in residual stress in SLM Ti6Al4V parts
Table 1 Chemical composition of Ti6Al4V-ELI powder
Element N C H Fe 0 Al V Ti
[34,42]. Therefore, test case IB-4 was built at 570 °C using the optimum combination of parameters (200 W power and 100-μs exposure [34,42].
Figure2a shows a representative I-Beam geometry with supports and attached with the substrate. Figure2bshows an I-Beam geometry cutoff from the substrate and supports removed.
2.4 Residual stress maps using the contour method
The contour method is a powerful technique for measuring residual stress in structures that offers some advantages com-pared with neutron diffraction and deep-hole drilling tech-niques [46–48]. Namely, it provides a two-dimensional map of residual stress on a cut surface; it can be implemented in the laboratory with widely available cutting and measurement equipment and it is not limited by the microstructure or the thickness of the component. Conceptually, the contour meth-od is simple and involves cutting the sample along a flat plane where residual stresses normal to the cut plane are to be de-termined. Creation of a free surface completely relieves the residual stress acting normal to the surface and this results in deformation of that surface. The topography of the newly created surfaces is measured and input with opposite sign as a boundary condition in an elastic finite element (FE) model to determine the cross-sectional distribution of undisturbed re-sidual stresses prior to the cut [46–48]. The main steps of the contour method are specimen cutting, surface contour mea-surement, data analysis and FE modelling.
The contour method has been applied to measure residual stress introduced by various manufacturing processes [49,50], including welding [51–55], laser-engineered net shaped [56] and SLM [57] components.
The samples were sectioned with an Agie Charmilles EDM machine with a 0.15-mm wire diameter. In order to prevent the introduction of EDM cutting artefacts close to the sample surfaces, sacrificial layers were bonded on to the surfaces of the samples [48]. The samples were figure clamped to the EDM bed table. Cutting was initiated after the specimens
and fixtures had reached thermal equilibrium within the wire EDM deionised water tank.
Likewise, the cut parts were left in the temperature-controlled CMM laboratory prior to starting surface profile measurements to allow them to reach thermal equilibrium with the laboratory environment. The topography of each cut surface was measured on a 0.025-mm grid using a Zeiss Eclipse CMM fitted with a Micro-Epsilon triangulating laser probe. The perimeters of the cut surfaces were also measured for use in the data analysis and FE modelling steps by a 2-mm diameter ruby-tipped Renishaw PH10M touch trigger probe.
For each contour cut, data analysis was conducted using the standard approach described in [47,48]. 3D FE models based on the measured perimeter of the cut parts were built using the ABAQUS code. Linear hexahedral elements with reduced integration (C3D8R) were used to mesh the models. The material was assumed to have isotropic elastic properties. Displacements derived from the processed measured surface data were applied at the FE nodes of the modelled cut surface, with the reverse sign, as boundary conditions. Three addition-al restraints were imposed on each FE model to avoid rigid body motion. Linear elastic stress analysis for each case was performed to calculate the residual stresses acting normal to the cut face.
3 Results and discussion
3.1 Density and microstructure
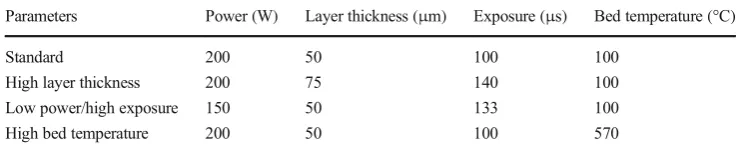
Figure3depicts density analysis for the various combination of SLM parameters used in the current work. For 30 × 30 × 10 mm blocks 200 W power and 50-μs exposure at 100 °C bed temperature results in 99.9% density [42]. Due to inter-layer defects, 75-μm SLM Ti6Al4V blocks were 99.2% dense [40]. For constant energy density of 76.9 J
mm3[40] lower power
150 W and higher exposure 133-μs combination resulted in 99.9% dense parts. Two hundred watts and 100 μs with 570 °C bed temperature resulted in 99.8% dense SLM
Table 2 SLM benchmark process
parameters Focus offset Hatch spacing (μm) Contour spacing (mm) Point distance (μm) Scanning strategy
[image:5.595.176.547.635.711.2]0 80 0.2 65 90° alternate
Table 3 SLM processing
conditions Parameters Power (W) Layer thickness (μm) Exposure (μs) Bed temperature (°C)
Standard 200 50 100 100
High layer thickness 200 75 140 100
Low power/high exposure 150 50 133 100
Ti6Al4V parts [42]. This shows that all parameter combina-tions in this study will result in a density higher than 99%.
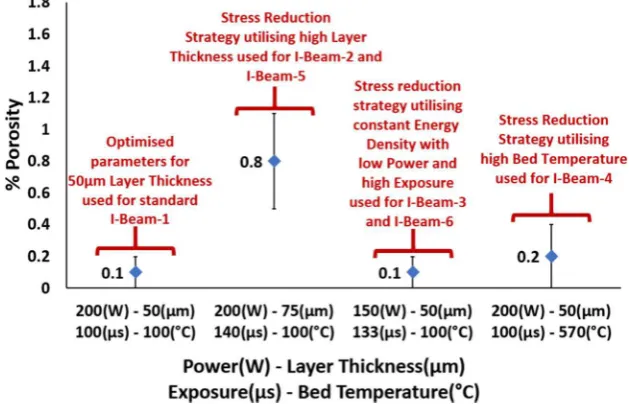
Figure4shows that irrespective of the used parameter com-binations, prior columnarβgrains, which are characteristics of SLM build Ti6Al4V parts, exists in all samples. Figure4a–c
shows that the microstructure is martensitic [40,42]. According to Ahmed et al. [58], cooling rates higher than 410°Cs leads to a fully martensitic microstructure for Ti6Al4V. The works by Ali et al. [40–42] show that the cooling rate for all combination of SLM parameters used in this study was higher than 410 °C
s and therefore lead to martensiticα′laths formation in the samples as
in Fig.4a–c. Figure4d shows that at a bed temperature of 570 °C, the sample contains a basket weave (α+β) microstruc-ture withαcolonies (highlighted by red circles). This is due to the fact that the martensitic decomposition of Ti6Al4V is in the range of 600–650 °C [59–61]; however, with a bed temperature of about 570 °C and after completion of the build, the cooling rate is only 30min, which is much lower than the cooling rate°C required for martensitic formation in Ti6Al4V [42].
3.2 Residual stress profile map for standard
processing conditions
Figure5shows the map of residual stress distribution for test case IB-1 measured using the contour method. Black dashed rectangles highlight the regions with high residual stress with the maximum residual stress level of 320 MPa. The high-stress region 2, the corners between the lower flange and
bottom section of the web identified in Fig.5are aligned with the findings reported in [62] reported indicating high levels of residual stress occur at the boundary between the substrate and DMLS samples. Likewise, the location of another high-stress region was identified as region 4; the top of the I-Beam ge-ometry is aligned with the findings reported by Casavola et al. [3], Furomoto et al. [62] and Van Belle et al. [63] in that the highest residual stress occurring in the top surface of the built component.
3.3 Strategic application of residual stress reduction
strategies
The work by Ali et al. [34] showed that various processing conditions (i.e. increasing the layer thickness to 75 μm, de-creasing the power/inde-creasing exposure time and pre-heating the powder bed) were able to reduce residual stress when uniformly applied across a cube SLM component. These stress reduction strategies were applied to various regions de-tailed in Fig.1band Table4. The resultant residual stress maps are shown in Fig.6.
3.4 Effect of strategic stress reduction strategies
on residual stress
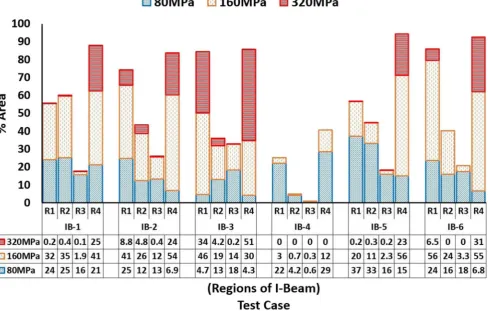
A Matlab image analysis script was developed to extract the area associated with each stress level in regions 1, 2, 3 and 4 for all the test cases shown in Table 4. Figure 7 shows
[image:6.595.58.546.51.206.2]Fig. 1 aDimensioned I-Beam geometry;bI-Beam regions for strategic application of stress reduction strategies
Table 4 Strategic stress reduction
test cases Test case Stress reduction strategy
IB-1 Standard parameters (applied to all regions)
IB-2 75-μm layer thickness to regions 2 and 4 (standard parameters to regions 1 and 3)
IB-3 150 W power and 133-μs exposure to regions 2 and 4 (standard parameters to regions 1 and 3) IB-4 570 °C bed pre-heating on Renishaw SLM-125 machine (applied to all regions)
IB-5 75-μm layer thickness for regions 1 and 3 (standard parameters to regions 2 and 4)
[image:6.595.180.548.611.710.2]corresponding areas (extracted using Matlab Image Processing), with the identified stress levels in region 4 (top of the I-Beam geometry), for all test cases studied shown in Fig.6.
3.4.1 Effect of strategic stress reduction strategies on residual stress in high-stress region 4
The results in Figs.6band8show that with the application of 75-μm layer thickness to region 4 (identified as the high-stress regions shown in Fig.5) for test case IB-2 reduced the area corresponding to the maximum residual stress (320 MPa) to 23.5%, with a 7.5% reduction compared with the standard I-Beam (test case IB-1) at similar stress level. Figures6band8
show that, test case IB-2, 160-MPa residual stress region area increased by 29.2% and the 80-MPa residual stress region area decreased by 67.5% compared with test case IB-1.
According to the results shown in Figs.6band8, a more uniform stress distribution was measured in the region 4 of test case IB-2 compared with test case IB-1. From a component point of view, this can be considered as an improvement as stress hot spots can be detrimental for the preferential failure of parts. Stress hot spot is a higher stress concentration over a
small area, causing issues such as hot tearing. The observed reduction of the area corresponding to residual stress of 320 MPa in region 4 with the application of 75-μm layer thickness could be due to the reduced cooling rate due to the application of a larger layer thickness [5,8,9,34].
The results in Figs.6cand8show that with the application of 150 W power and 133-μs exposure to region 4 for test case IB-3 increased the % area of maximum residual stress (320 MPa) in region 4 for the cross-section of test case IB-3 to 51.1%. Test case IB-3 showed an increase of 101% in 320-MPa residual stress region compared to the standard I-Beam, test case IB-1. Figures6cand8show that, for test case IB-3, 160-MPa residual stress region area reduced by 26.7% and the 80-MPa residual stress region area decreased by 79.7% com-pared with test case IB-1. Overall, the stress in region 4 (and summation of all stresses in regions 1–4) has increased. This is a surprising result considering findings from the work by Ali et al. [40] reporting the contrary.
The results in Figs.6dand8show that building the I-Beam geometry at a bed pre-heat temperature of 570 °C, for test case IB-4, resulted in reduced overall residual stress in region 4 for the cross-section of test case IB-4. Test case IB-4 showed no 320-MPa residual stress region. Figures6dand8show that,
Fig. 2 aI-Beam geometry with supports;bI-Beam geometry without supports and removed from substrate plate
[image:7.595.82.511.51.181.2] [image:7.595.230.545.509.711.2]for test case IB-4, 160-MPa residual stress region area reduced by 70.5%, while the 80-MPa residual stress region area in-creased by 34.9% compared with test case IB-1. Overall, it can be seen that region 4 of test case IB-4 presents a much lower stress distribution compared with test case IB-1. The beneficial effect of pre-heating the bed to a higher temperature on residual stress reduction has also been reported in refer-ences [11,42,64,65]. Pheating the bed results in the re-duction of thermal gradients and cooling rates, which in turn leads to the reduction of residual stress build up [42,65]. It was reported in the work by Ali et al. [42]; bed pre-heat tem-perature of 570 °C totally eliminated the residual stress from block samples.
The small high-stress area (320 MPa) in region 4 of test case IB-4 can be attributed to the differential heat flow in the web and the supports of the upper flange. Part of the top flange
on the web will have higher heat flow to the substrate com-pared with the overhanging part. This would possibly lead to the central part of the top flange having a higher cooling rate compared with the overhanging region and thus as can be seen from Fig. 6da higher stress distribution. The results from Figs.6dand8show that pre-heating the bed is the best solu-tion for the residual stress problem associated with SLM components.
The results in Figs.6eand8show that with the application of 75-μm layer thickness to region 3 (just below the identified high-stress region), for test case IB-5, reduced the percentage area of maximum residual stress (320 MPa) in region 4 for the cross-section of test case IB-5 to 23.1%. Test case IB-5 showed a reduction of 9.1% in 320-MPa residual stress region compared to the standard I-Beam, test case IB-1. Figures6e
and8show that, for test case IB-5, 160-MPa residual stress
Fig. 4 Microstructural analysis for optimised parameters used for standard I-Beam (test case 1) compared with parameters utilised for the stress reduction strategies.aStandard, 200 W, 100μs, 50μm and 100 °C;
b200 W, 140μs, 75μm and 100 °C;c150 W, 133μs, 50μm and 100 °C;
d200 W, 100μs, 50μm and 570 °C
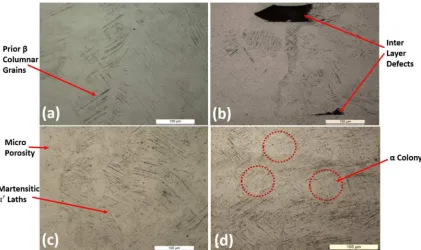
[image:8.595.87.509.52.302.2] [image:8.595.84.516.576.690.2]Fig. 6 Comparison of residual stress (MPa), contour maps for various test casesaIB-1 (standard parameters),bIB-2 (75-μm layer thickness for
region 2 and region 4),cIB-3 (150 W power and 133-μs exposure for
region 2 and region 4),dIB-4 (570 °C bed pre-heating on Renishaw
SLM-125 machine),eIB-5 (75-μm layer thickness for region 1 and
region 3) andfIB-6 (150 W power and 133-μs exposure for region 1
and region 3)
Fig. 7 Region 4 areas corresponding to different stress levels for various test casesaIB-1 (standard parameters),bIB-2 (75-μm layer thickness for
region 2 and region 4),cIB-3 (150 W power and 133-μs exposure for
region 2 and region 4),dIB-4 (570 °C bed pre-heating on Renishaw
SLM-125 machine),eIB-5 (75-μm layer thickness for region 1 and
region 3) andfIB-6 (150 W power and 133-μs exposure for region 1
[image:9.595.53.547.53.329.2] [image:9.595.52.546.411.671.2]region area increased by 35.3% and the 80-MPa residual stress region area decreased by 28.3% compared with test case IB-1. Overall, it can be seen that region 4 of test case IB-5 presents a more uniform stress distribution compared with test case IB-1. The results in Figs.6fand8show that with the application of 150 W power and 133-μs exposure to region 3 (just below the identified high-stress region 4), for test case IB-6, in-creased the percentage area of maximum residual stress (320 MPa) in region 4 for the cross-section of test case IB-6 to 30.5%. Test case IB-6 showed an increase of 20.1% in 320-MPa residual stress region compared to the standard I-Beam, test case IB-1. Figures6fand8shows that, for test case IB-6, 160-MPa residual stress region area increased by 33.8% and the 80-MPa residual stress region area decreased by 67.9% compared with test case IB-1. Overall, it can be seen that region 4 of test case IB-6 presents a more uniform stress dis-tribution compared with test case IB-1.
The results of Figs.6and8show that strategically applying stress reduction strategies to cross-sections of complex parts can lead to a reduction in residual stress. The application of stress reduction strategies to region 3 just below the high-stress region 4, for test cases IB-5 and IB-6, showed promising
results compared to test cases IB-2 and IB-3 where the stress reduction strategies were directly applied to region 4(identi-fied as a high-stress region in IB-1).
3.4.2 Effect of strategic stress reduction strategies on residual stress in high-stress Region 2
Figures6and8shows the variation of the measured residual stress in region 2 for the test cases using a strategic application of stress reduction parameters. The results in Figs.6band8
show that with the application of 75-μm layer thickness to region 2 (Identified as the high-stress regions see Fig.5), for test case IB-2, increased the percentage area of maximum residual stress (320 MPa) in region 2 for the cross-section of test case IB-2 to 4.8%. Overall, it can be seen that region 2 of test case IB-2 presents a lower overall stress distribution com-pared with test case IB-1, except for a hot spot of 320 MPa generated just below the web. The application of 150 W pow-er and 133-μs exposure to region 2 (identified as the high-stress regions see Fig. 5), for test case IB-3, increased the percentage area of maximum residual stress (320 MPa) in region 2 for the cross-section of test case IB-3 to 4.2%. The
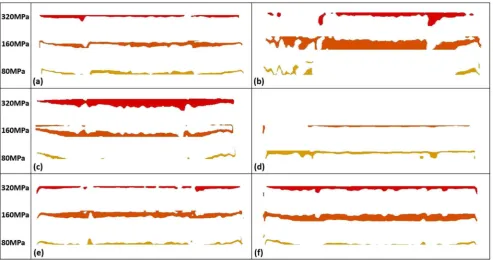
Fig. 8 Residual stress variation in various test cases (table onX-axis shows % area of each region).aIB-1 (standard parameters), bIB-2
(75-μm layer thickness for region 2 and region 4),cIB-3 (150 W
power and 133-μs exposure for region 2 and region 4),dIB-4 (570 °C
bed pre-heating on Renishaw SLM-125 machine),eIB-5 (75-μm layer
thickness for region 1 and region 3) andfIB-6 (150 W power and 133-μs
[image:10.595.56.545.59.370.2]160-MPa residual stress region area reduced by 45.5% and the 80-MPa residual stress region area decreased by 48% com-pared with test case IB-1. Overall, it can be seen that region 2 of test case IB-3 presents a lower stress distribution compared with test case IB-1, except for a hot spot of 320 MPa, just below the web. As expected, the test case IB-4 resulted in a reduction in the overall residual stress in region 2 for the cross-section of the test case. Application of 75-μm layer thickness to region 1 (just below the identified high-stress region 2), for test case IB-5, reduced the percentage area of maximum re-sidual stress (320 MPa) in region 2 for the cross-section of test case IB-5 to 0.34%. Test case IB-5 showed a reduction of 15% in 320-MPa residual stress region compared to the standard I-Beam. The 160-MPa residual stress region area decreased by 67.2% and the 80-MPa residual stress region area increased by 32.1% compared with test case IB-1. Overall, it can be seen that region 2 of test case IB-5 presents a lower stress distribu-tion compared with test case IB-1. Applying the stress reduc-tion strategy to region 1, just below the high-stress region 2 resulted in a lower overall stress state for test case IB-5 com-pared with test case IB-2 when the same strategy was applied directly to the high-stress region 2. The application of 150 W power and 133-μs exposure to region 3 (just below the iden-tified high-stress region 2), for test case IB-6, eliminated the 320-MPa stress in region 2 for the cross-section of test case IB-6. Figures6fand8show that, for test case IB-6, 160-MPa residual stress region area decreased by 29.6% and the 80-MPa residual stress region area decreased by 36.1% compared with test case IB-1. Overall, it can be seen that region 2 of test case IB-6 presents a lower stress distribution compared with test case IB-1.
The results of Figs6and8show that strategically applying stress reduction strategies to cross-sections of complex parts can lead to a reduction in residual stress. The application of stress reduction strategies to region 1 just below the high-stress region 2, for test cases IB-5 and IB-6, showed promising results compared to test cases IB-2 and IB-3 where the stress reduction strategies were directly applied to region 2 (identi-fied as a high-stress region in IB-1).
3.4.3 Effect of strategic stress reduction strategies on residual stress in region 1
The application of 75-μm layer thickness to region 2 increased the 320-MPa stressed region area in region 1 test case IB-2 by 4300% compared to the standard I-Beam, test case IB-1. The 160-MPa residual stress region area increased by 29.5% and the 80-MPa residual stress region area increased by 2.9% compared with test case IB-1. Overall, it can be seen that region 1 of test case IB-2 presents a higher stress distribution compared with test case IB-1. The application of 150 W pow-er and 133-μs exposure to region 2 for test case IB-3 increased the percentage area of maximum residual stress (320 MPa) in
region 1 by 17,000% in 320-MPa residual stress region com-pared to the standard I-Beam. The 160-MPa residual stress region area increased by 44.4% and the 80-MPa residual stress region area decreased by 80.5% compared with test case IB-1. Overall, it can be seen that region 1 of test case IB-3 presents a higher stress distribution compared with test case IB-1.
As expected with the application of 570 °C pre-heat for test case IB-4, it resulted in a reduction in the overall residual stress in region 1.
The application of 75-μm layer thickness to region 1 did not affect the % area of maximum residual stress (320 MPa) in region 1 for the cross-section of test case IB-5. One hundred sixty-megapascal residual stress region area decreased by 37.8% and the 80-MPa residual stress region area increased by 53.9% compared with test case IB-1. Overall, it can be seen that region 1 of test case IB-5 presents a lower stress distribu-tion compared with test case IB-1. Applying the stress reduc-tion strategy to region 1, just below the high-stress region 2 resulted in a lower overall stress state for test case IB-5 com-pared with test case IB-2 when the same strategy was applied directly to the high-stress region 2.
The application of 150 W power and 133-μs exposure to region 1 (just below the identified high-stress region 2), for test case IB-6, increased the 320 MPa stress area in region 1 for the cross-section of test case IB-6 by 3150% compared with test case IB-1. One hundred sixty-megapascal residual stress region area increased by 77.1% and the 80-MPa residual stress region area decreased by 1.7% compared with test case IB-1. Overall, it can be seen that region 1 of test case IB-6 presents a higher stress distribution compared with test case IB-1.
The application of stress reduction strategies to region 1, just below the high-stress region 2, for test cases 5 and IB-6, showed promising results compared to test cases IB-2 and IB-3 where the stress reduction strategies were directly ap-plied to region 2 (identified as a high-stress region in IB-1). Even though Test case IB-6 showed an increase in the residual stress distribution in region 1.
3.4.4 Effect of strategic stress reduction strategies on residual stress in region 3
higher stress distribution compared with test case IB-1, even though the 320-MPa hot spots are eliminated. The application of stress reduction strategies to region 3 just below the high-stress region 4, for test cases IB-5 and IB-6, showed promising results compared to test cases IB-2 and IB-3 where the stress reduction strategies were directly applied to region 4 (identi-fied as a high-stress region in IB-1).
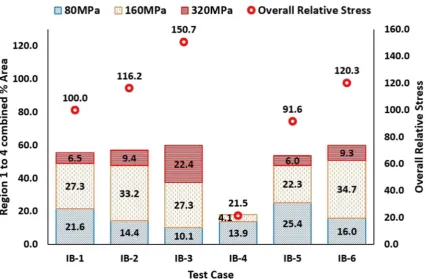
3.5 Overall effect of strategic stress reduction
strategies on residual stress
Figure9 shows the overall variation of residual stress for various test cases with strategic application of stress reduction parameters. The results in Fig.9show that overall pre-heating the bed is the most viable solution for residual stress reduction in SLM Ti6Al4V components. The application of 75-μm lay-er thickness to region 1 and region 3 (just below the identified high-stress regions see Fig.5), for test case IB-5, resulted in an overall reduction in the residual stress in the I-Beam geometry compared to standard processing conditions (~ 8.5% overall reduction when considering 80–320-MPa stresses only). Application of constant energy densities while reducing laser power and increasing exposure time was not effective in over-all reducing stress (increased overover-all stress) contrary to find-ings in the work by Ali et al. [40] that tested simple block specimens.
Results from the strategic application of stress reduction strategies across different regions of the cross-section of an I-Beam geometry showed a redistribution of residual stress profile. It can be seen from the analysis in Sections 3.4.1,
3.4.2,3.4.3and3.4.4that strategic application of stress reduc-tion strategies can be a viable solureduc-tion for reducing stress in critical regions of a component.
4 Conclusions
Irrespective of the region of application, all the applied and theorised stress reduction strategies resulted in redistribution/ alteration of the original residual stress profile across the com-ponent. Contrary to other works, the use of lower powers and increased exposure times (for comparable standard processing energy density) increased the overall stress within component compared to standard fixed SLM processing parameters (by 20–50% depending on regions applied for measured 80– 320-MPa residual stress range). These earlier studies tested simple block specimens and hole drilling was used for stress analysis. Therefore, results may not be applicable to this study where a change in component cross-section is experienced. As expect-ed, the application of a 570 °C in situ pre-heat resulted in an overall reduction in residual stress in the I-Beam sample across all regions.
Fig. 9 Overall residual stress variation in various test cases.aIB-1
(standard parameters),bIB-2 (75-μm layer thickness for region 2 and
region 4),cIB-3 (150 W power and 133-μs exposure for region 2 and
region 4),dIB-4 (570 °C bed pre-heating on Renishaw SLM-125
[image:12.595.86.513.402.681.2]Applying an increased 75-μm layer thickness just below the identified high-stress regions resulted in a reduction in residual stress in the I-Beam geometry, with an overall stress reduction of 8.5% (for residual stresses within the range of 80–320 MPa). This reduction in overall stress by temporarily applying the stress reduction strategy below layers that are anticipated to be highly stressed presents a positive opportu-nity for this technology. Current SLM systems anticipate and adapt processing parameters for support structures and the outer surface of structures (skin, overhanging surfaces); how-ever, the adaptation for anticipated geometry-related stresses is not fully exploited. Temporarily switching from standard build parameters to those that are known to assist in redistributing or reducing stresses from problematic/sensitive locations within a component (i.e. prone to warpage) would be a key step in developing a more intelligent process. An intel-ligent process will be more reactive and engaged with com-ponent fabrication. It will allow parameter adaption on the fly, anticipating residual stresses layers ahead and thus reduce build and in-service part failures.
Acknowledgements Contour measurements and analyses were conduct-ed at the contour facility at the Open University in Milton Keynes. The authors would like to acknowledge the contribution of staff at the Open University staff including Peter Ledgard who conducted the contour cuts and Dr. Sanjooram Paddea for data analyses.
Funding information The author would like to thank TWI and the EPSRC Future Manufacturing Hub in Manufacture using Advanced Powder Processes (MAPP) (EP/P006566/1) for their support during this investigation.
Open AccessThis article is distributed under the terms of the Creative C o m m o n s A t t r i b u t i o n 4 . 0 I n t e r n a t i o n a l L i c e n s e ( h t t p : / / creativecommons.org/licenses/by/4.0/), which permits unrestricted use, distribution, and reproduction in any medium, provided you give appro-priate credit to the original author(s) and the source, provide a link to the Creative Commons license, and indicate if changes were made.
References
1. Burns M (1993) Automated fabrication: improving productivity in manufacturing. Prentice Hall,–Englewood Cliffs
2. Gibson I, Rosen DW, Stucker B (2009) Additive manufacturing technologies: rapid prototyping to direct digital manufacturing. Springer, pp 1–14
3. Casavola C, Campanelli SL, Pappalettere C (2008) Experimental analysis of residual stresses in the Selective Laser Melting process. In: Proceedings of the XIth International Congress and Exposition. Orlando, Florida USA
4. Papadakis, L, A. Loizou, Risse J, Bremen S, Schrage J. A thermo-mechanical modeling reduction approach for calculating shape dis-tortion in SLM manufacturing for aero engine components. In: VRAP Advanced Research in Virtual and Rapid Prototyping, Portugal
5. Kruth J-P, Deckers J, Yasa E, Wauthlé R (2012) Assessing and comparing influencing factors of residual stresses in selective laser
melting using a novel analysis method. Proc Inst Mech Eng B J Eng Manuf 226(6):980–991
6. Kruth J-P, Yasa E, Deckers J, Thijs L, Van Humbeeck J (2010) Part and material properties in selective laser melting of metals. In: 16th International Symposium on Electromachining (ISEM XVI), Shanghai-China
7. Matsumoto M, Shiomi M, Osakada K, Abe F (2002) Finite element analysis of single layer forming on metallic powder bed in rapid prototyping by selective laser processing. Int J Mach Tools Manuf 42(1):61–67
8. Zaeh MF, Branner G (2010) Investigations on residual stresses and deformations in selective laser melting. Prod Eng 4(1)
9. Van Belle LV, Boyer G, Claude J (2013) Investigation of residual stresses induced during the selective laser melting process. Key Eng Mater 554-557:1828–1834
10. Tatsuaki Furumoto TU, Aziz MSA, Hosokawa A, Tanaka R (2010) Study on reduction of residual stress induced during rapid tooling process- influence of heating conditions on residual stress. Key Eng Mater 487(488):785–789
11. Roberts IA (2012) Investigation of residual stresses in the laser melting of metal powders in additive layer manufacturing. University of Wolverhampton, p 246
12. Joe Elambasseril SF, Bringezu M, Brandt M (2012) Influence of process parameters on selective laser melting of Ti 6Al-4V compo-nents. RMIT University School of Aerospace, Mechanical and Manufacturing Engineering (SAMME)
13. Das S, Wohlert M, Beaman J, Bourell D (1998) Producing metal parts with selective laser sintering/hot isostatic pressing. JOM 50(12):17–20
14. Verhaeghe F, Craeghs T, Heulens J, Pandelaers L (2009) A prag-matic model for selective laser melting with evaporation. Acta Mater 57(20):6006–6012
15. Lu Y, Wu S, Gan Y, Huang T, Yang C, Junjie L, Lin J (2015) Study on the microstructure, mechanical property and residual stress of SLM Inconel-718 alloy manufactured by differing island scanning strategy. Opt Laser Technol 75:197–206
16. Dunbar AJ, Denlinger ER, Heigel J, Michaleris P, Guerrier P, Martukanitz R, Simpson TW (2016) Development of experimental method for in situ distortion and temperature measurements during the laser powder bed fusion additive manufacturing process. Addit Manuf 12(Part A):25–30
17. Nickel AH, Barnett DM, Prinz FB (2001) Thermal stresses and deposition patterns in layered manufacturing. Mater Sci Eng A 317(1–2):59–64
18. Gusarov AV, Pavlov M, Smurov I (2011) Residual stresses at laser surface remelting and additive manufacturing. Phys Procedia 12: 248–254
19. Cheng B, Shrestha S, Chou K (2016) Stress and deformation eval-uations of scanning strategy effect in selective laser melting. Addit Manuf 12(Part B):240–251
20. Safdar S, Pinkerton AJ, Li L, Sheikh MA, Withers PJ (2013) An anisotropic enhanced thermal conductivity approach for modelling laser melt pools for Ni-base super alloys. Appl Math Model 37(3): 1187–1195
21. Vasinonta A, Beuth JL, Griffith M (2006) Process maps for predicting residual stress and melt pool size in the laser-based fab-rication of thin-walled structures. J Manuf Sci Eng 129(1):101–109 22. Van Zyl I, Yadroitsev I, Yadroitsava I (2015) Residual stresses in
direct metal laser sintered parts
23. Parry L, Ashcroft IA, Wildman RD (2016) Understanding the effect of laser scan strategy on residual stress in selective laser melting through thermo-mechanical simulation. Addit Manuf 12(Part A):1– 15
25. Wu AS, Brown DW, Kumar M, Gallegos GF, King WE (2014) An experimental investigation into additive manufacturing-induced re-sidual stresses in 316L stainless steel. Metall Mater Trans A 45(13): 6260–6270
26. Mercelis P, Kruth J-P (2006) Residual stresses in selective laser sintering and selective laser melting. Rapid Prototyp J 12(5):254–265 27. Shiomi M, Osakada K, Nakamura K, Yamashita T, Abe F (2004) Residual stress within metallic model made by selective laser melt-ing process. CIRP Ann Manuf Technol 53(1):195–198
28. Yadroitsev I, Krakhmalev P, Yadroitsava I (2014) Selective laser melt-ing of Ti6Al4Valloy for biomedical applications: temperature monitor-ing and microstructural evolution. J Alloys Compd 583:404–409 29. Manvatkar V, De A, DebRoy T (2015) Spatial variation of melt
pool geometry, peak temperature and solidification parameters dur-ing laser assisted additive manufacturdur-ing process. Mater Sci Technol 31(8):924–930
30. Alimardani M, Toyserkani E, Huissoon JP, Paul CP (2009) On the delamination and crack formation in a thin wall fabricated using laser solid freeform fabrication process: an experimental–numerical investigation. Opt Lasers Eng 47(11):1160–1168
31. Brückner F, Lepski D, Beyer E (2007) Modeling the influence of process parameters and additional heat sources on residual stresses in laser cladding. J Therm Spray Technol 16(3):355–373 32. Taha MA et al (2012) On selective laser melting of ultra high carbon
steel: effect of scan speed and post heat treatment Selektives Laserschmelzen von hoch kohlenstoffhaltigen Stählen: Einfluss der Abtastgeschwindigkeit und der Wärmenachbehandlung. Mater Werkst 43(11):913–923
33. Ilie A, Ali H, Mumtaz K (2017) In-built customised mechanical failure of 316L components fabricated using selective laser melting. Technologies 5(1):9
34. Ali H (2017) Evolution of Residual Stress in Ti6Al4V components fabricated using Selective Laser Melting. In: Mechanical engineer-ing. The University of Sheffield
35. Sufiiarov VS, Popovich AA, Borisov EV, Polozov IA, Masaylo DV, Orlov AV (2017) The effect of layer thickness at selective laser melting. Procedia Eng 174:126–134
36. Guan K et al (2013) Effects of processing parameters on tensile properties of selective laser melted 304 stainless steel. Mater Des 50:581–586
37. Delgado J, Ciurana J, Rodríguez CA (2012) Influence of process parameters on part quality and mechanical properties for DMLS and SLM with iron-based materials. Int J Adv Manuf Technol 60(5):601–610
38. Mugwagwa L et al (2016) A methodology to evaluate the influence of part geometry on residual stresses in selective laser melting 39. Ali H, Ghadbeigi H, Mumtaz K Effect of scanning strategies on
residual stress and mechanical properties of selective laser melted Ti6Al4V. Mater Sci Eng A
40. Ali H, Ghadbeigi H, Mumtaz K (2018) Processing parameter ef-fects on residual stress and mechanical properties of selective laser melted Ti6Al4V. J Mater Eng Perform 27(8):4059–4068 41. Ali H, Ghadbeigi H, Mumtaz K (2018) Residual stress development
in selective laser-melted Ti6Al4V: a parametric thermal modelling approach. Int J Adv Manuf Technol 97(5):2621–2633
42. Ali H, Ma L, Ghadbeigi H, Mumtaz K (2017) In-situ residual stress reduction, martensitic decomposition and mechanical properties en-hancement through high temperature powder bed pre-heating of selective laser melted Ti6Al4V. Mater Sci Eng A 695:211–220 43. Grant PV, Lord JD, Whitehead PS (2006) Good Practice Guide No.
53-Issue 2: The Measurement of Residual Stress by Incremental Hole Drilling Technique. The National Physical Laboratory, UK 44. Rossini NS et al (2012) Methods of measuring residual stresses in
components. Mater Des 35(0):572–588
45. Withers PJB, Bhadeshia HKDH (2001) Residual stress. Part 1– measurement techniques. Mater Sci Technol 17(4):355–365
46. Prime MB (2000) Cross-sectional mapping of residual stresses by measuring the surface contour after a cut. J Eng Mater Technol 123(2):162–168
47. Prime MB, DeWald AT (2013)The Contour Method. In: Schajer GS (ed) Practical Residual Stress Measurement Methods, pp 109–138 48. Hosseinzadeh F, Kowal J, Bouchard PJ (2014) Towards good
prac-tice guidelines for the contour method of residual stress measure-ment. J Eng 2014:453–468
49. DeWald AT, Rankin JE, Hill MR, Lee MJ, Chen HL (2004) Assessment of tensile residual stress mitigation in alloy 22 welds due to laser peening. J Eng Mater Technol 126:465–473 50. DeWald AT, Hill MR (2009) Eigenstrain-based model for prediction
of laser peening residual stresses in arbitrary three-dimensional bod-ies, part 2: model verification. J Strain Anal Eng Des 44(1):13–27 51. Zhang Y, Ganguly S, Edwards L, Fitzpatrick ME (2004)
Cross-sectional mapping of residual stresses in a VPPA weld using the contour method. Acta Mater 52(17):5225–5232
52. Ganguly S et al (2003) Validation of the contour method of residual stress measurement in a MIG 2024 weld by neutron and synchro-tron X-ray diffraction AU - Zhang, Y. J Neusynchro-tron Res 11(4):181–185 53. Hosseinzadeh F, Toparli MB, Bouchard PJ (2011) Slitting and con-tour method residual stress measurements in an edge welded beam. J Press Vessel Technol 134(1):011402–011402-6
54. Woo W, Choo H, Prime MB, Feng Z, Clausen B (2008) Microstructure, texture and residual stress in a friction-stir-processed AZ31B magnesium alloy. Acta Mater 56(8):1701–1711 55. Prime MB et al (2006) Residual stress measurements in a thick, dissimilar aluminum alloy friction stir weld. Acta Mater 54(15): 4013–4021
56. Rangaswamy P et al (2005) Residual stresses in LENS® compo-nents using neutron diffraction and contour method. Mater Sci Eng A 399(1):72–83
57. Vrancken B et al (2014) Residual stress via the contour method in compact tension specimens produced via selective laser melting. Scr Mater 87(Supplement C):29–32
58. Ahmed T, Rack HJ (1998) Phase transformations during cooling in α+βtitanium alloys. Mater Sci Eng A 243(1–2):206–211 59. Tan X et al (2016) Revealing martensitic transformation andα/β
interface evolution in electron beam melting three-dimensional-printed Ti-6Al-4V. Sci Rep 6:26039
60. Xu W, Sun S, Elambasseril J, Liu Q, Brandt M, Qian M (2015) Ti-6Al-4V additively manufactured by selective laser melting with superior mechanical properties. JOM 67(3):668–673
61. Welsch G, Boyer R, Collings EW (1993) Materials properties hand-book: titanium alloys. ASM International
62. Furumoto T et al (2010) Study on reduction of residual stress in-duced during rapid tooling process: influence of heating conditions on residual stress. Key Eng Mater 447
63. van Belle L, Vansteenkiste G, Claude Boyer J (2012) Comparisons of numerical modelling of the selective laser melting. 504-506:1067–1072 64. Vora P, Mumtaz K, Todd I, Hopkinson N (2015) AlSi12 in-situ alloy formation and residual stress reduction using anchorless se-lective laser melting. Addit Manuf 7:12–19
65. Vrancken B et al. Influence of preheating and oxygen content on Selective Laser Melting of Ti6Al4V. In: Proceedings of the 16th RAPDASA Conference. RAPDASA, Annual International Conference on Rapid Product Development Association of South Africa 4–6 November 2015. Pretoria, South Africa