Int. J. Electrochem. Sci., 12 (2017) 10589 – 10598, doi: 10.20964/2017.11.28
International Journal of
ELECTROCHEMICAL
SCIENCE
www.electrochemsci.org
Short Communication
Electrochemical Corrosion Behavior of the Copper Current
Collector in the Electrolyte of Lithium-ion Batteries
Shuowei Dai1,2, Jian Chen1,2, Yanjie Ren1,2,*, Zhimin Liu1,2, Jianlin Chen1,2, Cong Li1,2, Xinyuan Zhang1,2, Xiao Zhang1,2 and Taofang Zeng1,2
1
School of Energy and Power Engineering, Changsha University of Science & Technology, Changsha, Hunan 410014, China
2
Key Laboratory of Energy Efficiency and Clean Utilization, Education Department of Hunan Province, Changsha University of Science & Technology, Changsha, Hunan 410014, China
*
E-mail: yjren1008@163.com
Received: 24 July 2017 / Accepted: 3 September 2017 / Published: 12 October 2017
Copper is usually used as an anode current collector in lithium-ion batteries. Its stability in the organic electrolyte impacts the performance of the lithium-ion battery. In this paper, the corrosion mechanism of the copper current collector in the electrolyte of lithium-ion batteries was examined by electrochemical impedance spectroscopy(EIS) and polarization measurements. The microstructures of copper were observed by scanning electron microscopy(SEM) and energy dispersive spectroscopy (EDS). The fitted results of electrochemical impedance spectroscopy showed that Rf and Rt increased
at the initial stage of exposure to the electrolyte indicating that a protective layer formed. After exposure to the electrolyte for up to 720 h, pitting holes could be clearly observed on the surface of copper.
Keywords: Lithium-ion Batteries, Copper current collector, Electrochemical impedance spectra, Corrosion mechanism
1. INTRODUCTION
Lithium-ion batteries have been widely used in mobile phones and other portable electronic devices as a clean and efficient secondary battery because of their high volume and energy densities in comparison with other rechargeable batteries. The stability of active materials in the battery is crucial to the maintenance of high power and energy density of lithium-ion batteries. [1-3] To date, a variety of anodic and cathodic materials, such as LiMn2O4, Co3O4, etc, have been studied under different
active substance, collect current, minimize the internal resistance and enhance cycling stability. [7] However, current collectors usually suffer from severe corrosion damage in the electrolyte of lithium-ion batteries. Unfortunately, the corroslithium-ion products on the current collectors separate electrode materials and current collectors, further impacting the performance of lithium-ion batteries.
Previous studies focused primarily on the corrosion behavior of aluminum current collectors in lithium-ion batteries. Zhang et al observed that aluminum current collectors are susceptible to localized corrosion in battery electrolytes containing LiPF6. [8] Hyams et al compared the corrosion resistance
of aluminum current collectors in high-power lithium-ion batteries with cycling at 25°C and 45°C. The results showed that there is an increase in percentage of pit area, the number of pits, pit size distribution and pit depth at 45°C. [9] Kramer et al. proposed that carbonates and particular lactones can cause intense corrosion of the aluminum collector in lithium-ion batteries, but adiponitrile results in insignificant corrosion when used as a pure solvent. [10] Streipert argued that the formation of a passivation films on aluminum and the decomposition of LiPF6 are ongoing processes, which permit
the dissolution phenomenon to occur in long-term applications. [11]
As a negative current collector, copper is also subjected to a continuous corrosion in the organic conductive solution because of the residual water. Recent research on the degradation of the copper current collector was devoted primarily to its corrosion products and variations in properties resulting from the decomposition of electrolytes. Shu et al revealed the possible corrosion products of copper in the electrolyte of a lithium-ion battery and considered that the existence of HF destroys the oxide film of inorganic compounds such as copper oxides. [12] Peng suggested that the reduction of the electrolytes provided limited protection for the Cu foil in ethylene carbonate (EC)/ dimethyl carbonate (DMC) solutions. [13]
However, until now, there is little information available about the corrosion mechanism of copper in the electrolyte of lithium-ion batteries. With an aim to obtain more information about the degradation of copper, the corrosion performance of copper in the electrolyte of lithium-ion batteries was investigated by electrochemical methods in the present study.
2. EXPERIMENTAL PROCEDURES
2.1 Sample preparation
Strips (5 mm x 5 mm x 10 mm) of copper (99.95%, commercial T1 pure copper) were polished and cleaned with acetone, followed by dry-air blowing to remove the solvent residue and dirt. All electrochemical measurements were carried out at ambient temperature in an electrolyte containing 1 M LiPF6 in a mixture of ethylene carbonate (EC), methyl ethyl carbonate (EMC) and dimethyl
carbonate (DMC) (1:1:1, V/V/V). The containers were sealed to avoid the ingression of oxygen.
2.2 Electrochemical measurements
of the coated samples with a working surface area of 0.5 cm2 were conducted with a Zahner (Zennum) potentiostat/galvanostat in the electrolyte at room temperature. Potentiodynamic polarization was undertaken with a potential scanning rate of 60 mV min−1. Electrochemical impedance measurements were conducted in the range of 0.01 Hz–100 kHz, with an amplitude of 10 mV for the input sine wave voltage.
2.3 Microstructure characterization
The corroded specimens were cleaned with deionized water and dried after corrosion testing. The microstructure of the samples before and after the immersion test was examined by a JSM-6360LV scanning electron microscopy (SEM) system. The analysis of elemental compositions was examined by energy dispersive spectroscopy (EDS).
3. RESULTS AND DISCUSSION
3.1 Surface morphology
Figure 1. Surface morphology of copper at different stages with EDS analysis: (a) before the immersion test, (b) immersed for 480 h in the electrolyte, and (c) immersed for 720 h in the electrolyte
[image:3.596.86.508.372.612.2]
pitting corrosion in the electrolyte(as shown in Figure 1b). After immersion for 720 h, a corrosion product layer with enlarged pitting holes and micro-cracks can be observed. The pitting holes exhibit a certain depth. EDS results reveal that only Cu is detected for as-received copper. In the case of the specimen exposed to the electrolyte for 480 h, Cu, F and O elements are found in the holes, indicating that the corrosion products are composed of copper fluorides and copper oxides. For the specimen immersed for 720 h, Cu, C, O, F and P are detected in the holes, as also reported by Shu et al. [12] In comparison, the elemental concentrations (except for Cu) of the latter are higher than the former. The existence of F or P also proves that LiPF6 in the electrolyte has a pronounced influence on the
corrosion damage of copper current collectors. Zhao et al argued that the trace amount of water in the electrolyte reacts with the decomposition products of LiPF6 and produces HF, which is aggressive
towards the copper current collector. [14] The underlying corrosion mechanism is elaborated in a latter section.
3.2 Corrosion behavior of copper in the electrolyte 3.2.1 Potentiodynamic polarization curves
-8 -7 -6 -5 -4 -3
-0.4 -0.3 -0.2 -0.1 0.0 0.1 0.2 0.3 0.4
Po
te
n
ti
a
l/
V
Logi/A.cm2
[image:4.596.192.396.378.535.2]3h 24h 720h
[image:4.596.68.526.632.710.2]Figure 2. Potentiodynamic curves of copper in the electrolyte after immersion for 3 h, 24 h and 720 h ( scanning rate: 1 mV/s)
Table 1. Electrochemical parameters of the potentiodynamic curves of copper in the electrolyte Time(h) Ecorr(V) Icorr(μA.cm
-2
) βa(V/Dec) βc(V/Dec) Rp(Ωcm
-2
)
3 -0.054 0.416 0.195 0.171 9.423E4
24 -0.161 0.047 0.159 0.127 6.523E5
720 -0.152 2.081 0.062 0.179 9.388E3
corrosion potential in all cases. The corrosion potential moves towards the cathodic direction after immersion for 24 h and 720 h compared with that exposed to the electrolyte for 3 h. Electrochemical
parameters namely, corrosion potential (Ecorr) , corrosion current density (Icorr), and cathodic and anodic
Tafel slopes (βc and βa ) were calculated from the Tafel extrapolation of the polarization plots. The
polarization resistance of Rp are determined by the equation as follows: [15]
2.3 ( )
a c p
corr a c
R
I
(1) All parameters are listed in Table 1. The corrosion current densities of specimens corroded for 3 h, 24 h and 720 h are 0.416 μA.cm-2, 0.047 μA.cm-2 and 2.081 μA.cm-2, respectively. Compared with the specimen corroded for 3 h, the corrosion rate for the copper immersed for 24 h decreases approximately one order of magnitude, indicating that corrosion processes are suppressed. However, after immersion for 720 h, the corrosion current density increases approximately two orders of magnitude, showing an enhanced corrosion rate. The variation of Rp is also consistent with the above
analysis.
3.2.2 Electrochemical impedance spectroscopy
Typical Nyquist and Bode plots for the corrosion of copper in the electrolyte containing ethylene carbonate (EC) and methyl ethyl carbonate(EMC) and dimethyl carbonate (DMC) after immersion for varying lengths of time are shown in Figure 3. All spectroscopy plots consist of two depressed capacitive loops. The capacitive loop at high frequency corresponds to the impedance response of the corrosion product layer on the copper, while the loop at low frequency was related to the responses from the electrochemical reaction occurring at the electrolyte/copper interface. The capacitive loops expand significantly from 3 h to 24 h indicating the formation of a protective film on the surface of copper, which is duly supported by the increase in the phase angle in the low and middle frequency regions as shown in Figure 3b. However, the capacitive loop contracts from 48 h to 150 h. Correspondingly, the contraction is accompanied by the gradual depression of the phase angle, which suggests the dissolution of the corrosion product. With the extension up to 720 h, the impedance decreases in fluctuation.
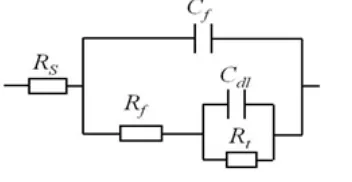
The impedance behavior of the copper is fitted using the equivalent electrical circuit (EEC) shown in Figure 4, where Rs represents the electrolyte resistance, Rf and Qf represent the resistance and
capacitance of the corrosion product layer that forms on the copper surface, and Rt and Qdl represent
the charge transfer resistance and the double layer capacitance. The simulated impedance data are in good agreement with the experimental data shown in Figure 3, where symbols represent the experimental data and the lines represent the fitting. In this EEC, a constant phase element, CPE (Q), replaces a capacitor (C) to take into account the surface reactivity, surface heterogeneity, roughness, electrode porosity and current and potential distributions associated with the electrode geometry. [16]
The impedance of the CPE can be expressed as Equation 2: [17]
n CPE j
Y
Z 1 ( ) 0
where Y0 represents the admittance magnitude of the CPE and n is the exponential term. Pure
capacitance behavior of the corrosion system is represented by n = 1. However, the value of n usually varies from 0 to 1 for a practical system. A small value of n is often attributed to a rough electrode surface. [18] The maximum error is less than 2.5% in |z| and less than 4% for the angle of all fitted impedance spectra. Figure 5 shows a representative error plot for the copper.
0.0 5.0x10⁴
1.0x10⁵ 1.5x10⁵ 2.0x10⁵ 2.5x10⁵ 3.0x10⁵ 0.0 5.0x10⁴ 1.0x10⁵ 1.5x10⁵ 2.0x10⁵ 2.5x10⁵ 3.0x10⁵ Z "/o h m.cm 2 Z'/ohm.cm2 3h 24h 72h 150h 360h 480h 720h a 10-2 10-1 100 101 102 103 104 105 0 30 60 90 102 103 104 105 p h a se a n g le/ d eg Frequency/Hz |Z |/ o h m.cm 2 b
[image:6.596.108.487.174.304.2]Figure 3. (a) Nyquist and (b) Bode plots for the copper in electrolyte at room temperature with prolonged immersion times (symbols: experimental data; line: fitted data)
[image:6.596.215.391.345.436.2]Figure 4. Equivalent circuit for fitting the impedance data of copper in the electrolyte
Figure 5. Error plots for calculated values of |z| and the phase angle of copper immersed for 24h in the electrolyte.
Figure 6 presents the fitted Rf and Rt of copper in the electrolyte. Rf increases after immersion
for 24 h and then decreases upon further exposure to 96 h. Similar fluctuations exist up to 420 h and then a decrease until to 720 h. However, Rt increases significantly after immersion for 24h.
Subsequently, Rt declines suddenly and remain nearly stable from 72 h to 720 h of immersion. Rf
represents the resistance of the oxide layer or corrosion product layer on the copper surface, while Rt is
[image:6.596.192.417.472.601.2]
Rt at the initial stage (i.e. 3 h -24 h) can be attributed to the formation of a protective film on the copper
that inhibits the attack of aggressive species. After immersion for 420 h, Rf decreases significantly,
[image:7.596.101.485.166.307.2]indicating that a porous corrosion product layer forms. The results are consistent with those from the potentiodynamic curves, as shown in Figure 2.
Figure 6. The fitted (a)Rf and (b) Rt versus time for the corrosion of copper in the electrolyte
3.3 Proposed corrosion mechanism of copper in the electrolyte
The decrease in impedance confirms that the copper is subject to corrosion damage in the electrolyte of lithium-ion batteries. It has been accepted that the trace amount of water in the electrolyte causes the corrosion of current collectors of lithium-ions batteries. [19] Copper could be oxidized by water with the formation of copper oxide, meanwhile, it acts as anodic reaction of electrochemical corrosion. [20] The reaction is as follows:
+
-2 x
Cu + xH OCuO + 2xH + 2xe (3) The oxygen reduction as a cathodic reaction could be negligible in such a closed system. However, EC and DMC in the electrolyte could be reduced to compounds that absorb on the surface of copper: [21, 22]
- +
2 2 2
EC + 2e + 2Li LiCH CH OCO Li (4)
- +
3 3 2
DMC + e + Li CH + CH OCO Li (5) Meanwhile, LiPF6 could decompose spontaneously and react with the trace amount of water in
the electrolyte, producing HF and PF3O. [23] HF in the trace amount of water results in a significant
decrease in pH. Copper can hardly be corroded in a deoxygenated acid solution. [24-25] Nevertheless, copper oxide would dissolve in the solution containing HF. The reactions are expressed as follows:
6 5
LiPF LiF+PF (6)
5 2 3
PF +H O 2HF+PF O (7)
x 2 2
CuO +2xHFCuF +xH O (8)
0 100 200 300 400 500 600 700
5.0x10⁵
1.0x10⁶
1.5x10⁶
2.0x10⁶
2.5x10⁶
R
t
(o
h
m.cm
2)
Time(h)
b
0 100 200 300 400 500 600 700 800 0.0
2.0x10⁴
4.0x10⁴ 6.0x10⁴
Rf
(o
h
m.cm
2)
Time(h)
Therefore, the increasing impedance of copper after exposure to the electrolyte for 24 h (as shown in Figure 3) correlates with the consumption of water and the formation of copper oxide. In addition, it is acknowledged that solid electrolyte interphase (SEI) layer could form on the metal because of the electrolyte decomposition during storage. [26] This also contributes to suppressing the anodic dissolution of copper. Subsequently, F- stemming from the decomposition of LiPF6 absorbs on
the copper oxide and results in its dissolution, which suggests a decrease in the corrosion resistance. As mentioned above, the trace amount of water promotes the formation of CuOx and HF, while F
-would attack CuOx accompanied by the generation of water. Therefore, Rf fluctuates during immersion
up to 420 h in the electrolyte..
Theoretically, electrochemical corrosion is a process that initially forms oxide films and subsequently destroys the films. [27] As the reaction in Eq (8) occurs, galvanic coupling is then established between the sites of attacked copper oxide and the intact sites, which form small anodes where metal dissolution occurs, and the remainder of the surface where the cathodic reaction occurs. Namely, pitting corrosion induced by F- occurs on the surface of copper. Moreover, the H+ produced by reaction (3) decreases the pH locally, resulting in an activation solution of the copper oxide. With an increase in the concentration of metal ions and accumulation of positive charge, a strong electric field is formed and attracts PF6- or decomposed F- into the inside of the holes. Under the combined
effect of the H+ and F-, the pitting holes continues to dissolve by self-catalyzed effect. [28] Therefore, the holes develop with extended exposure time. The elements P and F detected in the pitting holes, as shown in Figure 1 b, also confirm the above analysis. With the extension of the immersion time in the electrolyte, the various organic and inorganic compounds produced by the spontaneous decomposition or electrochemical reduction of the electrolyte (EM and DMC) deposit on the surface of copper with the formation of a porous corrosion product layer. [12] Thus, Rf decreases after immersion in the
electrolyte for 420 h. In addition, additional C and O can be observed compared with P and F in the pitting holes on the copper after corrosion for 720 h, as shown in Figure 1c.
Copper usually suffers pitting corrosion after exposure to different conditions. In many cases, copper pitting corrosion proceeds via coupling between the oxidation of copper at small anode sites and reduction of oxidants such as oxygen on large surface areas. [29] In this work, the copper current collector tends to suffer pitting corrosion in the non-aqueous electrolyte, in which the electrochemical reduction of an organic electrolyte as the cathodic reaction couples with the dissolution of copper. In fact, there exists a kind of complex reaction in the electrolyte during long-term storage. It should be noted that this study concerns the corrosion behavior of copper in the organic electrolyte of lithium-ion batteries based on electrochemical principles, and it provides certain information about the corrosion behavior of copper in the electrolyte during long-term immersion. Our research further includes the variation in the electrolyte with time and its effects on the microstructural evolution of copper.
4. CONCLUSIONS
specimens immersed in the electrolyte for 3 h, the corrosion current density decreases by one order of magnitude for the specimens exposed to the electrolyte for 24 h, while it increases by more than one order of magnitude for 720 h of immersion. Similarly, Rf and Rt increase after immersion in the
electrolyte for 24 h, which correlates with the oxidation of copper by the trace amount of water in the electrolyte and the formation of a solid electrolyte interphase (SEI) layer. Then, in the case of Rf, a
fluctuation exists until 420 h of exposure to the electrolyte, which is due to the formation and dissolution of oxygenated compounds on the copper surface. HF stemming from the decomposition of LiPF6 in the electrolyte causes the successive pitting corrosion on the surface of copper because of a
self-catalyzed effect.
ACKNOWLEDGMENTS:
This work was supported by the National Natural Science Foundation of China (No.51471036), Key Project of Hunan Province Science and Technology Department (No.2014GK2010), and funded by Changsha University of Science & Technology (No.CX2017SS15) and Hunan Province 2011 Collaborative Innovation Center of Clean Energy and Smart Grid.
References
1. T. Horiba, P. IEEE., 102(6) (2014) 939-950. 2. A. Yoshino, Angew. Chem., 51(24) (2012) 5798.
3. C. Lan, J. Xu, Y. Qiao and Y. Ma, Appl. Therm. Eng., 101 (2016) 284-292. 4. M. Jeong, M. Lee, J. Cho and S. Lee, Adv. Energy Mater., 5(13) (2015).
5. M. Jing, M. Zhou, G. Li, Z. Chen, W. Xu, X. Chen and Z. Hou, Acs. Appl. Mater. & Inter., 9(11) (2017) 9662.
6. C.H. Tan, G.W. Qi, Y.P. Li and S.Y. Zhang, Int. J. Electrochem. Sci., 8(2) (2013) 1966-1975. 7. Z. Wu, R.R. Huang, H. Yu, Y.C. Xie, X.Y. Lv, J. Su, Y.F. Long and Y.X. Wen, Materials, 10(2)
(2017) 134.
8. X. Zhang, B. Winget, M. Doeff, J.W. Evans and T.M. Devine, J. Electrochem. Soc., 152 (11) (2005) 1310-7.
9. T.C. Hyams, J. Go and T.M. Devine, J. Electrochem. Soc., 154 (8) (2007).
10.E. Kramer, S. Passerini and M. Winter, Ecs. Electrochem. Lett., 1(5) (2012) C9-C11.
11.B. Streipert, S. Röser, J. Kasnatscheew, P. Janßen, X. Cao and R. Wagner, J. Electrochem. Soc., 164(7) (2017) A1474-A147
12.J. Shu, M. Shui, F. Huang, D. Xu, Y. Ren, L. Hou, J. Cui and J. Xu, Electrochim. Acta., 56(8) (2011) 3006-3014.
13.C. Peng, L. Yang, S. Fang, J. Wang, Z. Zhang, K. Tachibana, Y. Yang and S. Zhao, J. Appl. Electrochem., 40(3) (2010) 653-662.
14.M. Zhao, S Kariuki, H.D. Dewald, F.R. Lemke, R.J Staniewicz, E.J. Plichta and R.A. Marsh, J. Electrochem. Soc., 147(8) (2000) 2874-2879.
15.E Hayfronbenjamin, Biochem. J., 234(3) (2013) 507-14.
16.M.E. Orazem, I. Frateur, B. Tribollet and M. Musiani, J. Electrochem. Soc., 160(6) (2013) C215-C225.
17.Y.J. Ren, J. Chen, C.L. Zeng, C. Li and J.J. He, Int. J. Hydrogen Energ., 41(20) (2016) 8542-8549. 18.X. Wu, H. Ma, S. Chen, Z. Xu and A. Sui, J. Electrochem. Soc., 146(5) (1999) 1847-1853.
19.D. Aurbach, I. Weissman, A. Zaban and P. Dan, Electrochim. Acta., 45(7) (1999) 1135-1140. 20.T.J. Chem, A. Naseer and A.Y. Khan, Turk. J. Chem., 34(5) (2014) 815-824.
22.G. Ning, B. Haran and B.N. Popov, J. Power Sources, 117(1–2) (2003) 160-169.
23.S.T. Myung, Y. Sasaki, S. Sakurada, Y. Sunb and H. Yashiroa, Electrochim. Acta., 55(1) (2009) 288-297.
24.A.M. Eldesoky, M.A. Diab, A.A. El-Bindary and A.H. Seyam, J. Mater. Environ. Sci., 6(8) (2015) 2148-2165.
25.A.S. Fouda, A.M. Eldesoky, A.Z. El-Sonbati and S.F. Salam, Int. J. Electrochem. Sci., 9(4) (2014) 1867-1891.
26.N. N. Sinha, J. C. Burns and J. R. Dahn, J. Electrochem. Soc., 160(4) (2013) A709-A714. 27.J.Z. Lu, B. Han, C.Y. Cui, C.J. Li and K.Y. Luo, Opt. Laser Technol., 88 (2017) 250-262. 28.T.J. Yang, G.M Li, S. Chen, W.S. Chang and X.Q. Chen, Corros. & Prot., 07 (2010). 29.G. Subramanian, S. Palraj and S. Palanichamy, J. Mari. Sci. Appl., 13(2) (2014) 230-236.