Rochester Institute of Technology
RIT Scholar Works
Theses
Thesis/Dissertation Collections
1998
Establishing a process for collecting drop height
data during a warehouse picking process
Jennifer Gates
Follow this and additional works at:
http://scholarworks.rit.edu/theses
This Thesis is brought to you for free and open access by the Thesis/Dissertation Collections at RIT Scholar Works. It has been accepted for inclusion
in Theses by an authorized administrator of RIT Scholar Works. For more information, please contact
Recommended Citation
by
Jennifer
Anne
Gates
A
Thesis
Submitted
to
the
Department of
Packaging
Science
College
of AppliedScience
andTechnology
in
partialfulfillment
ofthe
requirementsfor
the
degree
ofMASTER OF
SCIENCE
Rochester
Institute
ofTechnology
Department of Packaging Science
College of Applied Science and Technology
Rochester Institute of Technology
Rochester,
New York
Certificate of Approval
M.S.
DEGREE
THESIS
The
M.S.
Degree thesis of Jennifer Anne Gates
has been examined and approved
by the thesis committee as satisfactory
for the thesis requirements for the
Master of Science Degree.
Daniel Goodwin
Deanna Jacobs
Mark Plezia
College of Applied Science and Technology
Title of thesis: Establishing a Process for Collecting Drop
Height Data During a Warehouse Picking Process
I,
Jennifer Anne Gates,
herby grant permission to the
Wallace Memorial Library,
of Rochester Institute of
Technology,
to reproduce my thesis in part or in whole. Any
reproduction cannot be used for profit.
Jennifer Anne Gates
glqlqg
Date
ACKNOWLEDGEMENTS
This
project would notbe
possible withoutthe
strength andsupport given
to
meby
the
following
people:Jeffery
Gates
Mom
&Dad
Scott
Shorts
& MarkPlezia
Scott
Peacock
&the
National
Engineering
Department
Chris
Juda
Jennifer Warner
Dan Goodwin
Deanna
Jacobs
by
Jennifer
Anne
Gates
1998
ABSTRACT
The
purpose ofthis
study
wasto
create a processto
gather warehousedrop
height
data
for
an over-the-counter pharmaceutical company.The
Food
andDrug
Administration's
Current
Good
Manufacturing
Practice
for
Finshed
Pharmaceuticals
was appliedduring
the
development
andcollection of
data.
The
process createdduring
this
study
provedto
be
successfulin
collecting
acuratedata
which willlater
be
usedto
produce afocused
simulationtest.
TABLE
OFCONTENTS
CERT I FICATE
OF
APPROVAL
11
COPY
RELEASE
IllSIGNATURE
PAGE
IVACKNOWLEDGEMENTS
VABSTRACT
VITABLE
OFCONTENTS
VII
1
.0INTRODUCTION
1
HYPOTHESIS
1
REASON FOR
STUDY
1
STUDY OBJECTIVE
3
2.0
REVIEW OF RELATED LITERATURE4
DISTRIBUTION
TESTING
4
Integrity Testing
5
General Simulation
5
Focused Simulation
6
Excel
Logistics
Fast
Pick
Aisle
10
Excel
Logistics
Slow
Pick
Aisle
11
Excel
Logistics
Racking
System
12
DISTRIBUTION
CYCLE
AND
PICKING
PROCESS
STEPS
14
4.0
TEST
MATERIALS
AND EQUIPMENT15
RECORDING
DEVICE
15
Configuration
File
Example
16
SHIPPERS
17
Sample
Shipper18
CUSHION
19
Drop
TestResults
from
a KnownHeight
20
Small Shipper
Assembly
Drawing
21
Medium Shipper
Assembly
Drawing
22
Large
ShipperAssembly Drawing
23
5
.0
THE
PROCESS2 4
Process
Map
2 4
Process
Steps2 5
METHODOLOGY
AND
DATA
NARRATIVE
31
The
Return
Trip
31
TRIP
#1
Pallet
Pattern
33
TRIP
#2
Pallet
Pattern
35
TRIP
#3
Pallet
Pattern
37
TRIP
#4
Pallet
Pattern
3 8
TRIP
#5
Pallet
Pattern
4 0
TRIP
#6
Pallet
Pattern
41
TRIP
#7
Pallet
Pattern4 3
TRIP
#8
Pallet
Pattern4 4
6.0
RESULTS
45
Small SAVER
Frequency
Curve
4 5
Medium SAVER
Frequency
Curve
4 6
Chart:
Package
Drop
Height
vs.Weight
vs.Probability
47
Large
SAVERFrequency
Curve
4 8
Table:
Summary
ofDrop
Heights
by
Shift
49
Chart:
Summary
ofDrop
Heights
by
Shift
50
7.0
CONCLUSION AND RECOMMENDATIONS51
FUTURE
AREAS
OF STUDY52
8
.0
ADDITIONAL USEFUL REFERENCES53
Table
:Trip
#2
Data
5
6
Table
:Trip
#3
Data
57
Table
:Trip
#4
Data
58
Table
:Trip
#5
Data
60
Table
:Trip
#6
Data
61
Table
:Trip
#7
Data
62
[image:10.541.95.486.111.352.2]1
.0
INTRODUCTION
Companies
nolonger
seepackaging
assomething
to
just
hold
a product.Packaging
canbe
used as much more:for
advertising,
for
safety,
for
marketing
promotions, and soon.
At
the
sametime,
packaging
in
some cases canbe
the
most
costly
part ofmanufacturing
and usesthe
mostresources.
As
aresult,
many
companieshave
targeted
packaging
as apotentially
significant areafor
resourcereduction and cost savings.
Investigating
newpackaging
possibilities requiresaccurate
data
abouthow
a package performs andthe
environment.
Specifically,
will a reduction or changein
packaging
stilladequately
protectthe
product?One
way
to
investigate
andjustify
decreases
in
packagematerials
is
to
conductdistribution
tests.
Since
more andmore companies are
looking
atfocused
simulation studies, aprocess used
to
gather reliabledrop
height
information
is
necessary.
This
paper outlines a methodthat
has
provento
be
successfulin
collecting
drop
data
withinthe
orderpicking
processfor
an overthe
counter(OTC)
pharmaceutical company.
HYPOTHESIS
The
new process will providethe
meansfor
collecting
valid
drop
height
data
in
a warehouse setting.REASON FOR STUDY
Over
the
pastfew
years, McNeil R&DTechnologies
has
acquired
increasingly
sophisticatedmonitoring/testing
equipment andknowledge.
Now,
these
resources will allowmore precise packaging studies than
McNeil
has
performedin
the
past.In addition
to
having
the
right equipment andresources,
the
otherdriving
factor
for
more precise packagetesting
is
to
fulfill
acompany
goal: Johnson &Johnson
has
calledutilizes
the
industry
standard,
ASTM
D-4169(American
Society
for
Testing
andMaterials
D-4169
PerformanceTesting
ofShipping
Containers
andSystems)
.This
commonly
usedtest
attemptsto
simulatedistribution
hazards
in
alaboratory
setting.With
minimal actualfield
data,
the
potential
for
overtesting
exists whenusing
ASTM-4169.A
literature
searchturned
up
a number of papers and articles ondrop
test
results and analysis,but
the
writings
did
notspecifically
outlinethe
process usedfor
collecting
this
data.
The mainfocus
was onanalyzing
data
afterit
was collected,therefore
a processgap
wasidentified.
Additionally,
the
writings revealedthat
drop
height
recorders were placeddirectly
into
production shippers. Within anOTC
pharmaceutical company,this
is
not possible sincethe
Food
andDrug
Administration's(FDA)
Current
GoodManufacturing
Practices(CGMP)
wouldbe
violated.Part
211,
Subpart
G
-211.125
Packaging
andlabeling
operations1
states
that
the
contents of a package mustbe
accurately
reflectedby
the
labels
orlabeling.
Dueto
these
regulations, a new method of
data
collection was needed.Due
to
the
generic nature ofASTM-4169,
McNeil needed a new,focused
simulationtest
based
on actual eventsthat
occurin
its
distribution environmentin
orderto
make moreinformed
packagingdecisions.
Once
the
testing
is
completed,
it
will eitherjustify
downgrading
the
packaging
ordefend
adecision
to
maintain currentpackaging
levels.
Either way, a revised, more specifictest
will endorsepackaging
decisions
that
are made.1
U.S. Food and Drug Administration. Code of Federal Regulations -Current Good Manufacturing Practice For Finished Pharmaceuticals. Subpart
G-Packaging and Labeling
STUDY
OBJECTIVEWith
aninformation
gap
clearly
defined,
this
study
wasdesigned
to
compilethe
information
requiredbefore
conducting
drop
height
testing.
Depending
onthe
industry,
some parts ofthis
process will notbe
applicable,but
asolid
basis
for
collecting
drop
height
data
has
been
created.The
processfor
monitoring
drops
during
manualhandling
canbe
used"as
is," orit
may
be
astarting
pointthe
kinds
ofdistribution
testing
are welldefined.
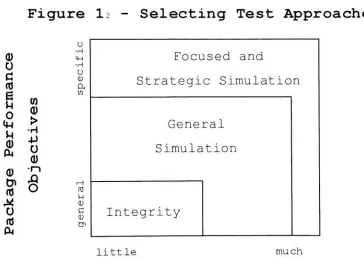
DISTRIBUTION
TESTING
There
arethree
primary
types
ofdistribution
tests.
They
areintegrity
testing,
general simulation, andfocused
simulation2.
(Figure
1)
Which
test
acompany
choosesdepends
on
its
specific needs anddefined
outcomes, as well asresources and equipment required.
Figure
I2
-Selecting
Test
Approaches
0)
o
c
u
o
u
(D
ft
Q)
&> nJM
U
m
ft
u H M-l H O (U Ci,Focused
andStrategic
Simulation
w>
General
PU
d)
n (0 M (D C 0)Simula
tion
0
Integrity
Cnlittle mu :h
Distribution
Information
2
Young, Dennis E. "Strategic Transport Packaging Performance: Linking Product and Package Evaluation to Corporate Objectives."
[image:14.541.76.440.311.579.2]Integrity Testing
Integrity testing
is
the
most general ofthe
three
tests.
An
integrity
test
tends
to
exaggeratedamage
andhazards.
It
is
usedmainly
to
identify
weak products and/orpackages.
An
example of anintegrity
test
is
the
International
Safe
Transit
Association
(ISTA)
1A
procedure.This
procedure consists of a vibrationtest
followed
by
aseries of
ten
packagedrops,
including
one corner,three
edges and all six faces.3
If
acompany
utilizesintegrity
testing,
the
package engineer must emphasizecreating
a robust package ratherthan
a resourceful package.General
Simulation
The
nextlevel
ofdistribution
testing
is
generalsimulation. An example of a
widely
used general simulationtest
is
ASTMD-4169.
D-4169 offers a more specializedtest
than
the
ISTA
1A
integrity
test.
Also,
it
canbe
usedin
its
presentform
by
just
aboutany
company
withany
distribution
environment.Because
ofthis
flexibility
andconvenience,
it
is
the
most commontype
ofdistribution
test
.According
to
the
annualbook
of ASTM standards,D-4169
canbe
usedin
apackaging
laboratory
to
predictthe
likelihood
that
a package will travelsuccessfully
through
the
distribution
environment withoutcausing
criticaldamage
to
the
product."This
is
accomplishedby
subjecting
packages
to
atest
planconsisting
of a sequence ofanticipated
hazard
elements encounteredin
variousdistribution
cycles."4
Altogether,
there
aretwelve
drops
ondifferent
panels ofthe
shipper.The
weight ofthe
shipperand assurance
level
determines
the
test
drop
heights.
Overall,
the
hazard
elementsin
D-4169 are conservative andthe
chancesthat
a package will encounter all ofthe
Young, Dennis E. "Using Distribution Testing to Optimize the Functionality of your
Transit Packaging."
Pira International (1998) :l-7.
4
Annual Book of ASTM Standards, ASTM D 4169-94 Standard Practice for Performance Testing
most rigorous and assurance
level
3
being
least
rigorous.Like
the
majority
ofindustry,
McNeil
currently
tests
atthis
general simulationlevel
using
ASTM
4169.
Aftermonitoring
the
distribution
environment, McNeil plansto
proceedto
nextlevel,
focused
simulation.Focused
Simulation
Focused
Simulation,
or Field-to-Labtesting,
is
the
last
type
ofdistribution
testing.
This
test
is
areenactment of actual events
that
happen
withinthe
distribution
environment.Generating
afocused
simulationtest
is
not aneasy
task.
It
requires advancedmonitoring
equipment and ahuge
commitmentfrom
the
partiesinvolved,
sincecreating
aField-to-Lab
test
cantake
years. To obtain a completetest,
data
is
collectedfrom
five
major categories:environment, vibration, compression, shock, and
inspection.
Due
to
seasonal changes,monitoring
some ofthese
categories should
take
place overthe
course of a year.Shock:
"Throughout
the
distribution system packages aremanhandled and mishandled
in
various ways.They
aredropped,
thrown,
kicked
and otherwiseroughly
abused.Packages
may
fall
from
conveyers orforklifts
and crashto
the
floor.
They
are also subjectedto
avariety
of vehicleimpacts;
trucks
starting, stopping,hitting
potholes and railroad crossings, railcarhumping,
jolting
and other moderately violent actions.In
eachinstance
the
packagesuffers an
impact
with another object.This
impact
resultsin
a mechanical shockto
both
objects. Mechanical shock occurs when an object's position,velocity
or accelerationsuddenly
5
Environment:
Lately,
"environment"has
been
a point ofinterest
for
the
Food
andDrug
Administration
(FDA)
.They
have
begun
to
ask pharmaceutical companiesto
monitorthe
temperature
of activeingredients
andfinished
goodsduring
storage and
distribution.
This
is
to
assurethat
drug
compounds remain efficacious when exposed
to
environmentalconditions.
It
is
speculated withinthe
industry
that
the
FDA
willeventually
requirethis
information
whenever a newdrug
applicationis
filed.
In
anticipationfor
this
possible new
requirement,
ourcompany
is
collecting
this
data
now.Vibration:
Like
shock,
vibration plays a major partin
damaging
products.Vibration
in
the
simplest ofterms
is
"a
quick motion of an object
back
andforth
in
a straightline
on
both
sides of a center position"6.Every
form
oftransportation
within adistribution
system will producesome amount of vibration.
This
includes
trucks,
forklifts,
railcars, airplanes, and even
hand
trucks.
Most
vibrationis
harmless,
but
complex mechanical vibrations canlead
to
physical
damage.
Because
ofthis,
vibration shouldbe
thoroughly
investigated
whencreating
a Field-to-Labtest.
Compression: Compression
damage
occurs when aface
orfaces
of a component are pushedtogether.
Although
measuresare taken
to
avoiddamage
due
to
compression,breakage
canstill occur.
This
is
mostly
due
to
poor communicationbetween
the
package engineers anddistribution
centers.For
example, a package engineerdesigns
a shipperstrong
enough
to
supportdouble
stacking.It
is
assumedthat
the
warehouse
(s)
willonly
stack palletstwo
high.
The
reality:that
same shippermay
arrive atthe
warehouse whichis
having
a space shortage and withoutrealizing
shipperconstraints,
the
workerstriple
stack pallets anddamage
results.
In
this
kind
of situation,damage
is
inevitable.
Unfortunately
this
scenario occursin
every
industry.
One
ofthe
waysto
keep
this
from
happening
is
to
conductfield
studies.Knowing
the
"real"
distribution
environmentas opposed
to
the
"accepted"
environment
is
critical when6
Webster's II New Riverside Dictionary Revised Edition, (Boston, New York: Houghton
distribution
test.
It
is
just
assumedthat
packagelaboratories
inspect
the
productbefore
and aftertesting,
but
assumptions should notbe
made.This
is
a crucialdetail
that
companies cannot affordto
overlook.Inspection
before
conducting
aship
test
is
just
asimportant
asthe
test
itself.
If
damage
is
notdetected
before
a productis
subjectedto
aship
test,
the
test,
environment,
or eventhe
packagemay
be
subjectto
unduescrutiny.
Testing
the
product afterit
has
been
through
distribution
is
another essential step. In some cases,the
package
looks
fine
aftertesting
but
the
productinside
suffers
damage.
Most
likely,
the
damage
willbe
aestheticand
the
product willbe
acceptablefor
consumers,but
this
is
a riskthat
pharmaceuticalscompany
should nottake.
Prevention:
Eventhough
preventionmay
be
the
best
answerto
a problem,it
is
frequently
ignored.
There
are examplesin
industry
where a small part ofthe
distribution
processis
responsiblefor
the
majority
ofdamage.
In a caselike
this,
re-training
may
be
the
easiest and mostlogical
solution.
However,
before
prevention cantake
placethere
must
be
a thoroughunderstanding
ofthe
entiredistribution
3.0
BACKGROUND
INFORMATION
EXEL
LOGISTICS
Johnson
&Johnson
usesExel
Logistics
to
store anddistribute
product viaits
three
majorhubs
located
in
Mechanicsburg,
PA,
Ontario,
CA,
andMemphis,
TN.
Each arerun and operated
the
same way.This
study
was conducted atMechanicsburg,
PA.
Within
the
Exel
system,
McNeil
productis
placedin
oneof
three
placesdepending
ondemand:
fast-pick
aisle,slow-pick aisle, or warehouse racks.
Merchandise
that
is
frequently
orderedis
putin
the
fast-pick
aisle.Any
new or seasonal products are rotatedin
and outamong
the
principalcommodity
items.
One
ofthe
differences
between
the
fast
and slow aislesis
quantity.The
fast-pick
aisle consists of palletsthat
are stackedup
to
three
high
(approximately
160")
andthree
deep.
Pallets
line
both
sides ofthis
aisle.(Figure
2)
The
slow-pick aisleis
nextto
the
fast-pick
aisle andmarks
the
start ofthe
racking
systems.Product
putin
the
slow aisle
is
chosen,but
not asfrequently.
Generally,
there
is
only
one palletload of productin
the
slow aisle.The
fast
aislemay
containup
to
nine pallets of aparticular product code.
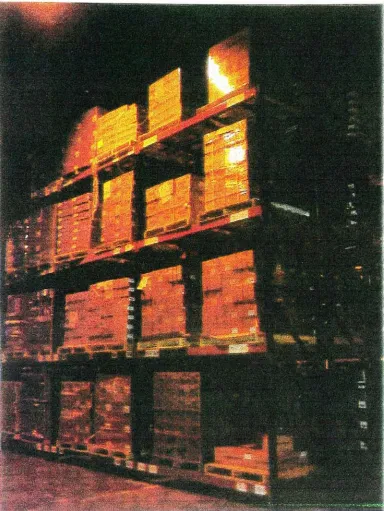
The
rackheights
are muchhigher
than
the
fast-pick
aisle.The
bottom
rack starts at 3" witha 60" opening.
All
rackshave
the
samedimensions.
Based
onthe
measurements,the
maximum possibleheight
for
adouble
stacked pallet
is
245". (Figure
3)
The
rest ofthe
warehouse racks are usedfor
storing
excess amounts of product.
There
arefour
tiers
of racksthat
makeup
ten
aisles. Each section ofracking
canhold
up
to
five
palletloads.Typically,
there
is
one palletin
each of
the
bottom
racks and adouble
stack atthe
top.
Like
the
slow pick aisle,the
maximumheight
of adouble
rH 10 H
<
M O H P_i
4-1
CO
o H
4->
CO
-H tn O
CD X w
CN
0) M
11
co
<
O
H
Oi
3 O
m
CO
o
H
4->
co -H
o
0)
CD
rH
Figure
4
[image:22.541.62.446.121.632.2]13
In
additionto
palletlocations,
understanding
shiftassignments
is
important
for
explaining
data
andfor
creating
atest
that
compilesdata
from
typical
warehousetrips
to
the
worst case scenarios.Exel
has
three
shifts.The
responsibilities of eachshift vary.
First
shifthas
eighteen workers andfills
about
10%
of orders.The
primary
objectiveis
to
preparethe
warehousefor
later
shifts.Second
shifthas
twenty-seven
workers and picks around35%
of orders.This
shift utilizesthe
most workers andfocuses
onpalletizing
mixed orders.Since
second shiftis
responsible
for
the
most manualhandling,
they
are mostlikely
to
drop
the
shippers.Third
shiftfinishes
picking
the
mixed pallets andthen
concentrates on
picking
full
palletload orders.Due
to
the
large
volumes,they
are ableto
pick55%
of orders withonly
twenty-four
workers. In oneday
atExel,
twenty-five
Figure
5
-Flow
Chart
ofThe
Distribution
Cycle
of aMcNeil
Product
PackagingSite
Handling
1
PackagingSite to Finished Goods
DC OTR
1
FinishedGoods DCStorage 8,
Handling
Finished Goods DCPicking
Process
Finished Goods DCto Customer
DC OTR
Customer DC Customer DC PickingProcess
Customer DC to RetailStores OTR
CustomerStores Handling Storage &Handling
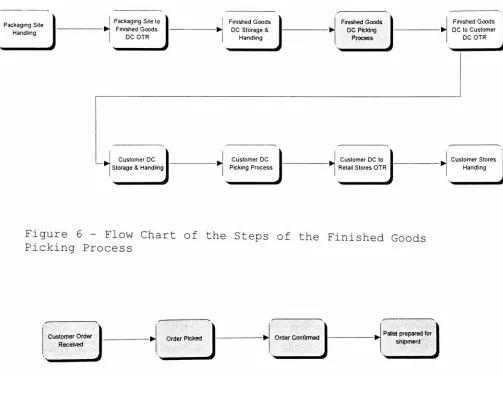
Figure
6
-Flow
Chart
ofthe
Steps
ofthe
Finished
Goods
Picking
Process
CustomerOrder Received
Order Picked Order Confirmed Palletpreparedfor
shpment
The
unshadedblocks
are other pieces ofthe
distribution
environment which will
be
subsequently
evaluated and usedwhen
forming
a completefocused
simulationtest.
*OTR-
Over
the
Road
[image:24.541.27.530.193.598.2]4.0
TEST
MATERIALS
AND
EQUIPMENT
RECORDING
DEVICE
The
measuring
device
usedin
collecting
drop
height
data
is
the
Lansmont
Shock
And
Vibration
Environmental
Recorder(SAVER)
.The
SAVER
contains atriaxial
accelerometer, which collects
data
from
the
X,Y,
andZ
axes.The
SAVER
unitis
compact and weighs aboutthree
pounds.During
this
study,
six recorders were used.For
consistency
andto
help
maintain order whenconfiguring
anddownloading
the
units,
the
serial numbers were notedfrom
each of
the
unit.This
wasdone
to
insure
that
the
same unit would gointo
the
same size shipper eachtrip.
For
example,
SAVER
0434-001
andSAVER
0422-015
always wentinto
the
small shippers.
SAVER
0440-040
andSAVER
0422-017
would gointo
the
medium shippers.
SAVER
0440-044
andSAVER
0422-018
were putinto
large
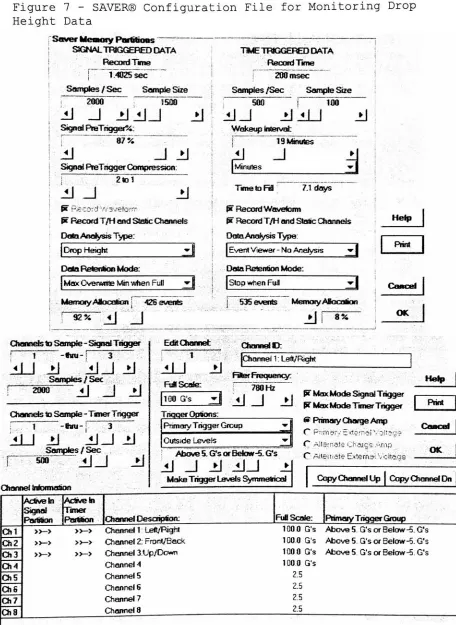
shippers .Recorder Configuration
The
configuration ofthe
recorderis
akey
part ofmonitoring
drop
heights.
Figure
7
shows a sample ofthe
configuration used
for
eachtrip.
The
original SAVER profile was setto
collect3.7
days
oftimed
data
andanything
that
broke
the
threshold
of5
g's.During
the
first
trip,
there
was afour
day
delay.
Even
thoughthe
SAVER
collecteddata,
the
SAVER
units werereset
to
collect sevendays
oftimed
data.
The
otherimportant
piece ofinformation
included
in
the
configuration was
data
overwriting.The
SAVER
was setto
collect
drop
height
data
untilit
wasfull.
After
that,
the
unit would automatically record overthe
smallestdrop
if
alarger
number were captured.Figure
7
-SAVER
ConfigurationFile
for
Monitoring
Drop
Height
Data
Sower
Memory
Partitions rSK3NALTRK3GERED
DATARecord Tsme
TIMETRIGGEREDDATA
RecordTime
1.4025sec
Samples/Sec
SempJeSizeZOOmsec
Samples /Sec Sample Sae
2000 1500
Signal PteTrigger%:
1\
500
j
100JLlJ
JjJJ
Wakeup
totietvatJj
87 V.
11
J
Jj
Signal PreTriggerCompression: ~~
*Record T/HandStatic Channels
Data Analysts Type:
I
|
Mir19Mimrtes
J
Minutes
i
Tmetofifl 7.1 days
pf Record Waveform
&c Record T/HandStaticChannels
DataAnalysis Type:
Help
Drop
Height r|
1
EventViewer-No Analysts
Data RetentionMode:
H
DataRetention Mode: i
MaxOverwrite MinwhenFull
J
Stop
whenFulld
595events
Memory
ASocationMemory
Alocatkatj
426euents1
*jU
_1jjr
9% Print Cancel OK 2000
3J
-1CbanjsetetoSample-Signal Trigger
p
1 -tmi-1
.; 3"
';
;"-'
jlJJ
J
jJJ
-dSamples/Sec
Channels to Sample
-Timer Trigger
i .'i -wi
-[
T~
2U
1
JLl_J
JJ
v Samples/SecP~a
.JLlJ
Channei information
EdftChannec Channel>
lU
2\
ICharmel
1 Left/ftghtFull Scale:
100 G's
filter Frequency:
f
780Hzzl
li
J
Ji
JJ
Trigger Options:
Primary
TnggerGroup
Outside Levels
Above5.G's
lot
Below-5!g*s
4
J
jJ.-iJJ
J:
Make Tngger Levels Symmetrical
fcMax Mode Signal Trigger I? Max Mode Timer Trigger
Primary
ChargeAmp
C
Primary
EtferrreP/oltatjeC
AlternateChaigs;AfppCAlternateExtendi Votage
Help
|
Cancel
OK
CopyChannelUp
Copy
Channel DnCh2 Ch3 Acfevetrs Signal Partfton Ch1 OH Ch5 Ch6 Ch7 ChB Active in Timer
PartSon Channel Description: FuB Scale:
-> -> Channel1 Left/Right
-> -> Channel2iFront/Sack
-> -> Channel 3:Up/Dcwn
ChannelA
Channel5
Channel6
Channel?
Channel8
100 0 Gs
100 0 G's
100 0 Gs
100 0 Gs
2.5
2.5
2.5
2.5
Pnmary
TriggerGroup
Above 5. G'sorBelow-5.G's
[image:26.541.44.500.86.711.2]17
SHIPPERS
The
third
step
in
the
process wasdeciding
what sizeshippers should
be
monitored.As
astarting
point,every
McNeil
shipper was putinto
anExcel
spreadsheet.The
spreadsheet
included
the
following
columns: case cube(LxWxH)
, shipperlength,
width,
height,
weight, andyearly
forecast
.After
allthe
information
was collected,the
spreadsheetwas sorted
according
to
case cube(putting
the
shipperswith
the
samefootprint
alltogether)
.From
there,
production volume
for
each ofthe
sizes was multiplied, anda
small,
medium, andlarge
shipper was chosenbased
onthe
highest
forecast.
Since
only
sixSAVER
units were available,the
othershippers on
the
pallet neededto
containsomething
that
took
a similar amount of space as aSAVER
and weighedthree
pounds.Plastic
bags
filled
withplay
sand were usedto
fill
the
required space.In
all,two
hundred
andfifty
bags
were made and sealedinside
the
rest ofthe
shippers.The
sizes & weights ofthe
shippers were asfollows:
Small 13.44"
(L)x
7.82"(W)
x 4.69"(H)
-3.80
poundsMedium 12.57"
(L)x
12.57"(W)
x 5.88"(H)
-16.00
poundsLarge
20.75"(L)x
14.13"(W)
x 12.56"(H)
-11.73
poundsThe
shippers were constructed of200-lb
Mullen,
C-flute
board
andincluded
standard McNeil graphics.As
part ofMcNeil graphics, a product name and product code was
assigned.
The
mock product was calledSAVER,
andthe
product codes were
82601
for
the
smallboxes,
82602
for
the
medium, and
82 603
for
the
large.
(Figure
8)
The
final
part ofdesigning
the
shippers wasprinting
alot
and expirationdate.
Since McNeilis
currently
undergoing a change
(half
of shippers are printedby
ink
PC
%
COCD tn M crj
crj
CD rH
g
X w
co
CD M
tn
19
Once
the
options wereexamined,
the
natural choice waslabels.
The
warehousehas
been
seeing
them
for
years.Besides,
the
ink
jet
characters createdin
the
lab
weretoo
small
to
accurately
representin-line
printing.CUSHION
Since
the
SAVER
unitis
very
expensive,the
packagesystem
surrounding
it
is
important.
It
wasknown
from
the
beginning
that
the
ideal
system wouldimmobilize
the
SAVER
and protect
it
from
the
lOOg
damage
threshold.
Since
drop
height
is
calculatedfrom
the
acceleration of an event, apolyethylene cushion could
be
used withoutskewing
the
drop
height
results recordedby
the
SAVER.
This
was verifiedthrough
controlledlaboratory
drop
studies atknown
drop
heights.
(Table
I,
next page)Based
onthe
results, a polyethylene cushion wasselected.
Polyethylene
had
all ofthe
qualities needed.It
was
strong
yetit
had
resilience, unlikeits
polystyrenecounterpart.
(When
the
polystyrene cushion wasdropped,
it
retained an
indent
andthe
SAVER
had
roomto
move.)Last
of all, when
the
SAVER
was putinto
a polyethylenecushion,
it
recorded adrop
within0.15
inches
ofthe
actual
height.
Once
polyethylene was picked asthe
cushion, more weighthad
to
be
addedto
the
package system.While
polyethyleneis
denser
andheavier
than polystyrene,it
still was notheavy
enough.To
simulatethe
pre-determinedweights,
woodinserts
were addedto
the
medium andlarge
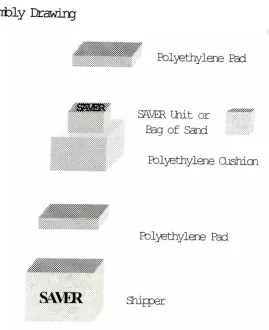
shippers.Figures
9,
10,
&11
showthe
assembly
drawings
for
the
Table
1
-Laboratory
Drop
Test
Results
from
aKnown
Height
Small
SAVER
Medium
SAVERLarge
SAVER
Drop
#
Height
(in)
Shipper
Orientation
Drop
Recorded
(in)
Drop
Recorded
(in)
Drop
Recorded
(in)
1
20
Barcode
Flap
19.78
19.91
19.78
2
20
Top
19.78
19.91
19.78
3
20
Bottom
19.78
20.16
19.78
4
12
Bottom
11.79
11.98
11.79
5
36
Bottom
35.89
35.89
35.89
6
36
Glue
Flap
35.72
35.72
35.72
7
12
Top
11.69
11.79
11.69
8
28
Bottom
27.75
27.9
27.75
9
28
Barcode
Flap
27.9
27.75
27.9
10
20
Glue
Flap
20.03
19.78
20.03
11
12
Barcode
Flap
11.79
11.88
11.79
12
28
Top
28.05
27.75
28.05
13
36
Top
36.06
35.72
36.06
14
28
Glue
Flap
27.9
27.61
27.9
15
36
Barcode
Flap
35.56
35.72
35.56
16
12
GlueFlap
11.98
11.88
11.98
17
28
Top
27.9
27.75
27.9
18
12
Bottom11.79
12.07
11.79
19
20
Bottom19.78
20.16
19.78
20
20
GlueFlap
19.91
19.78
19.91
21
36
BarcodeFlap
35.56
35.72
35.56
22
36
Bottom35.89
35.72
35.89
23
28
Bottom27.9
27.9
27.9
24
20
BarcodeFlap
20.41
19.91
20.41
25
20
Top
19.66
19.91
19.66
26
36
Glue
Flap
35.89
35.72
35.89
27
28
BarcodeFlap
27.9
27.75
27.9
28
28
GlueFlap
27.9
27.75
27.9
29
12
GlueFlap
11.88
11.98
11.88
30
12
Top
11.69
12.07
11.69
31
36
Top
35.89
35.72
35.89
Figure
9
Srrall SffiJER
Shipper
Asserfoly Etawii^
21
Polyethylene
Pad
SAVER
Unit
orBag
ofSand
Polyethylene
Cushion
Polyethylene
Pad
[image:31.541.112.381.164.494.2]Figure
10
Medium
SAVER Shipper
Assembly Drawing
2
Wood Inserts
Polyethylene Pad
SAVER Unit
orBag
ofSand
Polyethylene Cushion
mxm^m^mmMfiM
Polyethylene Pad
Mimmmm
.mmmm,
2
Wood Inserts
[image:32.541.58.473.104.567.2]23
;-.:::; :;. ... ,
. .:. ... :.:..yv.:.; :. ..
, ,, ,. ....-..,>.,,..' . . :::;;;::::-: :-::::;:
Figure
11
m
mn
s
Large
SAVER
Shipper
2
Wood Inserts & a
""---Polyethylene Cushion
Assembly Drawing
^^f^^^^ff^^F'
SAVER Unit or
Bag
of SandPolyethylene Cushion
Polyethylene Pad
2 Wood Inserts
=
\
IB
Shipper
the
chart correspondto
the
discussion
overthe
nextseveral pages.
Figure
12
1 Review Distribution
Process 8. Define Scope ?
2. Establish Process
]
-
J
3 Gam Approval fromrocessParticipants Participants allF
L
8 Assemble Shipper
components andTest from knownDrop
Heights
(VALIDATION)
7. Order Shippers &
other components
6. DevelopCorrugated Shipper Designs
5. WriteaProcess Test 4 DevelopaPlanwith (
DC to GatherDropData
[
-?
9 Design Pallet
Patterns
10 Assemble Pallet
Patternswith mock shippersandshiptoDC
-?
1 1. ConfirmDelivery
andLocationof mock
PalletswithDC
12 Configureand pack
SAVERunitsinto
shippers
13 Deliver SAVER
unitsto DCand placeon
existingmock pallets
1
18 AnalyzeData i 17 DownloadDrop 1- 16 Receiveorder
~ 15 Communicateorder
withDC
i- 14 Order SAVERunits
&otherproducts
Data from SAVER ,
Appropriate g level ?
Y
-?
19 Decreaseor MoreTests ,
Required? ?
20 Create Focused
Simulation Testwith completeddata Increase g level
Y
t
[image:34.541.37.528.201.536.2]25
1.
Review
Distribution
Process
&Define
Scope
Creating
a processfor
collecting
drop
height
data
requires
understanding
the
basic
processes andlayout
ofthe
distribution
center.A
clearidea
of where product canpossibly be
placed alsois
necessary.To
ensure afull
range of
data
is
gathered all areas andtypical
processesmust
be
examined.The
scope ofthe
process started atthe
pointin
the
distribution
chain wherethe
stretchwrap
wasfirst
removedfrom
the
palletload.Once
shippers were unbound,they
underwent
"the
picking
process."The
drop
monitoring
continued until
the
shippers were receivedinto
the
customer's
dock.
The
study
madethe
following
assumptions:Palletloads
were not unbundled priorto
the
distribution
center.
While
drop
height
data
wasbeing
collected,the
packaging
R&D
group
wasmonitoring
additional elements ofdistribution.
(E.g.
manualhandling,
vehicle vibration,etc.)
Only
after allthe
areas ofdamage
have
been
investigated,
will afocused
simulationtest
be
created.This
drop testing
concentrated on a particular eventthat
is
commonto
other Johnson & Johnson consumer products:"The
Picking
Process"(Figure
6)
.The
picking
processhas
been
identified
asthe
area where a product was mostlikely
to
suffer shock and/ordamage
during
manualhandling
.Drop
monitoring
will continue until an accuratedrop
profile canbe
constructed.The
distribution
environmentis
alimited
system withrestricted opportunities
for
packaging
to
suffer majordamage
.All
data
wasto
be
considered relevant.The
data
that
appeared
to
be
abnormal wouldbe
analyzed and anexplanation would
try
to
be
reachedfor
unusualoccurrences. When enough
data
is
collected, a correlation2.
Establish
Process
Participants
Study
participantsincluded
Quality
Assurance,
the
Computer
Systems
Group
to
generateorders,
and warehouseemployees .
An
important
part ofthis
project waskeeping
the
warehouse employees unaware
that
recording
devices
wereinside
the
SAVER
shippers.If
this
knowledge
wereto
getout,
the
entire experiment wouldhave
to
be
stopped. SocialFacilitation
research showsthat
anindividuals
performancecan
improve/deteriorate
in
the
presence of others orduring
conditions where
the
individual
thinks
he/she
is
being
observed7.
Since
the
basis
for
this
test
is
monitoring
the
normal
distribution
environment,it
wasimperative
that
very
few
peoplebe
made aware ofthis
project.3.
Gain Approval FromAll
Process
ParticipantsApproval
for
the
project was neededfrom
Quality
Assurance,
Document
Control,
Distribution Center(DC)
, Computer SystemsGroups
(for
ordering) , andWarehouse
(McNeil
&Exel)
.For
this
process study,getting
approvalfrom
allparties proved
to
be
ratherdifficult.
The pharmaceuticalindustry
is
carefully monitoredby
the
FDA and utilizes standard operating procedures(SOPs)
to
remainin
check.Since
this
particulartype
of projecthas
neverbeen
done,
SOPs
did
not exist and people werehesitant
to
giveauthorization. Once
it
was provedthat
current McNeilSOPs
were not violated, meetings were called with our
document
control
group
andquality
assuranceto
decide
how
this
project would
be
documented. A process was createdto
control
the
samples and Exel Logistics wasfinally
contacted.
Two
people withinthe
warehouse were made awareof
this
experiment.The
approval part ofthis
project alonetook
two
and ahalf
months.Lindzey, Gardner , Calvin Hall and
27
4.
Develop
APlan
With
Distribution
Center
To
GatherDrop
Height
Data
Before
sending
the
shippers andrecorders,
ameeting
wascalled with
key
Exel
contacts.Procedures
for
getting
the
dummy
palletsinto
the
DC
werediscussed.
5.
Write
A
Test
Protocol
A
test
protocol was writtento
document
SAVER
trips
andrecord where
the
units were at alltimes.
6.
Develop
Corrugated
ShipperDesigns
This
step
ofthe
processincluded
getting
alist
of allproduction shippers, case
dimensions,
weights, andproduction volumes;
narrowing
the
list
down
to
three;
starting
a shipperdesign
in
small, medium, andlarge
sizes;
assigning
a product code and product name;meeting
with a graphics analyst or shipper plate maker;
including
standard shipper graphics, address,
barcode,
lot
andexpiration area, product name, and product code.
(See
the
TEST
MATERIALS
sectionfor
details.)
As
described
in
the
TEST MATERIALS section, a shipperand cushion system was created
to
keep
the
SAVER
unit safefrom
damage
.7
. Order ShippersAnd
Other ComponentsAn outside company, Source
Packaging
Inc.
was usedto
make
the
cushionsfor
the
shippers and cutthe
woodinserts
.8
. Assemble Shipper ComponentsAnd
Test
From KnownDrop
Heights
(Validation)
The
shipper components were assembledin
the
Packaging
To
validatethe
test
design,
final
packages(three
sizes)
weredrop
tested
from
known
drop
heights.
Packages
were
dropped
onfour
panels:barcode
panel,
top,
bottom,
and glue
flap.
They
were alsodropped
from
four
different
heights
using
arandomly
generated matrixto
determine
the
height
& panel.Each
package size wasdropped
32
times.
SAVER-recorded
drops
were compared with actualdrop
height
to
calculate a slope and anintercept.
To
determine
the
actualdrop
height,
the
recordeddrop
height
was subtractedfrom
the
intercept;
the
resulting
number was
divided
by
the
slope.9.
Design
Pallet
Patterns
Using
CAPE
Pack
'96
(Computer
Assisted
Packaging
Evaluation),
pallet patterns were createdfor
each size.10.
Assemble
Pallet
Patterns
With MockShippers
And
Ship
To
Distribution
CenterA
3-pound
bag
of sand was placedin
the
shipperswithout a
SAVER.
The
assembled shippers werethen
palletized and sent
to
ExelLogistics
in
atruck
notfilled
to
capacity.11.
ConfirmDelivery
And
Location Of MockPallets
WithDistribution Center
Two
days
afterthe
pallets were sentto
the
DC,
the
Exel
contact verified their arrival and gave us
the
aisle andbin
number.12.
ConfigureAnd
Pack SAVERUnits
Into
Shippers
A
smallidentifying
mark was made onthe
SAVER
shippers, and then
they
were assembledinto
palletloads andstretch wrapped.
The
location ofthe
SAVER
shippers onthe
pallet could
be
manipulateddepending
on what product was29
13.
Deliver
SAVER Units
To
DC
And
Place
OnExisting
MockPallets
Each
week,
the
reconfigured recorders werebrought
to
Exel
during
first
shift and placed ontothe
pallets.14.
Order
SAVER
Units
&Other
Products
To
get a palletfilled
with avariety
ofitems
andweights,
an orderfor
product was placedthrough
the
Johnson
&Johnson
Customer
Service
Center
(CSC)
.Due
to
issues
withinventory
controlsystems,
the
ordersfor
the
SAVER
unitshad
to
be
calledin
and a manualbill
oflading
was written.Later,
the
Exel contact would attachthe
bill
oflading
to
the
CSC
orders soeverything
wouldarrive on one pallet.
Wherever
possible,
regular channels were usedto
placeorders
(e.g.,
computer systems, customer service, etc.).15.
Communicate Order WithDC
An
e-mail withthe
CSC
order number and approximatevisibility
or "drop"date
was sentevery
week sothe
Exelcontact could
find
the
SAVER orderamong
the
hundreds
that
arrive each
day.
16.
Receive OrderWhen
the
pallet arrived, a picture ofload
wastaken
for
further
analysis.The
identifying
mark waslooked
for.
17.
DownloadDrop
Data
From SAVERThe
data
was downloaded as soon asthe
units werebrought
to
the
R&Dlab.
18.
Analyze DataTo
get an exact conversion equationfor
actualdrops
versus
the
SAVER recordings, each ofthe
SAVER
units wereput
into
the
designated shipper sizes anddropped
32
times,
panel
drop
andheight
wererandomly
generatedfor
eachsize.
When
the
data
wascomplete,
the
McNeil
statisticianformulated
anintercept
and slope.When
the
SAVER
unitsreturned
from
atrip,
the
intercept
was subtractedfrom
the
recorded amounts.
The
number wasthen
divided
by
the
slopeto
createthe
"actual
drop
height."During
this
testing,
pallets were movedthroughout
the
warehouse
for
different
drop
height
readings.It
also wasinvestigated
whether unusualdata
couldbe
replicated.19.
Decrease
orIncrease
g
Level
Questions
to
be
askedincluded
whether or notthe
g
level
was appropriate or neededto
be
increased/decreased,
and whether more
tests
were required.The
increase/decrease
in
g
levels
shouldbe
looked
at afterthe
first
trip.
Iflittle
to
nodata
is
collected, anincrease
may
be
necessary.
If
too
muchdata
arrives andis
clustered aroundor
below
the
1"drop
height,
anincrease
in
g's couldbe
used
to
filter
out superfluousdata.
To
be
conservative,data
was collectedfrom
the
5
g
level
throughoutthis
study.As
the
R&D Lab gets closerto
generating
afocused
simulationtest,
aninvestigation
ofthe
data
from
the
10
g
level
will occur.20.
Create
Focused Simulation Test With CompletedData
When enough
drop
height
information
is
collected, afocused
simulationtest
be
devised.
To
do
this,
the
accumulated
data
willbe
examinedfrom
the
5
g
and10
g
levels.
For eachdrop,
the
event willbe
looked
atto
seewhat
handling
event was recorded.A
usefultool
in
interpreting
these
eventsis
the
paper"Accuracy
in
the
Testing
Protocolfor
MeasuredDrop
Heights
in
the
Distribution Environment"8.
8
Goodwin, Daniel L. and Sandeep Goyal. "Accuracy in the Testing Protocol for Measured
Drop Heights in the Distribution Environment"
31
METHODOLOGY
AND
DATA NARRATIVE
The
product ordersdropped
Tuesday
orWednesday
night andthe
second orthird
shift warehouse employees were giventhe
ordersto
"pick".
After
the
orders were complete,they
were placed onthe
dock.
The
Return
Trip
Early Thursday
mornings,the
truck
drivers
would recountthe
order and stretchwrap
the
pallet.The
pallets wouldleave
that
morning
andbe
delivered
to
McNeil onMonday.
Each
Monday,
the
dock
would call usto
come pickup
the
SAVER
units.They
were unpacked andthe
data
wasrecovered.
When
complete,battery
voltage was checked andthe
SAVER
was reconfigured.Once
repacked,they
werebrought
to
Exel
for
anothertrip.
This
process was repeated until enoughdata
was collectedfor
afocused
simulationtest
.Since
time
was criticalduring
this
study
asit
willbe
with most,the
return ofthe
recorder wasimperative.
The
placement on
the
pallet andthe
number ofSAVERs
ordered played akey
partin
increasing
the
return guarantee.Throughout
this
testing,
every
SAVER
unitbrought
to
the
distribution
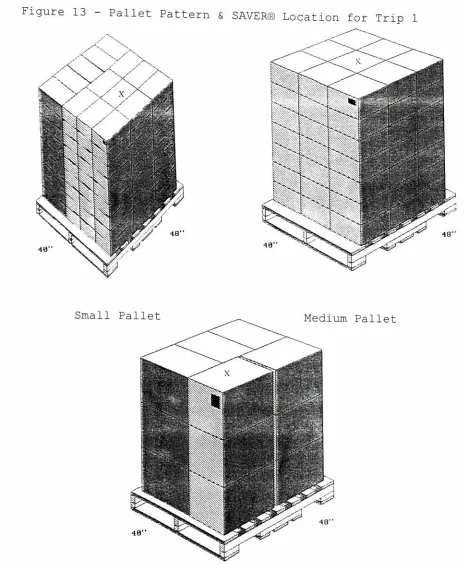
center was retrieved.Due
to
the
importance
ofthe
SAVER
location,
a pallet patternmarking
the
units with an Xis
included
in
every
trip
analysis. Alsoin
the
trip
analysisis
the
details
of each order. These areincluded
to
showthe
amount ofSAVER
units ordered
along
withthe
many
different
productsthat
Trip
#1
The
first
trip
wasthe
mostdifficult.
Even
thoughmeetings were called prior
to
the
shipment,
there
werestill problems.
The
day
the
order arrived atMechanicsburg,
a person other
than
ourtwo
contacts receivedthe
shipmentin.
There
was confusion asto
wherethe
pallets wouldbe
stored and what
day
the
orders woulddrop.
Unfortunately,
it
took
aday
to
resolve andthe
order was sent a weeklate
.On
the
otherhand,
having
the
shippers aroundthe
warehouse amidst confusion provided us with some
very
gooddata.
It
appearedthat
the
palletloads were moved all overthe
warehousebefore
they
endedup
in
the
fourth
tier
ofthe
racking
system, six aislesback.
The
products orderedin
additionto
the
SAVER
shipperscame
from
the
fast
and slow pick aisles.Since
they
werepicked
first,
the
SAVER
shippers endedup
onthe
top
ofthe
pallet. Eventhough
it
was expectedthat
the
large
SAVER
shippers wouldbe
palletizedfirst,
they
weren't.The
small was putdown
withthe
large,
heavier
shippers ontop
.TRIP
#1
Order6
cases Tylenol Gelcaps6
cases Tylenol Caplets6
cases TylenolPM
Caplets6
cases Motrin Tablets6
cases Tylenol Extended Relief Geltabs10
cases Small SAVER Shippers6
cases Medium SAVER Shippers33
Figure
13
-Pallet
Pattern
&SAVER
Location
for
Trip
1
Small
Pallet
Medium
Pallet
3
48"
[image:43.541.37.501.76.641.2]Trip
#2
The
next order wasbrought
to
Mechanicsburg during
the
second week.
The
SAVER's were also put
into
the
top
racksof
the
sixth aisle.Like
the
first
order,the
product waspicked
before
the
SAVER
shippers andthe
SAVER'S
endedup
on
the
top
ofthe
pallet.In
an effortto
collectdata
from
all possible"pick
locations",
the
SAVER
pallets were putin
the
bottom
racksof
the
slow aislefor
the
nextfew
trips.
During
this
trip
a unitdid
not recordany
data.
Afterchecking
the
status ofthe
SAVER,
it
wasfound
that
the
batteries
werelow.
Due
to
this,
the
batteries
werereplaced
every
othertrip.
Trip
#2
Order6
casesStuart
Formula Vitamins6
cases Mylanta AR Liquid6
cases PepcidAC
Caplets4
cases Small SAVER Shippers12
cases Medium SAVER Shippers35
Figure
14
-Pallet
Pattern
&SAVER Location for
Trip
2
Small
Pallet
Medium
Pallet
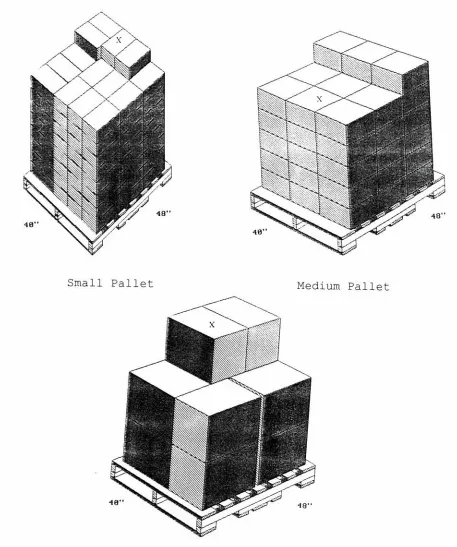
[image:45.541.43.500.107.654.2]Trips
#3
and#4
The
SAVER
pallets were movedfrom
the
top
level
to
the
slow pick aisle where
they
were placedin
bins
onthe
floor.
Trips
#3
and#4
went muchbetter
than
the
previoustwo.
Everyone
who was part ofthe
process seemedto
be
expecting
the
orders andeverything
wentexactly
asplanned.
At
this
point,
the
goal wasto
keep
the
processflowing
smoothly.The
productthat
was ordered wasdeliberately
chosenbecause
it
came afterthe
SAVER
shippers.This
enabled usto
monitor a pick wherethe
SAVER
shippers shouldbe
picked
first
and wouldbe
atthe
bottom
ofthe
pallet.Like
before,
the
small shippers werelaid
down
first
withthe
heavier
shippers ontop.
Trip
#3
Order6
cases Motrin IB Sinus Caplets3
cases TylenolInfant
Drops
6
cases Imodium Caplets6
cases Tylenol Cold Caplets6
cases Mylanta Lemon Liquid5
cases Small SAVER Shipper4
cases Medium SAVER Shipper2
cases Large SAVER ShipperTrip
#4
Order6
cases Tylenol Cold Tablets6
cases TylenolAllergy
Sinus Caplets6
cases TylenolFlu
Powder6
cases Motrin Caplets6
cases Sesame Street Vitamins6
cases Small SAVER Shippers4
cases Medium SAVER Shippers37
Figure
15
-Pallet
Pattern
&SAVER Location fo
rTrip
3
\
X
A
<
Jtwk
JmA
>
'/A
48'
IP
,:V\>--:f:>.:.:VV.f,
....;,
JHS*il '-">-.'.
p
5^^
48'
[image:47.541.44.498.103.639.2]Small
Pallet
Medium
Pallet
[image:48.541.47.490.77.631.2]39
Trips
#5
and#6
The
SAVER
pallets werekept
in
the
bottom
rack ofthe
slow pick aisle
for
runs#5
and#6.
This
time,
product wasordered
from
the
fast
pick aisle andfrom
the
end ofthe

![Figure121Review Distribution2.Establish Process] J](https://thumb-us.123doks.com/thumbv2/123dok_us/61539.5734/34.541.37.528.201.536/figure-review-distribution-establish-process-j.webp)