ECONOMIC PERSPECTIVE 2
THE SCOTTISH WATER INDUSTRY:
RECENT PERFORMANCE AND FUTURE PROSPECTS by John W Sawkins, Department of Economics, University of Aberdeen
1. Introduction delivery of water and sewerage services in Scotland may be traced to the Local Government (Scotland) Act 1973. Under sections 148 and 143 of the Act the nine regional and three islands councils established on 16th May 1975 became the water and sewerage authorities for their areas.1 Their current statutory duties relating to the supply of wholesome water and the provision of public sewers are set out in two main pieces of legislation: the Water (Scotland) Act 1980 and the Sewerage (Scotland) Act 1968. Other related matters are dealt with in supplementary legislation.2
In November 1992 the Scottish Office issued a consultation paper 'Investing for Our Future: Water and Sewerage in Scotland.' In it the Government outlined eight options for the restructuring of the Scottish water and sewerage industry as part of the wider process of local government reform. These options ranged from no change to full privatisation. During this period of consultation, media and political interest in the issue was intense and almost universally hostile to privatisation. The Scottish Office's own 'Summary of Responses to the Consultation Paper "Investing for our Future'" concluded that 92% of the 4,834 correspondents did not specify a preference for any particular option laid out in the consultation paper, but that 94% favoured retention of the services within public control, and only 1% were in favour of privatisation.
Subsequent opinion polls and widely publicised regional postal ballots conducted throughout Scotland confirmed these findings. Thus there was little surprise amongst political commentators when the Government announced its intention to create three new public water authorities in a White Paper published in July 1993. And as the Local Government (Scotland) Bill began its journey through Parliament it was the provisions concerning water and sewerage that proved most contentious once again.
This paper seeks to inform the current policy debate by highlighting some of the key institutional and economic issues raised by the Government's legislative initiative. After discussing the present institutional structure and recent performance of the Scottish water and sewerage industry, the paper goes on to look at the proposed organisational changes and the key economic issues facing it in the years to come.
2. Current Institutional Arrangements. The current institutional arrangements for the
The 12 councils are responsible for the supply of wholesome water to every part of their supply area where a supply of water is required for domestic purposes and can be provided at a reasonable cost. They also have an obligation to provide public sewers to drain effectually their area of domestic sewage, surface water and trade effluent. The contents of the sewers must be dealt with at a sewage treatment works or in another appropriate way, and they must take public sewers to points that will enable the owners of premises served by the region to be connected to the sewers. As with water, they are not required to do anything that is not practicable at reasonable cost.
In addition to the regional and islands councils other organisations have important roles in the Scottish industry. The first is the Central Scotland Water Development Board (CSWDB). Created by the Water (Scotland) Act 1967 its role was preserved at the 1975 reorganisation as a developer of bulk supplies to regional authorities located around the central belt.3 Other important agencies include the seven River Purification Boards (RPBs) responsible for pollution control and river quality on mainland Scotland4, and the Scottish Office itself which sets the wider regulatory framework within which all these bodies must work.
a level high enough to cover annual expenditure. The councillors are in turn accountable to the local electorate. Funds for capital investment are allocated by the Scottish Office on an annual basis under section 94 of the Local Government (Scotland) Act 1973. These allocations are not cash sums but consents to incur capital expenditure up to stated limits. They are arrived at once regions have submitted capital expenditure plans which are examined and prioritised by Scottish Office engineers. Once the cash limits are agreed the final choice of priorities and the responsibility for managing each programme rests with the individual authorities.
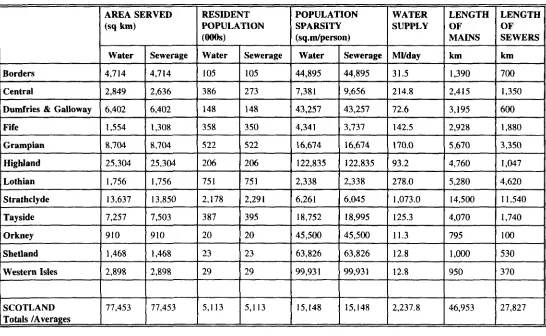
Table 1 below highlights key statistics relating to the delivery of water services within this wider institutional framework. Scotland enjoys abundant water resources in comparison with other UK regions particularly the south east of England. Water abstraction is predominantly from surfacewater sources such as lochs and reservoirs, and little groundwater reaches the public supply. In terms of supply area Highland dwarfs all other regions and is larger than the largest English company (Anglian). At the other extreme the smallest Scottish region, Orkney, is larger than many areas served by water only companies (WoCs5) south of the border; and in general,
variation by geographical area served is smaller in Scotland than in the rest of the UK.
Scotland has approximately 10% of the UK's total population 98.0% of whom are connected to the public water supply (99.0% in England and Wales) and 94.7% connected to public sewers (96.0% in England and Wales)6. However population density
is generally much lower, being skewed away from the north and south and concentrated in the central belt. The measure of sparsity of population indicates 15,148 square metres per person for water and sewerage services in Scotland. This compares with the English and Welsh figures of 2,993 square metres per person for water and 3,075 square metres per person for sewerage. Although Scotland has densely populated regions, for example Lothian, variation in population density is much greater than in England and Wales.
In terms of capital and infrastructure assets the lengths of mains and sewers are used as proxy measures. The industry is capital intensive and given the large, sparsely populated areas to be covered the networks are extensive. This is reflected in summary statistics for the length of mains per head of population: 9.2 metres per head
in Scotland and 6.2 metres per head in England and Wales. But only Strathclyde has an infrastructure and output approaching that of one of the ten privatised water and sewerage companies in England and Wales. Overall the Scottish industry operates smaller units serving more sparsely populated areas, drawing on more abundant water resources than any other region in the UK.
3. Recent Performance
The recent performance of the industry is difficult to assess for several reasons. The main problem lies in choosing measures that will accurately reflect the operation of complex multifunctional organisations. Given the constraints of space and data availability it is necessary to be selective and for this reason only three measures of performance will be presented: charges, capital expenditure and employee numbers. These measures, more than the others, have been the focus of the recent political debate. At a local level, the issue of charges has concentrated the minds of water service departments, politicians and the electorate. European Union (EU) proposals for higher quality standards have led to plans being drawn up for unprecedented increases in the level of capital expenditure. And the prospect of private sector companies providing capital for these projects has raised questions of the future level of employment in this part of the public sector. So what is the evidence?
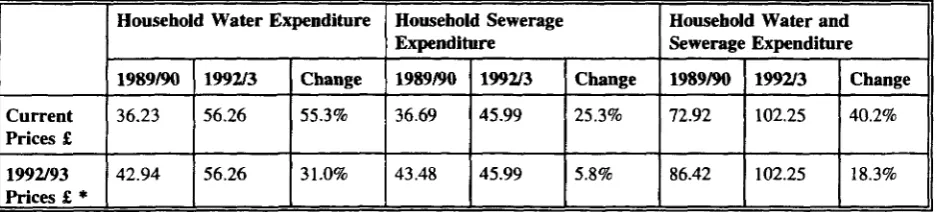
Tables 2 and 3 compare water and sewerage charges and expenditure for England & Wales and Scotland for the period 1989/90 to 1992/3. The dates are significant. In 1989 the ten regional water authorities of England and Wales were privatised and came under the regulatory auspices of the Office of Water Services (Ofwat). The economic regulatory settlement permitted companies to raise their prices well above the rate of inflation7 and
since then press reports and consumer bodies have frequently drawn attention to the increasing financial demands being made of English and Welsh customers. In contrast there has been much less publicity surrounding the increase in Scottish charges collected by the local councils.
Figures in these tables show that changes in household charges for water and sewerage services north and south of the border did not move very far out of line over this period. Although English and Welsh charges began from a higher base and although there are some difficulties in comparison due to the fact that charging was calculated on an
individual rather than a household basis8 the picture is clear. Claims that rises in Scottish bills have lagged well behind those in England and Wales appear to be exaggerated. The impression that Scottish consumers have escaped the large price rises experienced by their English and Welsh counterparts is misleading.
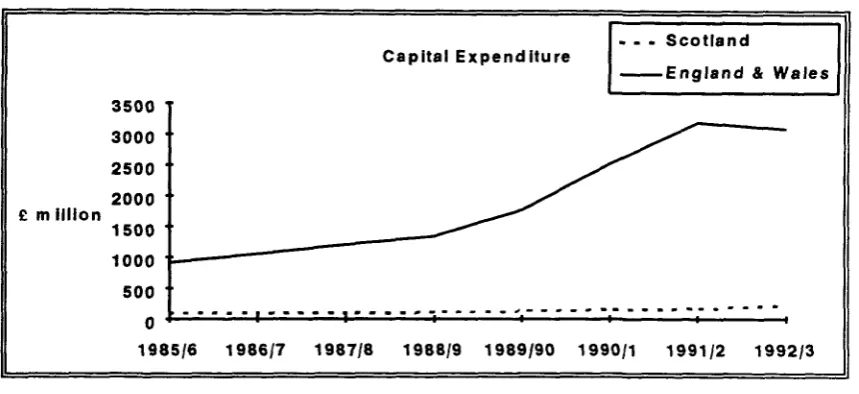
Behind the rapid price rise, particularly in England and Wales, lay the need for greatly increased capital expenditure in the wake of EU directives on drinking water quality and wastewater treatment'. In many areas there was also a certain amount of 'catching up' and renewal of decayed infrastructure.
Table 4 and Figure 1 indicate the path of capital expenditure over an eight year period spanning privatisation in England and Wales.
Although Scotland again works from a lower base the contrast between countries is clear. Despite Scottish capital expenditure rising steadily during the period the gap between it and the English and Welsh expenditure widened sharply in the post privatisation, post 1989, period. The pattern is a reflection of the public sector borrowing and spending constraints that the Scottish regions worked under. In England and Wales privatised companies were able to raise funds on the capital markets and rapidly undertake large projects. At present this option is not open to Scottish authorities. However, in order to meet EU legislative requirements similar projects will need to be undertaken in the near future.
The final measure of performance is manpower, or the number of employees. Given the differing regulatory regimes a priori one would expect sharper cost reduction incentives to exist in England and Wales post privatisation. This would imply greater cost reducing effort and accelerated staff reduction over that period. Table 5 gives a slightly less straightforward story.
Looking at Scotland first, very little change in staff numbers appears to have occurred over the ten year period reported above. Indeed most recently numbers of full time equivalent employees have increased. In England and Wales between 1984 and
1991 numbers fell consistently every year. But not only did the process not accelerate post 1989, in 1992 the numbers actually increased. Since then companies have announced large job losses over the next few years indicating a further decline in absolute terms of the numbers of workers.10 No
such announcements have yet been made for the Scottish industry. Overall this ten year period appears to have been one of greater employment stability for Scottish workers in the industry. These three performance measures give little more man an outline of selected aspects of the industry's operation in recent years. But against this background the Government determined to reform the institutional structure of the industry as part of the wider process of local government reform in Scotland. The involved political reasons for this need not detain us here. Economically, pressures were growing for higher levels of capital investment to meet the higher standards laid down in EU directives; and central Government took the view that the present systems for raising and allocating investment funds were inadequate.
4. Proposed Institutional Reforms
The debate on the future of water services in Scotland may be traced to March 1991 when the Government announced a more general review of the structure of local government. Preliminary soundings were followed by a Scottish Office consultation paper on the future of water and sewerage services published in November 1992, and a White Paper in July 1993. The White Paper concluded that the best structure for the industry would be achieved by establishing 3 public water authorities outwith the structures of local government, with the Secretary of State for Scotland to appoint representatives to the various boards11. It was further suggested that public ownership could be combined with substantial private sector involvement in financing the large projected capital investment programme, following the Chancellor of the Exchequer's policy on private finance
authorities and may suggest modifications or amendments. The Secretary of State, however, will have the power to make final decisions on charging schemes, and to determine the outcome where there is a disagreement between the Customers Council and the authorities.
Although private finance initiatives will be encouraged by the Government in meeting future capital spending commitments, no new legislative provisions will be required for this. The Bill does require the authorities to break even financially and to achieve a minimum rate of return on their net assets. This rate of return will be laid down by the Secretary of State. Loans for the purposes of capital expenditure will be available from the National Loans Fund (NLF) however the Bill places a limit on total borrowing of £3 billion which may be increased by order of the Secretary of State to £4.5 billion. The Bill also contains amendments to the Water (Scotland) Act 1980 and the Sewerage (Scotland) Act 1968. Some of these remove restrictions on the operations of authorities outwith their geographical areas.
In total, the proposals amount to the most far-reaching reform of the industry in at least twenty years. But what are the future economic prospects for the industry? And what will be the key economic issues driving industry policy over the next decade?
5. Economic Prospects
Any discussion of the economic prospects for the Scottish water industry must begin with capital expenditure. This above all other issues will top management agendas for the foreseeable future. The scale of investment required to bring water and sewerage services up to European standards has already been alluded to. Of the current estimate of £5billion over 15 years, approximately half of this will go on quality improving measures and half will be spent on the maintenance and replacement of existing infrastructure.15 In terms of the EU
directives alone, Government estimates suggest that the drinking water directive will cost £1.2 billion and the urban waste water treatment directive £1.3 billion over this period.
The matter is further complicated by the Government's concern to remove water and sewerage expenditure from the Public Sector Borrowing Requirement (PSBR) and to encourage private finance in the delivery of the services16.
Guidelines on so called BOO' (build own and
operate) and 'BOOT' (build, own, operate and transfer) schemes are already in place encouraging public authorities to investigate ways of co-operating with the private sector on the building and operation of new works. Given the overall limits on total borrowing laid out in the Local Government (Scotland) Bill which fall well short of the levels required to meet all the European obligations it is inevitable that some form of private sector involvement will emerge.
The up side of this according to some commentators, is that authorities will be free from many of the constraints and brakes on capital expenditure inherent in the system of 'section 94' consents currently in operation. Furthermore the prospect of private sector involvement implies a greater exposure to the competitive pressures of the capital market resulting in the more efficient allocation and use of resources. Rather than leading to the concentration of power in the hands of the Scottish Secretary it may be argued that this devolution of responsibility to operators will enable the large capital programmes to be undertaken at lower cost to the consumers of the services. The experience of England and Wales is relevant in this context, where private companies have delivered an ambitious programme of capital projects.
But despite the involvement of the private sector and the various grants made available through the EU, inevitably charges for water and sewerage services will rise throughout Scotland. Given that the Government will not finance the bulk of capital works from general taxation through a subsidy system, public authorities will have to pass on the part of the cost of this work not offset by efficiency savings. The question remains as to whether the public are prepared to pay for higher quality water services, or whether other expenditure should be given priority. In England and Wales the large price increases driven by new EU regulations are the subject of continual scrutiny by Ofwat, the economic regulator. Its Director General, Ian Byatt, has promoted several public consultation exercises designed to uncover consumer preferences. He has encouraged the Government to articulate its policy on the time scale for full implementation of the directives, and brought to public attention the whole question of 'paying for quality'17. It may well be
appropriate for the new Scottish bodies to conduct similar research in a co-ordinated approach to planning and scheduling price rises in the future. The extent of price rises will, in the end, depend on what political compromise is struck over the question of paying for quality.
Given the new regulatory environment in which the authorities will work there is likely to be greater pressure on each for the reduction of staff numbers as is currently happening in England and Wales. The adoption of a form of rate of return regulation may hasten the process and precipitate a decline in numbers in the Scottish industry not generally seen over the last decade. With less local authority representation and the staffing of boards with Scottish Office appointees there will very likely be a wholesale re-examination of working practices and staffing levels.
The reduction of local authority representation on the new water authority boards has raised for many the question of accountability. Many politicians have argued vociferously that effective democratic accountability would be diluted by the reforms. However there is other evidence to suggest that at best their case is exaggerated, at worst completely spurious. Before the Government's present review of Scottish local government comparatively little interest was shown by local politicians in water and sewerage services across Scotland as a whole. With some honourable exceptions, councillors saw water subcommittees of the councils as less attractive and lower profile outlets for their talents than say housing, education or health. Given their other duties and responsibilities very few were able to devote the time to acquire the technical expertise to enable them to challenge the decisions of their permanent water services staff. Furthermore it is unclear in what sense they were accountable to the electorate for water and sewerage decisions. The prospect of a Scottish Water and Sewerage Customers Council with members appointed by the Secretary of State holds out the prospect of highly motivated people with industry-specific expertise scrutinising the proposals of authorities. This in turn implies that they will be better placed to challenge permanent officials on all aspects of their work. Again the democratic accountability link is unclear, but local government officials will not be removed from the system. They will serve on the Council, although final numbers are yet to be determined. The experience of the Consumer Service Committees and the Ofwat National Customer Council in England and Wales suggests that accountability and transparency in customer -authority relationships will be enhanced rather than diminished by this particular reform.
6. Conclusion
With less than two years to run until water and
sewerage assets are transferred to the 3 new Scottish water authorities the debate over appropriate levels of capital expenditure, prices, staffing levels and accountability looks set to intensify. Other questions concerning the role of economic and environmental regulators may well emerge as key policy issues. It remains to be seen how the Scottish Office will want to develop policy at a national level, and what - if any - influence it will have on European initiatives affecting the domestic industry.
But in the minds of opposition politicians and media commentators the reform process has raised another more interesting question. The formation of bodies of a similar scale to the privatised water and sewerage companies in England and Wales opens up the possibility of bringing the Scottish industry under the regulatory auspices of a body such as Ofwat18. But more significantly, it also does not finally close the door on full scale privatisation five or ten years hence.
Bibliography.
CRI (1994), 'The UK Water Industry : Water Services and Costs 1992/93', CIPFA, London. McGilvray, J. (1993) 'Water and Sewerage in Scotland: A Review of responses to the Government's Consultation Paper', Economic Perspective, Quarterly Economic Commentary, Fraser of Allander Institute, vol 19, no 1, pp37-46. McMaster, R. and Sawkins, J.W. (1993) 'The Water Industry in Scotland - Is Franchising Viable?' Fiscal Studies, vol 14, no 4, pp 1-13.
Ofwat (1993) 'Paying for Quality: The Political Perspective' Ofwat, Birmingham.
Scottish Office (1992) ' Water and Sewerage in Scotland: Investing for our Future', Scottish Office, Edinburgh.
Scottish Office (1993) 'Summary of Responses to the Consultation Paper "Investing for our Future'", Scottish Office, Edinburgh.
Table 1: The Scottish Water Industry 1993
Borders
Central
Dumfries & Galloway
Fife Grampian Highland Lothian Strathclyde Tayside Orkney Shetland Western Isles SCOTLAND Totals /Averages AREA SERVED (sq km) Water 4,714 2,849 6,402 1,554 8,704 25,304 1,756 13,637 7,257 910 1,468 2,898 77,453 Sewerage 4,714 2,636 6,402 1,308 8,704 25,304 1,756 13,850 7,503 910 1,468 2,898 77,453 RESIDENT POPULATION (000s) Water 105 386 148 358 522 206 751 2,178 387 20 23 29 5,113 Sewerage 105 273 148 350 522 206 751 2,291 395 20 23 29 5,113 POPULATION SPARSITY (sq.m/person) Water 44,895 7,381 43,257 4,341 16,674 122,835 2,338 6,261 18,752 45,500 63,826 99,931 15,148 Sewerage 44,895 9,656 43,257 3,737 16,674 122,835 2,338 6,045 18,995 45,500 63,826 99,931 15,148 WATER SUPPLY Ml/day 31.5 214.8 72.6 142.5 170.0 93.2 278.0 1,073.0 125.3 11.3 12.8 12.8 2,237.8 LEN OF MA km 1,39 2,41 3,19 2,92 5,67 4,76 5,28 14,5 4,07 795 1,00 950 46,9
Table 2: Water and Sewerage Expenditure - England and Wales
Average unmeasured household bill for water and sewerage services in England and Wales.
Current Prices £
1992/93 Prices £ *
Unmeasured Water Supply to Households
1989/90
55.55
65.84
1992/3
81.38
81.38
Change
46.5%
23.6%
Unmeasured Sewerage to Households
1989/90
63.36
75.09
1992/3
88.79
88.79
Change
40.1%
18.2%
Average Unmeasured Household Bill
1989/90
118.91
140.93
1992/3
170.17
170.17
Change
43.1%
[image:7.526.47.516.301.407.2]20.8%
Table 3: Water and Sewerage Expenditure - Scotland
Estimated average expenditure per household. Charges for this period were levied per community charge payer.
Current Prices £
1992/93 Prices £ *
Household Water Expenditure
1989/90
36.23
42.94
1992/3
56.26
56.26
Change
55.3%
31.0%
Household Sewerage Expenditure
1989/90
36.69
43.48
1992/3
45.99
45.99
Change
25.3%
5.8%
Household Water and Sewerage Expenditure
1989/90
72.92
86.42
1992/3
102.25
102.25
Change
40.2%
18.3%
* Converted to 1992/3 prices using the all-items retail prices index.
Sources: Centre for the Study of Regulated Industries (CRI) 'The UK Water Industry: Charges for Services 1993. HC Debates 18 November 1992 c263-4w.
Table 4: Capital Expenditure
Scotland *
England & Wales **
CAPITAL EXPENDITURE (£ MILLION)
1985/6
93.5
909.1
1986/7
102.9
1048.9
1987/8
88.6
1200.4
1988/9
111.59
1345.3
1989/90
127.48
1765.7
1990/1
151.68
2525.4
1991/2
171.42
3184.5
1992/3
229.0
3082.8
FIGURE 1
£
3500 '
3000
2500
2000 m illion
1500
1000
500 0 ^
1985/6 1986/7
Capital Expenditure
• • • Scotland
England & Wales
1987/8 1988/9 1989/90 1990/1 1991/2 1992/3
Sources: Waterfacts 1992, Water Services Association.
The UK Water Industry: Water Services and Costs 1992/3, CRI.
Table 5 Manpower
Scotland
England & Wales*
Full Time Equivalent Employees at 31 March
1984
6144
63175
1985
6129
59606
1986
6155
57502
1987
6270
56774
1988
6194
55356
1989
6128
54653
1990
6096
53906
1991
6219
51613
1992
6274
52589
1993
6521
52211
Figures include NRA staff, most of whom transferred from the regional water authorities in 1989. 1990 figures are an average over the year 1990/91.
Source: Waterfacts 1992 and 1991, Water Services Association
The UK Water Industry Water Services and Costs 1992/93, CRI.
ENDNOTES
1. Small areas of Strathclyde and Tayside were added to the water supply areas of Central and Fife respectively.
2. For example, the wholesomeness of water is defined in the Water Supply (Water Quality) (Scotland) Regulations 1990.
3. Tayside, Fife, Lothian, Central and Strathclyde.
4. The Islands Councils fulfil the role of RPB in their respective areas.
5. WoCs or 'Water Only Companies' are the descendants of statutory water companies in England and Wales. All Scottish regions supply both water and sewerage services and no WoCs exist in Scotland.
6. All statistics quoted in the text are derived from CRI(Centre for the Study of Regulated Industries), The UK Water Industry: Water Services and Costs 1992/93.
7. Price rises were capped at RPI+K, where the 'K' factor was set at a different level for each company.
8. The community charge system of local taxation was in place during this period.
9. For example directives relating to drinking water quality (80/778/EEC) and the treatment of urban wastewater (91/778/EEC).
10. See for example the Times report of 8th June 1994 'Anglian Water to shed 900 jobs'.
11. This solution was broadly in line with 'Option d' set out in the consultation paper.
12. Broadly, the regions to be included in each are: East = Lothian, Borders, Fife and Central, West = Strathclyde, Dumfries & Galloway, North = Highland, Grampian, Tayside and Islands.
13. Transfer day for the assets will be 1 April 1996.
14. In one sense the transfer of assets from local to central government completes the process of nationalisation of the industry.
15. Estimates given in a written Parliamentary reply HC Deb, 23 June 1993 c 209W.
16. A Scotsman report of 9 July 1993 suggested Ian Lang would be seeking half of the £5billion from the private sector.
17. See 'Paying for quality: the political perspective', Ofwat, Birmingham, July 1993.