Integrated Building Performance Simulation
J A Clarke
ESRU, University of Strathclyde [email protected]
ABSTRACT
This paper justifies the need for an integrated approach to building performance assessment and provides examples of the technical appraisals that may then be enabled. The contention is that the use of design tools which focus on a single domain will result in sub-optimum design solutions in terms of indoor air quality, occupant comfort, energy use and environmental impact.
INTRODUCTION
Energy efficiency may be likened to an untapped, clean energy resource of vast potential. The barrier to accessing this resource is less to do with technological constraints—much know-how and many approaches already exist—and more to do with ineffective decision-support. It is a strange paradox that in the age of IT information is never in the hands of those who need it to make informed decisions.
It is in response to this deficiency that building simulation has evolved for use to appraise options for change in terms of relevant issues such as human health and comfort, energy demand reduction and sustainable practices. Because of the growing acceptance that simula-tion defines best practice, substantial attempts are being made to transfer the technology into practice (Bartholomewet al1997, McElroy and Clarke 1999).
INTEGRATED PERFORMANCE SIMULATION
The aim of integrated modelling is to preserve the integrity of the building/ plant system by simultaneously processing all energy transport paths at a level of detail commensurate with the objectives of the problem in hand and the uncertainties inherent in the describing data. To this end, a building should be regarded as being systemic (many parts make the whole), dynamic (the parts evolve at different rates), non-linear (the parameters depend on the thermo-dynamic state) and, above all, complex (there are myriad intra- and inter-part interactions). To achieve high modelling integrity, a simulation program aims to preserve these intrinsic characteristics.
Interface issues aside, it is surely more appropriate to use an integrated simulation program throughout the design process than to use a progression of tools—from simplified to detailed—and ignore the many theoretical discontinuities and pernicious assumptions.
USE IN PRACTICE
Applying simulation to the design and management of the built environment represents a paradigm shift of unparalleled scale. For the first time, the construction industry has the means to address the underlying thermodynamic complexities and undertake integrated per-formance appraisals of options at reasonable cost.
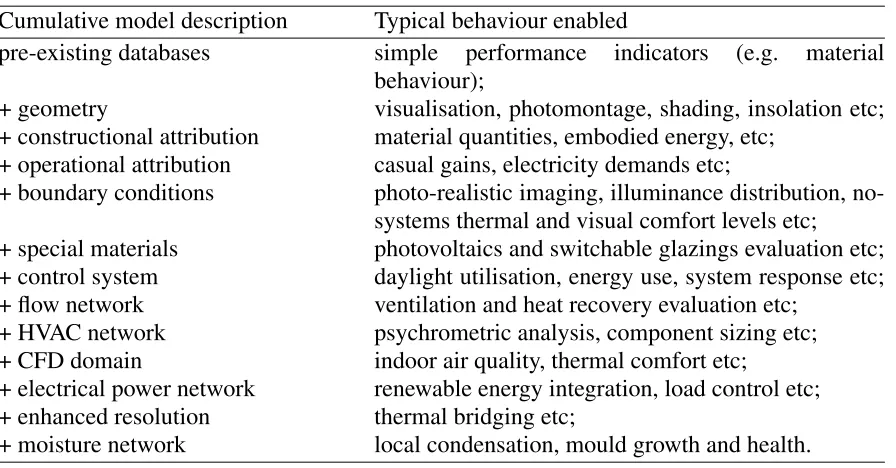
[image:2.612.77.525.231.465.2]Within the integrated approach, as summarised in Table 1, behaviour follows description (or, in other words, reward follows effort). This means that significant decision support can often be achieved for little input effort. It also means that more detail can be added to a model as the design hypothesis progresses and the complexity of the domain interactions grow.
Table 1: Mapping of problem description to model behaviour.
Cumulative model description Typical behaviour enabled
pre-existing databases simple performance indicators (e.g. material behaviour);
+ geometry visualisation, photomontage, shading, insolation etc; + constructional attribution material quantities, embodied energy, etc;
+ operational attribution casual gains, electricity demands etc;
+ boundary conditions photo-realistic imaging, illuminance distribution, no-systems thermal and visual comfort levels etc;
+ special materials photovoltaics and switchable glazings evaluation etc; + control system daylight utilisation, energy use, system response etc; + flow network ventilation and heat recovery evaluation etc;
+ HVA C network psychrometric analysis, component sizing etc; + CFD domain indoor air quality, thermal comfort etc;
+ electrical power network renewable energy integration, load control etc; + enhanced resolution thermal bridging etc;
+ moisture network local condensation, mould growth and health.
Consider the following scenario, the purpose of which is to highlight the integrated appraisal process and, by implication, indicate the nature of a possible future design activity. This scenario employs the ESP-r system <http://www.esru.strath.ac.uk> when its underlying data model is cumulatively refined according to the process of Table 1.
A Project Manager module (Hand 1998) gives access to support databases, a simulation engine, performance assessment tools and a variety of third party applications for CABD, visualisation, report generation etc. Its function is to co-ordi-nate problem definition and give/receive the data model to/from the simulation engine when the design hypothesis changes. Significantly, it sup-ports an incremental evolution of the problem definition, giving access to the simulator’s corre-sponding functionality at each stage.
Databases
climate materials components profiles past projects
Support Project Manager Simulator
Performance assessment and reporting CAD
visualisation database management
model import & export
building fluid/power flow
HVAC control lighting
The starting point for a new project is to scruti-nise and make ready the support databases. These include hygro-thermal, embodied energy and optical properties for construction elements and composites, typical occupancy profiles, pres-sure coefficient sets for use in problems involving air flow modelling, plant components for use in HVAC systems modelling, mould species data for use with predicted local surface conditions to assess the risk of mould growth, and climate col-lections.
database 1
database n professional
literature
model definition
generation
e.g. material properties occupancy/luminaire profiles climate parameters
HVAC/electrical components contaminant data
database 2
hypothesis
Embedded within such databases is knowledge that might usefully support the design conceptual-isation process. As an example, the construction elements database will contain sets of fundamen-tal hygro-thermo and optical properties for a range of construction materials, and derived prop-erties from which behaviour may be deduced (e.g. the use of thermal diffusivity to characterise the rate of response or the thermal transmittance to characterise the rate of heat loss).
fundamental:
conductivity density specific heat transmissivity reflectivity vapour diffusivity surface absorptivity surface emissivity
thermal diffusivity thermal transmissivity
thermal effusivity derived:
Although the procedure for problem definition is largely a matter of personal preference, it is not uncommon to commence the process with the specification of a building’s geometry using a CABD tool. ESP-r can inter-operate with CAD tools such as AutoCAD, which can be used to create a building model of arbitrary complexity. This model can then be imported to the Project Manager where the attribution process is enabled.
Constructional and operational attribution is now achieved by selecting products (e.g. wall con-structions) and entities (e.g. occupancy profiles) from the support databases and associating these with the geometrical entities previously defined. It is at this stage that the simulation novice will appreciate the importance of a well conceived problem abstraction, which achieves an adequate resolution while minimising the number of enti-ties requiring attribution, simulation processing and performance appraisal. Problem abstraction is an acquired skill that develops over time.
Temperature, wind, radiation and luminance boundary conditions of the required severity are now associated with the model to enable an appraisal of environmental performance—e.g. thermal and visual comfort levels throughout the year—and to gain an insight into the extent of any required remedial action. As appropriate, these boundary conditions can be modified to represent extreme weather events or local micro-climate phenomena.
overcast sky intermediate sky clear sky
As required, geometrical, constructional or opera-tional changes can be applied to the model in order to determine the impact on performance. For example, alternative constructional systems might be investigated, different occupancy load-ings imposed, or different approaches to daylight utilisation assessed along with the extent and location of glare as shown here for the case of an office with added light shelf. The possibilities are
limited only by the designer’s imagination. Daylight factor
(%)
No light shelf As-built shelf Conventional shelf
No light shelf As-built Conventional
Distance (m)
glare sources brightness levels
To access the energy displacement potential of this daylight, a luminaire control system might now be introduced, comprising one or more pho-tocells linked to a circuit switch or luminaire dim-ming device. Subsequent simulations can then be undertaken to optimise the parameters of this con-trol system in an attempt to maximise the dis-placement of the electricity required for lighting purposes. In this way, the conflict that exists between the beneficial aspects of daylight capture and the detrimental effects of the reduced heat gain from lights (on heating load) can be studied.
Daylight
Luminaires
W
orking plane illuminance (lux)
Time (minutes)
The issue of integrated environmental control can now be explored by establishing a control system conceived as a collection of open or closed loops. Some of these loops will dictate the availability of heating, cooling, ventilation, lighting etc, while others will serve only to resolve conflict between these delivery systems. Previous aspects of the model may now be revisited in order to change the building’s dynamic response to accommodate the intended control action.
location variable characteristics
ideal PID heuristic fuzzy
location variable characteristic
sensor response actuator
evolving simulation data
signal applied to problem variable(s) or used to effect changes to the problem data
To study the feasibility of natural ventilation, a flow network can be associated with the building model so that the dynamic interactions are repre-sented. The control definition may then be extended to include actions applied to the net-work components—e.g. to emulate window open-ing or flow damper control. This model can be used to examine the impact on air flow of alterna-tive assumptions applied to the distributed leak-age paths. In this way robust natural or mixed mode ventilation schemes may be designed.
internal/ external pressure nodes possible air flow paths
Where mechanical intervention is required, a component network can be defined to represent the HVAC system for association with both the building model and any active flow network. The control definition previously established may be further extended to provide internal component control and link the room states to the supply condition. Such a model can be used to study the operational characteristics of the overall plant system or its component parts.
mixing
box pre-heaterhumidifiercoolingcoil re-heater supplyfan to zone
from zone extract fan
system controller
In order to examine indoor air quality, spaces within the building model can be discretised to allow the use of CFD to evaluate the intra-space air movement and the distribution of temperature, humidity and species concentration. These data may then be combined to determine the comfort levels and air quality at different points within the space. A useful determinant of indoor air quality is the distribution of the mean age of air.
While the components of a model—the building, flow and HVAC networks, and the CFD domain—may be processed independently, it is usual to subject them to an integrated assessment whereby the dynamic interactions are explicitly represented. In the example shown here, a house model has been assigned a flow network to repre-sent natural ventilation, an HVAC network to rep-resent a ventilation heat recovery system, a CFD domain to enable the detailed analysis of air qual-ity and a moisture flow model to allow an accu-rate assessment of humidity distribution.
south
kitchen north
bathroom bedroom
roof
moisture (de)absorptionmoisture
A further network might now be added to repre-sent the building’s electrical power circuits. This can be used in conjunction with the previously established models for facade-integrated photo-voltaics, luminaire control, HVAC and flow net-works to study scenarios for the local utilisation of the outputs from building-integrated renewable energy components, the co-operative switching with the public electricity supply and the shed-ding of load as an energy efficiency measure. Other technologies, such as combined heat and power plant and fuel cells, can also be assessed.
cavity ventilation heat recovery
lights small power
rotational loads
local PV power utilisation public
electricity supply
hybrid PV facade fuel cell
or CHP plant heat
power
For specialist applications, the resolution of parts of the model can now be selectively enhanced to allow the detailed study of particular issues. For example, a portion of a multi-layered construc-tions might be finely discretised to enable the study of the behaviour of a thermal bridge or innovative building component. A moisture flow network might then be added to support an assessment of the potential for interstitial or sur-face condensation.
degC 20
15
10
5
0 thermal bridge
By associating the time series pairs of near sur-face temperature and relative humidity (to emerge from the integrated building, CFD and network air/moisture flow models) with the growth limit data as held in the mould species database, it is possible to determine the risk of mould growth and explore the different possible remedial actions—from eliminating moisture at source to modifying the constructional material or arrange-ment in order to prevent optimum growth condi-tions from occurring in the first place.
actual situation
predicted situation computer model
The Project Manager requires that a record be kept of the problem composition and to this end is able to store and manipulate text and images. At any stage the results for the different aspects of performance may be presented in the form of an Integrated Performance View that quantifies issues such as seasonal fuel use, environmental emissions, thermal/visual/ acoustic comfort, day-light utilisation, risk of condensation, renewable
energy contribution etc. An Integrated Performance View
Annual Energy Performance Heating 78 kWh m-2yr-1
Hot water 39 kWh m-2yr-1
Misc. 8 kWh m-2yr-1
Lighting 28 kWh m-2y-1
Total 153 kWh m-2yr-1 Installed capacity Thermal comfort Visual comfort
Emissions Available daylight Glare
Power demand profiles
School with atrium, tilted windows and external light shelf. College La Vanoise France
The core message is that any problem—from a single space with simple control and prescribed ventilation, to an entire building with systems, distributed control and enhanced resolutions— can be passed to the Simulator where its multi-variate performance is assessed and made avail-able to inform the process of design evolution. By integrating the different technical domains, the approach supports the identification of appro-priate trade-offs. diffuse solar direct solar solar reflection outside air sunspace diffuse transmission diffusing
direct phasechange
selective films external convection convection internal convection radiation zone coupled air flow transient conduction shortwave loss air movement direct transmission heating system cooling systems mechanical desiccant window conduction external longwave radiation opaque direct opaque diffuse internal long-wave radiation movable capacity/ insulation re-radiation convection absorptionconvection radiation evaporative shading diffuse solar direct solar infiltration
At the present time work is underway to add a life cycle impact assessment (LCIA) proce-dure to the ESP-r system (Citherlet et al 2001). This supports the assessment of the energy use and environmental emissions relating to the manufacture, transport, assembly, mainte-nance and disposal of construction materials.
PERFORMANCE ASSESSMENT METHOD
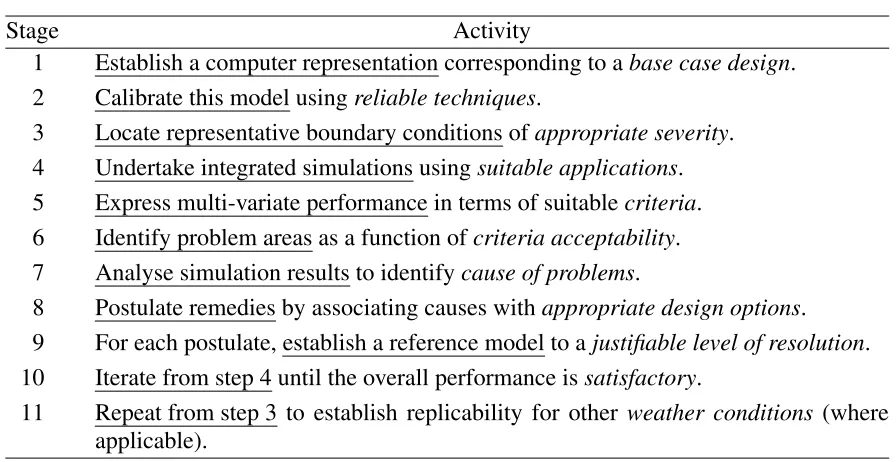
[image:8.612.74.522.240.471.2]To achieve effective application in practice, a performance assessment method (PAM) is required to direct the user’s line of inquiry. Table 2 shows the stages of a generic PAM in which the action required at each stage is underlined and the knowledge required to imple-ment this action is shown initalics.
Table 2: A generic PAM for building energy simulation.
Stage Activity
1 Establish a computer representation corresponding to abase case design. 2 Calibrate this model usingreliable techniques.
3 Locate representative boundary conditions ofappropriate severity. 4 Undertake integrated simulations usingsuitable applications. 5 Express multi-variate performance in terms of suitablecriteria. 6 Identify problem areas as a function ofcriteria acceptability.
7 Analyse simulation results to identifycause of problems.
8 Postulate remedies by associating causes withappropriate design options. 9 For each postulate, establish a reference model to ajustifiable level of resolution. 10 Iterate from step 4 until the overall performance issatisfactory.
11 Repeat from step 3 to establish replicability for other weather conditions (where applicable).
Such a PAM can be attributed with alternative knowledge instances depending on the user’s viewpoint, the application topic(s) and the program’s capabilities. To illustrate the approach, consider the embedding of renewable energy systems within the Lighthouse Building in Glas-gow (Clarke et al 2000). This project employed the integrated modelling approach to deter-mine the best possible match between energy demand and the local renewable energy resource without compromising power quality.
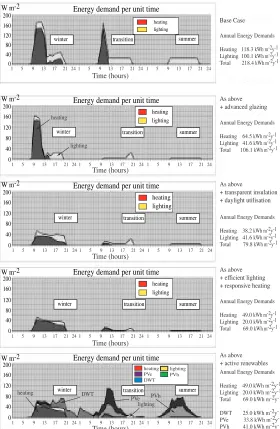
A base case model, compliant with best practice, was established and its multi-variate per-formance determined against relevant weather conditions. A number of energy efficiency measures were then applied to the model (initially independently and then, where warranted, jointly) to determine their potential to reduce energy demand and alter the demand profile to accommodate the integration of active renewable components.
Artist's impression of the Lighthouse building in Glasgow
hybrid PV facade ducted wind turbines demand reduction measures applied here PV aerofoil laboratory testing
of a DWT Energy demand per unit time
Energy demand per unit time
Energy demand per unit time
Energy demand per unit time
Energy demand per unit time W m-2 0 40 80 120 160 200 W m-2 0 40 80 120 160 200 W m-2 0 40 80 120 160 200 W m-2 0 40 80 120 160 200 W m-2 0 40 80 120 160 200
winter transition summer
summer transition
winter
winter transition summer
summer transition
winter
winter transition summer
heating lighting heating lighting heating lighting heating lighting
1 5 9 13 17 21 24 1 5 9 13 17 21 24 1 5 9 13 17 21 24
1 5 9 13 17 21 24 1 5 9 13 17 21 24 1 5 9 13 17 21 24
1 5 9 13 17 21 24 1 5 9 13 17 21 24 1 5 9 13 17 21 24
1 5 9 13 17 21 24 1 5 9 13 17 21 24 1 5 9 13 17 21 24
1 5 9 13 17 21 24 1 5 9 13 17 21 24 1 5 9 13 17 21 24
Time (hours) Time (hours) Time (hours) Time (hours) Time (hours) heating lighting PVe PVh DWT
Annual Energy Demands
Heating 118.3 kWh m-2y-1 Lighting 100.1 kWh m-2y-1 Total 218.4 kWh m-2y-1
Annual Energy Demands
Heating 64.5 kWh m-2y-1 Lighting 41.6 kWh m-2y-1 Total 106.1 kWh m-2y-1
Annual Energy Demands
Heating 38.2 kWh m-2y-1 Lighting 41.6 kWh m-2y-1 Total 79.8 kWh m-2y-1
Annual Energy Demands
Heating 49.0 kWh m-2y-1 Lighting 20.0 kWh m-2y-1 Total 69.0 kWh m-2y-1
Annual Energy Demands
Heating 49.0 kWh m-2y-1 Lighting 20.0 kWh m-2y-1 Total 69.0 kWh m-2y-1
DWT 25.0 kWh m-2y-1 PVe 33.8 kWh m-2y-1 PVh 41.0 kWh m-2y-1 Base Case
As above + advanced glazing
As above
+ transparent insulation + daylight utilisation
[image:9.792.401.700.70.511.2]As above + efficient lighting + responsive heating heating lighting DWT PVe PVh heating lighting As above + active renewables
[image:9.792.67.347.78.507.2]photovoltaic (PV) component operating in hybrid mode to provide both power and heat; and ducted wind turbines (DWT) with an integral photovoltaic aerofoil section to increase the out-put power density (Grant and Dannecker 2000). Also shown in Figure 1 is the predicted power outputs from these two RE technologies superimposed on the most favourable demand profile.
As shown in Figure 2, the hybrid PV component was subsequently incorporated within a facing facade of the Lighthouse building, while the DWTs were mounted on the south-and west-facing edges of the roof.
The appraisal possibilities are effectively without limit. The integrated simulation approach is as applicable to conversion as it is to new build. It may be used to inform the planning and resource allocation process. And it may be used to study innovative approaches such as the deployment of micro power systems within the built environment. With the proliferation of powerful, low cost computing, it is even possible to incorporate integrated simulation within a building’s control system. Weather data and spatial requirements are fed to an explicit build-ing/plant model which then anticipates the consequences of any proposed control action. In this way the control system is endowed with a predictive capability and so is able to take cor-rective action in advance.
CONCLUSIONS
This paper has described the new appraisal possibilities that are being enabled by the emer-gence of simulation programs which are able to address the different domains that impact on a building’s multi-variate performance. The challenge that remains is to embed the technology within the real time, real scale, resource constrained context of design practice. Meeting such a challenge may be seen as a significant contribution to planning for sustainable development.
REFERENCES
Bartholomew D, Hand J, Irving S, Lomas K, McElroy L B, Parand F, Robinson D and Stra-chan P 1997 An Application Manual for Building Energy and Environmental ModellingProc.
Building Simulation ’97(Prague)
Citherlet S, Clarke J A and Hand J 2001 Integration in Building Physics Simulation Energy
and Buildings33(5) 451-61
Clarke J A 2001Energy Simulation in Building Design (2nd Edn) (Butterworth-Heinmann)
Clarke J A, Johnstone C M, Macdonald I A, French P, Gillan S, Glover C, Tatton D, Devlin J and Mann R 2000 The Deployment of Photovoltaic Components Within the Lighthouse Building in GlasgowProc. 16th European Photovoltaic Solar Energy Conference(Glasgow)
Grant A D and Dannecker R 2000 A Hybrid PV/Wind Energy Module for Integration in BuildingsProc. 16th European Photovoltaic Solar Energy Conf. (Glasgow)
Hand 1998 Removing Barriers to the Use of Simulation in the Building Design Professions
PhD Thesis(Glasgow: Department of Mechanical Engineering, University of Strathclyde)
Larson G W and Shakespeare R 1998 Rendering with Radiance - The Art and Science of
Lighting Visualization(San Francisco: Morgan Kaufmann)
McElroy L B and Clarke J A 1999 Embedding Simulation Within Energy Sector Businesses