Int. J. Electrochem. Sci., 12 (2017) 4417 – 4427, doi: 10.20964/2017.05.11
International Journal of
ELECTROCHEMICAL
SCIENCE
www.electrochemsci.org
Development of Lithium-ion Battery of the “Doped Lithium
Iron Phosphate–Doped Lithium Titanate” System for Power
Applications
A. A. Chekannikov1, A. A. Kuz’mina1, T. L. Kulova1, A. M. Skundin1 *, S. A. Novikova2, I. A. Stenina2, A. B. Yaroslavtsev2
1
Frumkin Institute of Physical Chemistry and Electrochemistry, Russian Academy of Sciences 2
Kurnakov Institute of General and Inorganic Chemistry, Russian Academy of Sciences, *
E-mail: askundin@mail.ru
Received: 5 February 2017 / Accepted: 28 February 2017 / Published: 12 April 2017
Lithium-ion battery based on a new electrochemical system with a positive electrode based on composite of doped lithium iron phosphate with carbon (Li0.99Fe0.98Y0.01Ni0.01PO4/C) and a negative electrode based on doped lithium titanate (Li3.812Ti4.972Ga0.1O12) has been developed. The battery is intended for use in fixed energy storage units. The battery is characterized by the ability to operate at increased charging/discharging currents (up to 30 C). Specific power of the battery can reach about 1.5 kW kg-1.
Keywords: lithium-ion battery, doped lithium iron phosphate, doped lithium titanate, specific power
1. INTRODUCTION
That is why a new electrochemical system for lithium-ion battery with a positive electrode based on doped lithium iron phosphate and a negative electrode based on doped lithium titanate was developed.
Undoped lithium iron phosphate and undoped lithium titanate have relatively low electronic and lithium conductivity (10-13 S cm-1) [3-6]. It means that such materials cannot operate under high current densities. To increase electronic and lithium conductivity, there were attempts of heterovalent doping of Li4Ti5O12 with divalent (Cu2+), trivalent (Cr3+, Sc3+, Al3+, Tb3+) and quintavalent (Ta5+) cations [4, 7, 8, 9, 10].
Doping of lithium iron phosphate by the ions of transition metals has been suggested as a way for the increase in mobility and diffusion coefficient of Li+ ions [11-19]. For example, the authors of [12] have studied the structure and properties of LiFe0.9V0.1PO4 and found that the cathode properties of doped counterpart, including reversible capacity, cycleability and rate capability are better than those of LiFePO4. Ions of other transition metals, such as Mg [13, 15, 16], Ni [13, 14, 16], Co [15], Al [16], V [17], Mn [11, 18], Nb [19] can act as dopants, as well.
In our previous papers, we have reported the results of electrochemical study of doped lithium iron phosphate. It was found that the materials doped with Mn [11], and co-doped with both Ni and Al or Ni and In [20] were characterized by a higher ionic conductivity and by a lower activation energy of ionic conductivity. Doping of Сr and Ni was reported in [21]. The doped materials show an increased charge/discharge rate.
The present study was aimed to developing lithium-ion battery based on a new electrochemical system, specifically, doped lithium-iron phosphate ‒ doped lithium titanate. Such a battery will be able to operate at loads as high as 40C. The power density of the battery is expected to be commensurate with that of supercapacitors. These batteries are designed for stationary energy storage systems, e. g. in smart grids.
2. EXPERIMENTAL
2.1. Synthesis of doped lithium iron phosphate
inert atmosphere. In these conditions, carbonization is observed. The carbon content in the composites was determined thermogravimetrically and was 6-12%.
2.2. Synthesis of gallium-doped lithium titanate
Doped lithium titanate of the Li3.812Ti4.972Ga0.1O12 composition was synthesized using the citrate method. Titanium tetrabutylate (99%, Alfa Aesar) and lithium carbonate (99%, Fluka) were dissolved in the ethanol-nitric acid mixture (volume ratio 5:1), and gallium solutions (99.99%, Aldrich) in nitric acid and citric acid (98%, Sigma) were added in the minimum quantity of water. Lithium carbonate was taken with a 5% surplus to prevent possible losses of lithium during subsequent annealing at high temperatures. The obtained mixture was heated sequentially at 95оC during 24 hours and at 250оC during 5 hours. The so formed precursor was ground in an agate mortar to a smooth paste that was subjected to final annealing at 800оC during 5 hours in air.
2.3. Physical characterization and electrochemical measurements
The X-ray phase analysis (XPA) of synthesized samples was conducted with a Rigaku D/MAX 2200 diffractometer with the CuKα radiation. The Rigaku Application Data Processing software package was used for spectra processing. X-ray patterns were processed in FullProf Suite program (WinPlotr), lattice parameters were updated using the Checkcell debugging tool.
The microstructure of samples and study of composition of elements of materials were analyzed with Carl Zeiss NVision 40 scanning election microscope at accelerating voltage of 1 kV.
3. RESULTS AND DISCUSSION
3.1. Characterization of doped lithium iron phosphate
X-ray diffraction analysis method showed that the X-ray pattern of the synthesized sample of Li0.99Fe0.98Y0.01Ni0.01PO4 contains reflexes of LiFePO4 (triphylite, orthorhombic modification, Pnma space group). Reflexes of other phases are not detected. X-ray patterns of Li0.99Fe0.98Y0.01Ni0.01PO4 were compared with the Card No. 81-1173 of the powder database of diffraction standards PDF2. Based on the obtained data, inference should be drawn that the obtained materials represent lithium iron phosphate with the structure of olivine.
[image:4.596.124.470.416.476.2]When using the sol-gel synthesis method, chemical composition of obtained materials must be determined by the ratio of initial reagents. However, lithium compounds are volatile at high temperatures of final annealing, which can result in stoichiometric impurity in the final product. That is why the content of cations and phosphate included as compounds of the material was determined using inductively coupled plasma mass-spectrometry (ICP-MS). For this purpose, the samples were preliminarily dissolved and the solution composition was analyzed. It was demonstrated that the composition of obtained samples corresponds to the initial load (Table 1).
Table 1. Elements content of doped lithium iron phosphate according to inductively coupled plasma mass-spectrometry.
Sample Content in the solution, (g l-1)
Li Fe P Y Ni
Li0.99Fe0.98Y0.01Ni0.01PO4 7.26 57.84 32.39 0.93 0.61
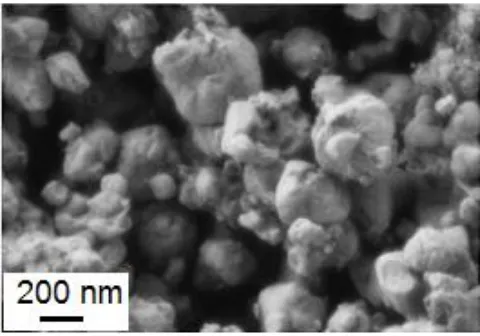
Following the results of scanning electron microscopy, the size of particles of Li0.99Fe0.98Y0.01Ni0.01PO4/Cis about 50 nm. The particles form agglomerates from 100 nm to 300 nm (Figure 1).
[image:4.596.178.418.565.733.2]
3.2. Characterization of gallium-doped lithium titanate
X-ray patterns of doped lithium titanate samples contain reflexes of Li4Ti5O12 only (Card No. 72-0426 PDF-2 database), which evidences that the obtained material is single-phase. Radii of cations of Ga3+, Ti4+ and Li+ are similar, that is why gallium ions can get inserted into both, positions of titanium, and positions of lithium. Ga3+ ion attracts oxygen ions more intensively than Li+ ion considering Coulomb interaction, which results in a grater lattice contraction. To verify this assumption, the structure of doped lithium titanate was updated using the Rietveld method. According to the data obtained as a result of updating the structure using the Rietveld method of the sample of Li4+xTi5-xGaxO12 composition at x=0.1 (Tables 2, 3), gallium ions occupy both, positions of lithium (8а), and positions of titanium (16d).
Table 2. Results of updating the structure of Li3.812Ti4.972Ga0.1O12 at 25оС.
Lattice type Cubic lattice
Space group, Z Fd-3m, 8
Scan space, 2Θо 10-100
Scanning pitch 0.02
Lattice parameters, Å a = 8.3544(1)
Cell volume, Å3 583.102(16)
Number of reflexes 24
Bragg R-factor, Rf-factor Rp, Rwp 0.0489, 0.0533 0.0895, 0.133
[image:5.596.68.532.543.661.2]Moreover, there are about 2.5 times less of gallium ions in octahedral sites than in tetrahedral ones. In accordance with these results, the formula of gallium-doped lithium titanate should be as follows: Li3.812Ti4.972Ga0.1O12.
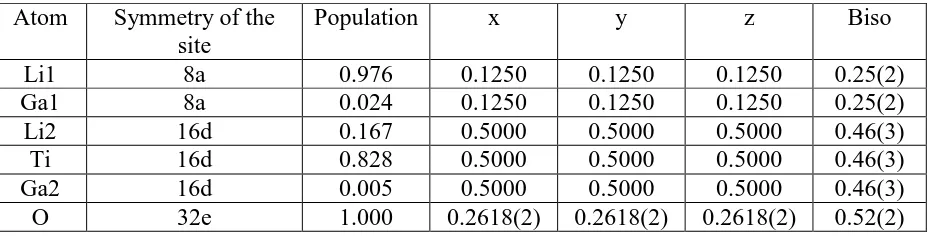
Table 3. Coordinates of atoms and isotropic parameters of thermal bias (В) at 25оC Atom Symmetry of the
site
Population x y z Biso
Li1 8a 0.976 0.1250 0.1250 0.1250 0.25(2)
Ga1 8a 0.024 0.1250 0.1250 0.1250 0.25(2)
Li2 16d 0.167 0.5000 0.5000 0.5000 0.46(3)
Ti 16d 0.828 0.5000 0.5000 0.5000 0.46(3)
Ga2 16d 0.005 0.5000 0.5000 0.5000 0.46(3)
O 32e 1.000 0.2618(2) 0.2618(2) 0.2618(2) 0.52(2)
Figure 2. Scanning electron microscopy of the sample of Li3.812Ti4.972Ga0.1O12
3.3 Electrochemical insertion and extraction of lithium into Li0.99Fe0.98Y0.01Ni0.01PO4/С
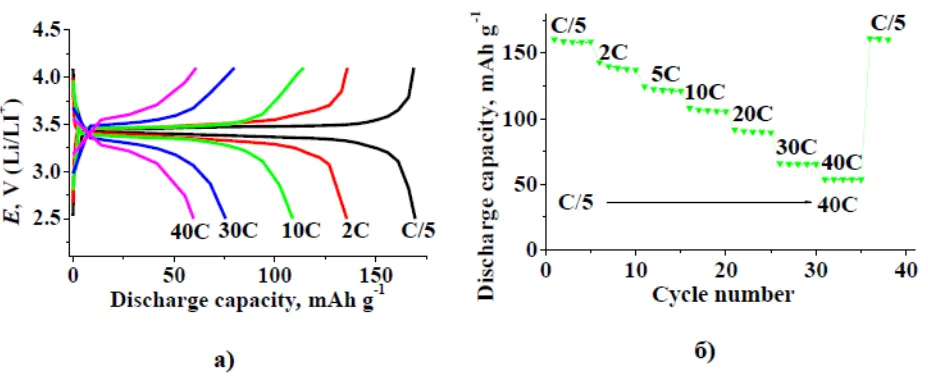
The results of galvanostatic cycling in Figure 3 revealed that the specific discharge capacity of lithium iron phosphate doped with yttrium and nickel at the current density of 34 mA g-1, which corresponds to the current C/5 was about 160 mAh g-1. The increased current density logically resulted in the decreased discharge capacity. However, even at the current density of 40С (6800 mA g-1
) the discharge capacity was about 58 mAh g-1. The discharge potential of lithium iron phosphate doped with yttrium and nickel at low current density (C/5) was about 3.4 V. At increased current densities (40 C), the discharge potential of Li0.99Fe0.98Y0.01Ni0.01PO4/C lowered insignificantly and was about 3.2 V.
The ability of lithium iron phosphate to withstand high currents is explained by two factors: first, the high ion conductivity of this material, and second, small size of particles of synthesized material.
[image:6.596.64.528.507.698.2]
The authors of [23] note, that doping of LiFePO4 by Mg results in increase of its discharge capacity at loads higher than 1C. At the same time, the discharge capacity at low loads was rather modest, ca. 120 mAh g‒1 at 0.1C.
The results of study of LiFePO4 doped simultaneously by nickel and manganese, reported in [24] are commensurate with our results. Thus, it was found that LiFe0.95Ni0.02Mn0.03PO4/C shows the best cycling stability and rate capability. Even at a high rate of 10C, it still reveals a high discharge capacity of 115.2 mAh g−1.
The authors of [25] also found, that the nickel dopant improves the electrochemical performance of lithium iron phosphate. When the discharge mode was 30 C, 10 C, 2 C, 1 C, and 0.1 C rates, the discharge capacities of the LiFe0.98Ni0.02PO4/C was 35, 70, 121, 127, and 142 mAh g−1, that also agrees with the results of the present work.
3.4 Electrochemical insertion and extraction of lithium into Li3.812Ti4.972Ga0.1O12
The results of galvanostatic cycling of negative electrodes from doped lithium titanate are represented in Figure 4. Traditionally, lithium titanate is discharged to potential 1 V, which corresponds to the insertion of 3 lithium ions per formula unit. Simultaneously, it was shown in a number of papers that doped or modified samples of lithium nanotitanate can be cycled in a wider potential range (up to 0.01 V), in this case the discharge capacity is increased up to 275 mAh/g, which is 75 % over the discharge capacity registered in a narrower potential range [26-31].
The electrochemical performance of lithium titanate doped by bismuth was investigated in [27]. Among Bi-doped spinel Li4Ti5-xBixO12 (x = 0.005, 0.10, and 0.15) samples the Li4Ti4.9Bi0.10O12 sample demonstrated the best rate capability. After 50 cycles at a 10C, a reversible capacity was as high as 135.2 mAh g-1 along with a capacity retention ratio of 81.8%.
Lithium insertion into Li4Ti5O12 doped with lanthanum in a wide potential range was studied in [29]. For instance, Li4Ti4.95La0.05O12 sample demonstrated remarkable rate capability in that it delivered a reversible capacity of 200.8 mAh g-1 at the second cycle, and still retained 90.2% of the capacity (vs. 2nd cycle) at 5C charge-discharge rate after 200 cycles. The Li4Ti4.95La0.05O12 anode was capable of large-scale applications, such as electric vehicles and plug-in hybrid electric vehicles, requiring fast charge, long life, high power and a wide operating voltage range, and also for stationary energy storage systems emphasizing cycle life, calendar lifespan and high safety.
It was shown in [30] that the modification of Li4Ti5O12 with Li2TiO3–TiO2 can enhance its rate capability and cycling stability without degradation even at discharge to 0 V.
According to [31]the discharge capacity of lithium titanate doped with vanadium reaches 218.4 mAh g−1 after 50 cycles for the Li4Ti4.95V0.05O12 while it decreases to 197 mAh g−1 for the Li4Ti5O12 discharged to 0 V.
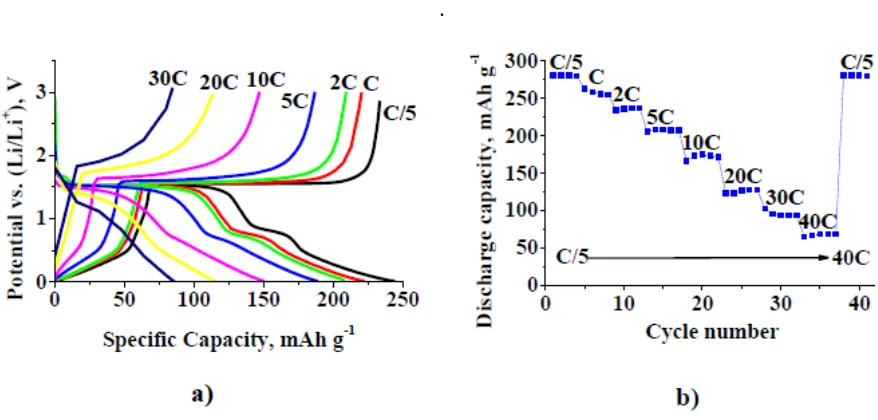
equal to 11,000 mAh g-1 corresponds to the charge for 1.5 minute (or 40C regime), in which case the discharge capacity remains at the level of about 60 mAh g-1. The discharge potential of gallium doped lithium titanate which corresponds to lithium exaction at low current density (C/5) was about 1.5 V. At increased current densities (40 C), the discharge potential of Li3.812Ti4.972Ga0.1O12 increases and was about 2.0 V.
It must be stressed that the results presented in Fig. 4 are in qualitative agreement with those reported in [26-31], but exceed they in quantitative manner.
[image:8.596.77.516.226.436.2].
Figure 4. Charge-discharge curves (а) and dependence of the discharge capacity on the current density (b) for Li3.812Ti4.972Ga0.1O12
3.5 Electrochemical performance of doped lithium iron phosphate–doped lithium titanate system battery
The nominal capacity of the battery was 1 Ah. The battery was tested in C-rates range from C/5 to 30C provided the fact that separate electrodes were successfully tested at 40C. The results of the battery cycling are represented in Figure 5. As the figure 5a shows, the battery discharge capacity at the current of С/5 equals to the rated capacity. The discharge profile has two sections with different voltage due to two plateaus on anodic curve of Li3.812Ti4.972Ga0.1O12. Increase in current density leads to disappearance of high voltage plateau. When the current density is increased, the battery’s discharge capacity and average discharge voltage are reduced, however, even at increased current densities up to 30С the discharge capacity is about 22% of the rated capacity.
Figure 5. Charge-discharge curves at different current densities (а) and change in the discharge capacity at current density of 1C (b) of the doped lithium iron phosphate–doped lithium titanate system battery
10 100 1000
1 10 100
this study Ref [27] Ref [28] Ref [29]
Ener
gy
density
, Wh kg
-1
Power density, W kg-1
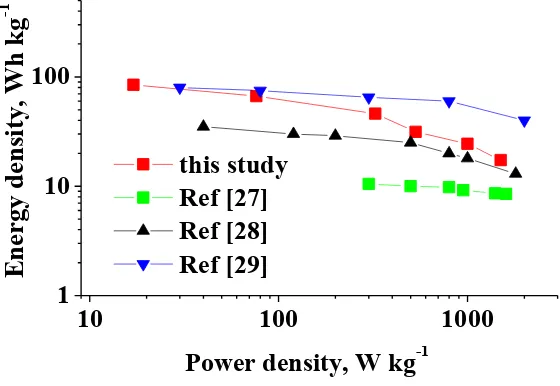
Figure 6. Ragone plots of doped lithium iron phosphate–doped lithium titanate system battery and other reported works.
Degradation and cyclic life of the doped lithium iron phosphate–doped lithium titanate system battery were determined at the charging-discharging current 1А, which corresponded to the so-called cycle service 1С. As the Figures show, the increase in charging-discharging current results in the decreased discharge capacity, as well as decreased average discharge voltage. Change in the discharge capacity during the cycling for 950 cycles was 16 mAh on average, which is about of 16 % of the rated capacity. Thus, degradation during the cycling was 0.017 % per cycle.
[image:9.596.77.506.91.261.2] [image:9.596.152.432.330.523.2]
electrochemical properties suggest that the Li4Ti5O12–LiCo2/3Ni1/6Mn1/6O2 full cell is a potential candidate for battery application due to its excellent cycling performance.
The calculated results are given in the form of Ragone plot (Fig. 6). It is more important that the doped lithium iron phosphate–doped lithium titanate system battery can still deliver 20 Wh kg –1 at a high power density of 1.5 kW kg –1, which is on the same level with supercapacitors [34 - 36]. In particular, it was reported in [34] that energy density of the supercapacitor based on carbon nanotubes - TiO2 system (12.5 Wh kg–1) is comparable to that of an carbon nanotubes (CNT)–Li4Ti5O12 supercapacitor (10–13 Wh kg–1), and is twice as high as a CNT–CNT supercapacitor (6.1 Wh kg–1).
The power density obtained from hybrid supercapacitor based on an advanced carbon-coated Li4Ti5O12 electrode is in fact equal to 1010 W kg–1 at a measured energy density of 16 Wh kg–1 [35].
4. CONCLUSION
In order to develop a battery with increased power specifications, new materials for lithium-ion battery were synthesized: cathode material based on lithium iron phosphate doped with nickel and yttrium (Li0.99Fe0.98Y0.01Ni0.01PO4/C)and anode material based on lithium titanate doped with gallium (Li3.812Ti4.972Ga0.1O12). Both electrode materials were characterized by their ability to operate at increased current densities (up to 40С). Lithium-ion battery of the doped lithium iron phosphate–doped lithium titanate system was developed based on these materials. At low current density energy density of the battery was about 100 Wh kg-1. Maximum specific power was about 1.5 kW kg-1. The battery of this electrochemical system is intended for use in fixed energy storage units.
ACKNOWLEDGEMENTS
The present work is financially supported by the Ministry of Education and Science of the Russian Federation (the Agreement No. 14.604.21.0126 of August 26, 2014. Unique identifier of applied scientific researches RFMEFI60414X0126).
References
1. V. Bagotsky, A. Skundin, Y. Volfkovich, Electrochemical Power Sources: Batteries, Fuel Cells, and Supercapacitors. Wiley, 2015. ISBN: 978-1-118-46023-8. 400 p.
2. C. Chen, J. Vaughey, A. Jansen, D. Dees, A. Kahaian, T. Goacher, M. Thackeray, J. Electrochem. Soc., 148 (2001) A102.
3. M. Chen, L. Shao, H. Yang, T. Ren, G. Du, Z. Yuan, Electrochim. Acta, 167 (2015) 278. 4. P. Du, L. Tang, X. Zhao, W. Weng, G.Han, Surface and Coatings Technology, 198 (2005) 395. 5. H. Gao, L. Jiao, W. Peng, G. Liu, J. Yang, Q. Zhao, Z. Qi, Y. Si, Y. Wang, H. Yuan, Electrochim.
Acta, 56 (2011) 9961.
6. H. Gao, L. Jiao, J. Yang, Z. Qi, Y. Wang, H. Yuan, Electrochim. Acta, 97 (2013) 143.
7. M. Guo, H. Chen, S. Wang, Sh. Dai, L. Ding, H. Wang, Alloys and Compounds, 687 (2016) 746. 8. T. Yi, L. Jiang, J. Shu, C. Yue, R. Zhu, H. Qiao, J. Phys. Chem. Solids, 71 (2010) 1236.
9. F. Wu, X. Li, Z. Wang, H. Guo, Ceramics International, 40 (2014) 13195.
11. S. Novikova, S. Yaroslavtsev, V. Rusakov, A. Chekannikov, T. Kulova, A. Skundin, A. Yaroslavtsev, J. Power Sources, 300 (2015) 444.
12. Y. Wen, L. Zeng, Z. Tong, L. Nong, W. Wei, Alloys and Compounds, 416(2006) 206. 13. A. Örnek, O. Efe, Electrochim. Acta, 166 (2015) 338.
14. R. Qing, M. Yang, Y. Meng, W. Sigmund, Electrochim. Acta, 108 (2013) 827. 15. D. Wang, H. Li, S. Shi, X. Huang, L. Chen, Electrochim. Acta, 50 (2005) 2955. 16. M. Yang and W. Ke, J. Electrochem. Soc., 155 (2008) A729.
17. C. Sun, Z. Zhou, Z. Xu, D. Wang, J. Wei, J. Power Sources, 193 (2009) 841. 18. Z. Huo, Y. Cui, D. Wang, Y. Dong, L. Chen, J. Power Sources, 245 (2014) 331.
19. I. Johnson, E. Blagovidova, P. Dingwall, D. Brett, P. Shearing, J. Darr, J. Power Sources, 326 (2016) 476.
20. R. Kapaev, S. Novikova, T. Kulova, A. Skundin, A. Yaroslavtsev, J. Solid State Electrochemistry, 19 (2015) 2793.
21. A. Chekannikov, R. Kapaev, S. Novikova, T. Kulova, A. Skundin, A. Yaroslavtsev, Int. J. Electrochem. Sci., 11 (2016) 2219.
22. S. Moldoveanu. Pyrolysis of organic molecules: Applications to health and environmental issue. Hardbound. 2009. pp. 744.
23. C. Hu, H. Yi, H. Fang, B. Yang, Y. Yao, W. Ma, Y. Dai, Int. J. Electrochem. Sci., 5 (2010) 1457. 24. H. Shu, X. Wang, Q. Wu, B. Hu, X. Yang, Q. Wei, Q. Liang, Y. Bai, M. Zhou, C. Wu, M. Chen,
A. Wang, L. Jiang, J. Power Sources, 237 (2013) 149.
25. Y. Lua, J. Shia, Z. Guob, Q. Tonga, W. Huanga, B. Li, J. Power Sources, 194 (2009) 786. 26. J. Lin, C. Hsu, H. Ho, Sh. Wu, Electrochim. Acta, 87 (2013) 126.
27. T. Subburaj, K. Prasanna, K. Kim, P. Ilango, Y. Jo, C. Lee, J. Power Sources, 280 (2015) 23. 28. T. Yi, Y. Xie, Q.Wu, H. Liu, L. Jiang, M. Ye, R. Zhu, J. Power Sources, 214 (2012) 220. 29. S. Yang, J. Yuan, Y. Zhu, T. Yi, Y. Xie, Ceramics International, 41 (2015) 7073.
30. T. Yi, Z. Fang, L. Deng, L. Wang, Y. Xie, Y. Zhu, J. Yao, C. Dai, Ceramics International 41 (2015) 2336.
31. T. Yi, J. Shu, Y. Zhu, X. Zhu, R. Zhu, A Zhou, J. Power Sources 195 (2010) 285. 32. A. Swiderska-Mocek, Electrochimica Acta, 139 (2014) 337.
33. A. Mahmoud , I. Saadoune, P. Lippens, M. Chamas, R. Hakkou, J. Amarilla, Solid State Ionics 300 (2017) 175.
34. Q. Wang, Z. Wen, J. Li, Advanced Functional Materials, 16 (2006) 2141. 35. H. Jung, N. Venugopal, B. Scrosati, Y. Sun, J. Power Sources, 221 (2013) 266.