Int. J. Electrochem. Sci., 13 (2018) 5120 – 5140, doi: 10.20964/2018.05.37
International Journal of
ELECTROCHEMICAL
SCIENCE
www.electrochemsci.org
TiO
2/MoO
2Nanocomposite as Anode Materials for High Power
Li-ion Batteries with Exceptional Capacity
Dustin Bauer1,2, Alexander J. Roberts3, Chris L. Starkey1, Raman Vedarajan2, Dan J.L. Brett4, Paul R. Shearing4, Noriyoshi Matsumi2 and Jawwad A. Darr1,*
1
Department of Chemistry, University College London, 20 Gordon Street, London, WC1H 0AJ, U.K. 2
School of Materials Science, Japan Advanced Institute of Science and Technology, 1-1 Asahidai, Nomi, Ishikawa, Japan
3
WMG, University of Warwick, CV4 7AL Coventry, UK 4
Electrochemical Innovation Lab, Department of Chemical Engineering, University College London, Torrington Place, London, WC1E 7JE, U.K.
*
E-mail: j.a.darr@ucl.ac.uk
Received: 14 February 2018 / Accepted: 7 March 2018 / Published: 10 April 2018
Nanoparticles of molybdenum(IV) oxide (MoO2) and a TiO2/MoO2 nanocompositewere synthesised via a continuous hydrothermal synthesis process. Both powders were analysed using XRD, XPS, TEM, and BET and evaluated as active materials in anodes for Li-ion half-cells. Cyclic voltammetry and galvanostatic charge/discharge measurements were carried out in the potential window of 0.1 to 3.0 V vs. Li/Li+. Specific capacities of ca. 350 mAh g-1 were obtained for both materials at low specific currents (0.1 A g-1); TiO2/MoO2 composite electrodes showed superior rate behaviour & stability under cycling (compared to MoO2), with stable specific capacities of ca. 265 mAh g-1 at a specific current of 0.5 A g-1 and ca. 150 mAh g-1 after 350 cycles at a specific current of 2.5 A g-1. The improved performance of the composite material, compared to MoO2, was attributed to a smaller particle size, improved stability to volume changes (during cycling), and lower charge transfer resistance during cycling. Li-ion hybrid electrochemical capacitors using TiO2/MoO2 composite anodes and activated carbon (AC) cathodes were evaluated and showed excellent performance with an energy density of 44 Wh kg-1 at a power density of 600 W kg-1.
Keywords: continuous hydrothermal flow synthesis; molybdenum oxide; composite anode materials; pseudocapacitance; supercabattery
1. INTRODUCTION
air pollution from the burning of fossil fuels [1]. As hybrid and full electric vehicles are developed, they will enable the decarbonisation of the transport sector [2]. The key technology making this transition possible is Li-ion batteries (LIBs), which can be used in both automotive and stationary energy storage applications [3–6]. Typically, a LIB consists of an anode (e.g. graphite), a cathode (e.g. lithium iron phosphate), an electronically insulating separator (glass fibre or polyethylene) and an organic electrolyte containing a Li+ salt [7]. Because the power densities of LIBs are often limited, electrochemical double-layer capacitors (EDLC) are considered more promising for high-power applications such as regenerative breaking [8]. More recently, devices such as Li-ion hybrid electrochemical capacitors (Li-HEC) have been developed as they offer a balance of both moderate power and energy density; these devices typically use activated carbon cathodes and battery-type redox anodes. During the charging of Li-HECs, Li-ions are inserted into the anode active material and anions (e.g. hexafluorophosphate) are absorbed onto the active carbon surface in the cathode (PF6- desorption and Li+ extraction occur simultaneously during discharge) [9]. In contrast to LIBs, both anions and cations are subjected to symmetrical driving forces towards opposite electrodes [10], which means that concentration gradients, which can often limit high power performance in LIBs, are reduced [11].
Nanomaterials are of interest as active electrode materials in high-power LIBs because of their high surface area to volume ratio, which can result in a higher proportion of the charge to be stored on or near the surface, enabling more rapid charge transfer compared to micron-sized (primarily intercalation based) materials with relatively lower surface areas [12,13]. This is particularly important at higher charge/discharge rates. Fast, near-surface Faradaic reactions (also referred to as pseudocapacitive processes) can improve charge storage for devices undergoing rapid charge/discharge; this has been studied for materials such as RuO2 with aqueous electrolytes or anodes in LIBs for various nano-sized TiO2 polymorphs (anatase [14], Nb-doped anatase [15], Mo-doped anatase [16], TiO2(B) [17], and TiO2 bronze[18]) as well as for nano-sized MoO2 [12].
Molybdenum dioxide has been used in anodes for LIBs, both as an intercalation material[19] and as a conversion-type anode [20–25]. As an intercalation material, MoO2 has a theoretical specific capacity of 209 mAh g-1 [26] and as a conversion material (when cycled to potentials below 1.0 V vs. Li/Li+), it has a theoretical specific capacity of 838 mAh g-1 [27]. Due to these properties and the comparatively high abundance and low cost of molybdenum, MoO2 is of interest as active material for negative electrodes in energy storage devices [28]. However, MoO2 suffers from dramatic capacity fading when cycled as a conversion anode, due to the gradual deterioration of electrode integrity [29]. The cycling stability of certain conversion electrode materials can be improved by the incorporation of more stable inorganic phases that do not undergo large volume or structural changes [30,31], such as TiO2 [32–34]. Alternatively, nano-sizing of active materials such as MoO2 and the use of carbon coatings have been investigated previously to overcome some of the limitations of bulk MoO2. Therefore, scalable methods for the fabrication of nanoceramics that allow for the incorporation of other stabilising nanomaterials, or coatings to active nanomaterials, are desirable [12,22,35].
multi-step processes, continuous synthesis processes can offer advantages such as directly forming products with more precise control over reaction conditions during nucleation and growth.
Highly scalable continuous hydrothermal flow synthesis (CHFS) methods have been used to reproducibly manufacture crystalline nanomaterials [39–41]. In CHFS processes, a feed of supercritical water (typically at 450 C) is brought in contact with an ambient temperature aqueous solution of metal salt(s) in a well-defined engineered mixer, to bring about the instantaneous formation of nanoparticle metal oxides (via a complex set of reactions that include hydrolysis, decomposition and dehydration processes [42]). In such flow processes, crystalline nanoparticles can be directly made as a water-dispersed slurry at ambient temperatures (see experimental section).
Herein, we describe the direct synthesis of both ultrafine MoO2 and composite TiO2/MoO2 nanoparticles using a CHFS process. CHFS-made TiO2/MoO2 nanocomposite-containing anodes showed dramatically improved cycling stability in a Li-ion half-cell compared to the analogous MoO2 nanoparticles.
2. EXPERIMENTAL SECTION
2.1. Synthesis
The synthesis of phase-pure anatase TiO2 via CHFS has been described elsewhere by the authors [15,16]. Herein, MoO2 nanoparticles and a TiO2/MoO2 nanocomposite material were synthesized using a (lab-scale) CHFS process, the basic design of which has been described at both lab-scale [43] and pilot plant scale (production capacity up to ca. 2 kg h-1) [44]. Critical to the continuous production of nanoparticles in flow via the CHFS process is the patented (co-current) Confined Jet Mixer (CJM) [45] made from off-the-shelf SwagelokTM parts. The CJM, under these conditions, facilitates highly efficient (turbulent) mixing of a low-density supercritical water stream with a denser ambient temperature aqueous metal salt solution stream. In the CHFS process of the authors, three Primeroyal K diaphragm pumps (Milton Roy, Pont-Saint-Pierre, France, pressurized to 24.1 MPa) were used to supply the three process feeds; first, DI water (10 MΩ) was supplied by Pump 1 and heated in flow to above its critical point (Tc = 374 °C and Pc = 22.1 MPa) to a temperature of
450 °C using a custom-made in-line 7 kW electrical water heater. Pump 2 was used to supply the aqueous solution of metal salt(s) and Pump 3 supplied DI water. Feeds 2 and 3 were first combined in flow in a dead-volume Tee-piece at room temperature, before mixing with the superheated DI water feed (pumped from Pump 1) insidethe CJM under highly turbulent conditions (Reynolds number of ca. 6000).
For the synthesis of TiO2/MoO2 composite with a Ti:Mo atomic ratio of 1:4, Pump 2 was used to deliver a feed of 0.4 M [(NH4)6Mo7O24·4H2O], 0.4 M C6H8O6 and 0.1 M TiBALD. For the synthesis of MoO2, Pump 2 supplied a feed of 0.3 M [(NH4)6Mo7O24·4H2O] and 0.3 M C6H8O6.
The mixing of the aforementioned metal salt feeds with supercritical water (in the CJM) led to the rapid formation of nanoparticles in flow. After a residence time of ca. 5 s, a 1 m pipe-in-pipe counter-current cooler (heat exchanger) was used to cool the hot aqueous stream of nanoparticles down to ca. 40 °C. Thereafter, the cooled nanoparticle-laden aqueous slurry was recovered at the end of the CHFS process after passing through a back-pressure regulator valve. The particles were cleaned by dialysis in DI water for 48 h before being freeze-dried (Virtis Genesis 35XL) by first cooling the wet solids to -40 °C under vacuum of 13.3 Pa and subsequently heating to room temperature over 22 h.
2.2. Physical characterization
Powder X-ray diffraction (PXRD) data was collected in the 2θ range from 10 to 40 ° using Mo-Kα radiation (λ = 0.7107 Å), with a step size of 0.5 °, and a step time of 20 s, on a STOE StadiP diffractometer.
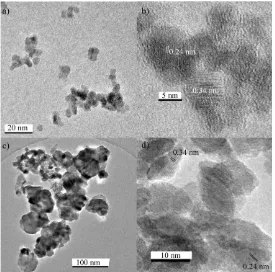
High-resolution transmission electron microscopy (TEM) using a JEOL JEM 2100 – LaB6 filament was used to determine size, interlayer spacing and particle morphology. A Gatan Orius digital camera was used for image capture of the samples that were pipetted on a 300-mesh copper film grid (Agar Scientific, Stansted, UK). Energy dispersive X-ray spectroscopy (EDS) was also performed using the JEOL JEM 2100 for elemental analysis of the samples.
The valence states of the metal ions in samples were determined using X-ray photoelectron spectroscopy (XPS) collected on a Thermo Scientific K-alpha™ spectrometer using Al-Kα radiation equipped with a 128-channel position sensitive detector. High-resolution regional scans for molybdenum were conducted at 50 eV. Processing of the XPS data was performed using CasaXPS™ software (version 2.3.16) and by calibrating the spectra using the C 1s peak at 284.8 eV.
Brunauer-Emmett-Teller (BET) surface area measurements on as-prepared powders were carried out using liquid N2 on a Micrometrics Tristar II. The samples were degassed at 150 ○C (12 h) using Ar gas before measurements were undertaken.
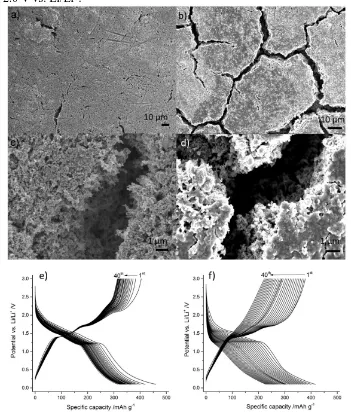
Field emission scanning electron microscopy (FE-SEM) was carried out using a JEOL JSM-6700F microscope operating with an accelerating voltage of 5 kV, to study the surfaces of electrodes after cycling.
The tap densities of the nanomaterials were determined by measuring ca. 1.5 g of powder into a graduated cylinder and manually tapping it vertically on a benchtop 300 times.
2.3. Electrochemical characterization in half-cells
wt% solution of PVDF in N-methyl-2-pyrrolidone (NMP, Sigma Aldrich, St. Louis, USA). The solution was mixed manually with the active material and the conductive carbon and further NMP (ca. 2.5 mL) was added to yield a viscous slurry. The slurry was ball-milled at 800 rpm for 1 hour before being cast on 9 μm copper foil (PI-KEM, Staffordshire, UK) as the current collector. The electrode sheets were dried on a hotplate at ca. 150 °C for 20 minutes, until superficially dry and then left to continue drying overnight at room temperature. All electrodes were then dried overnight under vacuum at 40 °C before being introduced into an Ar-filled glovebox (H2O and O2 < 5 ppm) for cell assembly. The active mass loading of the anodes was in the range 1.8 to 2.0 mg cm-2.
Half-cell tests were performed using CR2032 coin cells. Whatman GF/D glass microfiber filters (Buckinghamshire, UK) were used as the separator and drenched in an organic electrolyte (1 M LiPF6 in 1:1 volume ratio ethylene carbonate/ethyl methyl carbonate, BASF, Ludwigshafen, Germany). For the half-cells, lithium metal foil (PI-KEM, Staffordshire, UK) was used as the counter electrode. Li-ion battery electrodes with TiO2/MoO2 or MoO2 as the active component were tested using cyclic voltammetry in the potential window 0.1 to 3.0 V vs. Li/Li+, at scan rates in the range 0.1 to 100 mV s-1. The half-cell galvanostatic charge/discharge cycling was carried out using an Arbin Instrument Model BT-2000 battery tester (Caltest Instruments Ltd, Guildford, UK), at room temperature. The tests were carried out in the potential range 0.1 to 3.0 V vs. Li/Li+, at specific currents in the range 0.1 to 15.0 A g-1. Cyclic voltammograms (CV) for the half-cells were recorded in the potential window 0.1 to 3.0 V vs. Li/Li+, at scan rates in the range 0.1 to 100.0 mV s-1.
Galvanostatic electrochemical impedance spectroscopy (EIS) was performed using a Gamry Interface 1000 instrument (Gamry Instruments, Pennsylvania, US). The AC current was set to 0.01 A rms. The frequency range was 100 kHz to 50 mHz.
Staircase potentio electrochemical impedance spectroscopy (SPEIS) was performed on Swagelok-type half-cells using a Bio-Logic VSP-300 potentiostat (Bio-Logic Science Instruments, Seyssinet-Pariset, France) in the potential window 0.1 to 3.0 V vs. Li/Li+ with a potential of 0.01 V rms in the frequency range 100 kHz to 10 mHz. Each potential step was held until the measured current had relaxed to below 1 mA.
2.4. Electrochemical characterization in Li-ion hybrid electrochemical capacitors
Anodes, cut from the same sheet as those used for testing in ion half-cells, were used in Li-ion hybrid electrochemical capacitors (Li-HECs), due to their excellent performance at high applied currents in Li-ion half-cells. Activated carbon (AC) electrodes were used as cathodes. The preparation of the AC electrodes has previously been described elsewhere [16]. In brief, they were prepared by mixing 87 wt% activated carbon active material (YP50F, Kuraray Chemical Co., Osaka, Japan) with 8 wt% of a binder (PVDF) and 5 wt% carbon black (SuperPTM) and casting on a Megtec reel-to-reel coater on aluminium foil.
volume ratio of ethylene carbonate/ethyl methyl carbonate, BASF, Ludwigshafen, Germany), were used as separators. The mass ratio between active material in anode and cathode was not optimized, and kept in line with previous reports at a mass ratio of ca 2:7 [16].
Cyclic charge/discharge measurements and CVs for the Li-HECs were performed on a Gamry Interface 1000 instrument (Gamry Instruments, Pennsylvania, US). Galvanostatic charge/discharge cycling was performed at current densities in the range of 2.0 to 20.0 mA cm-2 (based on the geometric surface area of the electrodes), in the potential window of 1.0 to 3.0 V. This was equivalent to specific currents based on the mass of active materials in both electrodes of ca. 0.3 to 3.0 A g-1. The CVs were performed at scan rates in the range 5 to 100 mV s-1, in the potential window 1.0 to 3.0 V.
3. RESULTS AND DISCUSSION
Well-dispersed dark slurries of nanoparticles were obtained, which settled overnight (after the addition of ca. 50 g of NaCl per litre of dispersion). The supernatant was removed, and the black wet solids were dialysed in DI water. After dialysis and freeze-drying, both the nanoparticle samples were recovered as shiny black powders. Due to the high stability of the dispersions and small particle sizes, there were some losses during clean-up, which were higher for the pure MoO2 sample. A yield of > 90% was recorded for the composite sample, which meant a production process rate of > 85 g per hour.
Powder XRD data for the nanoparticle MoO2 revealed well-defined peaks (see Figure 1a) that showed similarities to the standard reference pattern for tugarinovite MoO2 (JCPDS reference card no. 078-1073, space group P2i/c). The major peaks for both samples corresponded to the (011), (-211) and
(-311) peaks for MoO2 (2θ = 11.9, 16.7 and 23.9 °, respectively). The XRD data for the TiO2/MoO2 composite additionally showed a shoulder associated with the peak at 2θ = 11.6 °, corresponding to the (101) peak of anatase TiO2, as well as a peak at 2θ = 21.6 °, corresponding to the (200) peak of anatase. Application of the Scherrer equation to some of the major XRD peaks suggested crystallite sizes of ca. 16 nm for MoO2 in the pure sample and ca. 11 nm for MoO2 in the composite material. Crystallite size analysis on the deconvoluted shoulder of the peak for TiO2 gave an estimated crystallite size of ca. 5 nm.
Figure 1. a) Powder X-ray diffraction (PXRD) patterns for both TiO2/MoO2 and MoO2 with reference patterns for MoO2 (tugarinovite, JCPDS card no. 078-1073) marked by red columns and TiO2 (anatase, JCPDS card no. 071-1167) marked by black columns. High-resolution X-ray photoelectron spectroscopy (XPS) for Mo3d for both the composite b) TiO2/MoO2 and c) pure MoO2.
Semi-quantitative analysis of the XPS peak areas for the TiO2/MoO2 composite suggested an estimated elemental composition of ca. 60 at% titanium, which indicated a strongly enriched loading of TiO2 on the surface. Hence, TiO2 nanoparticles may have been concentrated on the surface of MoO2 nanoparticles in the composite sample.
EDS analysis revealed an even distribution of titanium ions throughout the TiO2/MoO2 composite (see Figure 2a-d). This homogeneity was contrasted by the distribution of Mo ions, which did not appear to be as homogenously distributed. Parts of the sample showed high molybdenum ion concentration, some equal concentrations of Ti and Mo ions and some with no molybdenum ions at all. This suggested that the elements had formed separate phases, due to a combination of either very different rates of hydrolysis or simply low solid solution solubility. Elemental analysis of several large agglomerates of composite material using EDS showed, on average, good agreement with the original Ti:Mo molar ratio used in the synthesis, suggesting a value of 21 ± 2 at% titanium.
[image:8.596.164.437.71.332.2]
Figure 2. a) Scanning transition electron microscopy (STEM) dark-field image showing the TiO2/MoO2 composite and energy-dispersive X-ray spectroscopy (EDS) maps for b) Ti (yellow), c) Mo (grey), and O (green). Histograms showing the particle sizes of 150 particles for both e) the pure MoO2 sample and f) the TiO2/MoO2 composite.
[image:8.596.162.437.424.696.2]
The BET surface area values for the pure MoO2 and TiO2/MoO2 samples were ca. 21 and 105 m2 g-1, respectively. Pure TiO2 synthesised via CHFS has previously been reported to possess a specific surface area of ca. 280 m2 g-1 [49], therefore, even assuming separate formation of 20 mol% TiO2 and 80 mol% MoO2 particles (equal to 14 wt% TiO2 and 86 wt% MoO2), the surface area of MoO2 particles in the composite was increased by the presence of Ti salt.
The tap density of the as-synthesised pure MoO2 was 0.92 g cm-3, whereas that of the TiO2/MoO2 composite was 1.54 g cm-3. This significant increase in tap density was possibly a result of the decreased particle size and better packing of the composite sample.
The results from potentiodynamic tests for the composite nanomaterial and pure MoO2 are shown in Figure 4a and 4b, respectively (at scan rates of 0.1, 0.2, 0.5 and 1.0 mV s-1). Plots for the composite nanomaterial at 0.1 mV s-1 showed three distinct anodic peaks (Li+ extraction) at ca. 1.4, 1.7 and 2.1 V vs. Li/Li+, two major cathodic (Li+ insertion) peaks at 1.25 and 1.5 V vs. Li/Li+, and one minor peak at 1.8 V vs. Li/Li+. The two oxidation peaks at 1.4 and 1.7 V vs. Li/Li+ can be ascribed to the phase transitions from monoclinic to orthorhombic and back to monoclinic phase, as Li+ was extracted from the MoO2 phase, as previously described in the literature [19,20]. The reactions of MoO2 (in the composite or the pure material) in the potential range 1.0 to 3.0 V vs. Li/Li+ can therefore be described by Equation (1):
(1)
Cycling of MoO2 (in the composite or the pure material) to lower potentials such as 0.1 V vs. Li/Li+ subsequently resulted in the partial conversion reaction of the fully lithiated Li0.98MoO2 to molybdenum metal and lithium oxide, as per Equation (2) [27,38,50]:
(2)
In the cyclic voltammogram of the composite materials, the additional extraction and insertion peaks at 2.1 V and 1.8 V vs. Li/Li+, respectively, was ascribed to the Ti3+/Ti4+ transition in TiO2 [15,16]. As the scan rate increased, the separation between anodic and cathodic peaks increased due to polarization of the electrodes. At a scan rate of 1 mV s-1, the third oxidation peak for the Ti3+/Ti4+ transition almost disappeared, whilst the two extraction peaks for MoO2 were still very distinct.
Figure 4. Cyclic voltammograms for a) TiO2/MoO2 composite and b) MoO2 at 0.1, 0.2, 0.5 and 1.0 mV s-1 in black, red, blue and green, respectively. c) Plots of specific capacities over scan rate for both. d) The relationship between specific peak currents and scan rate. e) Plots of specific capacity vs. the reciprocal of the square root of the scan rate (with high scan rate region in grey excluded from analysis) and f) proportion of pseudocapacitive charge storage for both the composite and pure MoO2 at scan rates of 0.5, 5 and 20 mV s-1.
The relationship between specific peak current and scan rate for the intercalation peaks of MoO2 was plotted in Figure 4d. Both anodic and cathodic peak currents were higher at each scan rate for the composite sample, compared to pure MoO2. The Randles-Sevcik equation [51–53] (Equation 3) was used to calculate the apparent diffusion coefficients.
(3)
In Equation 3, the peak current (Ip) is related to the number of electrons involved in the
intercalation (n), the surface area of the electrode (A), the concentration of Li+ (C), the scan rate (ν) and the diffusion coefficient (D).
The specific diffusion coefficients for the pure MoO2 sample were ca. 1.0 × 10⁻⁹ (anodic) and 1.3 × 10⁻⁹
cm2 s-1 g-1 (cathodic), whereas the diffusion coefficients for the composite TiO2/MoO2 sample were significantly higher (ca. 2.8 × 10⁻⁹ and 3.0 × 10⁻⁹
[image:10.596.83.520.81.386.2]
Figure 5. Charge/discharge curves for the 5th cycle for a) TiO2/MoO2 and c) pure MoO2 at specific currents of 0.1, 0.2, 0.5, 1, and 5 A g-1; as well as C-rate cycling data for b) TiO2/MoO2 and d) pure MoO2, with both charge (red) and discharge (black) capacities shown.
The total current qT can be expressed by Equation 4:
(4)
Where qs is the charge related to fast pseudocapacitive charge storage and qd the charge due to
slower diffusion-limited processes.
The pseudocapacitive contribution to charge storage (PCS) can therefore be calculated using Equation (5), and because the diffusion-controlled behaviour is linearly related to ν-0.5
, Equation 4 can be rewritten as Equation 6:
(5)
(6)
[image:11.596.59.543.74.410.2][image:12.596.92.510.76.222.2]
Figure 6. Specific capacities (black squares) and Coulombic efficiencies (blued triangles) for Li-ion half-cells of electrodes made from a) nanocomposite TiO2/MoO2 and b) pure MoO2 nanoparticles; both at a constant specific current of 2.5 A g-1.
Figure 7. a) Development of the electronic resistance (Re) and charge transfer resistance (Rct) during
[image:12.596.70.531.276.668.2]
These values were comparable to those previously reported in the literature for nanosized MoO2 (values reported were 300 C g-1 at 10 mV s-1) [12]. Herein, the larger contribution of pseudocapacitive charge storage in the composite sample was attributed to the small size of the MoO2 particles in the composite (versus the pure MoO2 material), which facilitated rapid near-surface charge transfer processes [56].
These findings were supported by the results of galvanostatic charge/discharge measurements (see Figure 5a and 5c) at specific currents of 0.1, 0.2, 0.5, 1, 5, 10 and 15 A g-1, in the potential window of 0.1 to 3.0 V vs. Li/Li+. The charge/discharge curves for half-cells containing TiO2/MoO2 electrodes at lower currents (e.g. 0.1 A g-1) showed three separate plateaus. The two plateaus, at lower potentials vs. Li/Li+, corresponded to a phase transformation from monoclinic Li0.98MoO2 to orthorhombic LixMoO2 (0.45 < x <0.78) and back to monoclinic MoO2 [19], as observed from peaks in the cyclic voltammograms.
The plateau at ca 2.0 V vs. Li/Li+ was due to lithium extraction from the anatase lattice of the TiO2 [14]. This assignment was supported by the observation that no corresponding plateau was found in the charge/discharge profile for the half-cells with anodes made of pure MoO2.
Current rate testing revealed similar initial specific discharge capacities for both samples at low applied currents (ca. 350 mAh g-1 at 0.1 A g-1 after 10 cycles). However, there were significant differences at higher specific currents (see Figure 5b and 5d). The half-cells containing the TiO2/MoO2 composite showed superior capacity retention and rate behaviour (as well as higher Coulombic efficiencies) in the first twenty cycles at lower applied currents. An increase in the applied specific current to 0.2 A g-1 led to a significant reduction in specific capacity for the pure MoO2 electrodes and noticeable reduction in cycle life, with a loss of 25 % in capacity after 10 cycles. In comparison, at a specific current of 1 A g-1, the TiO2/MoO2 composite electrodes showed a stable specific discharge capacity of ca. 225 mAh g-1. Under similar conditions, the cell with pure MoO2 showed a steadily decreasing specific discharge capacity < 100 mAh g-1. Even at specific currents of 5 and 10 A g-1, The TiO2/MoO2 composite half-cells still delivered stable and high specific discharge capacities of ca. 160 and 70 mAh g-1, respectively. This meant that a specific capacity of 160 mAh g-1 could be stored and discharged within less than 2 minutes.
TiO2 has previously been used in composite electrodes to enhance the cycling performance and stability of Li-ion cells containing alloying materials such as sulphur and MoS2 [31,58,59]. Herein, the improved charge storage at high rates can be explained by the smaller particle size and higher surface area of the MoO2 phase in the TiO2/MoO2 composite particles [56,60], which led to higher pseudocapacitive contributions and better apparent lithium-ion diffusion at high applied currents.
Staircase Potentio Electrochemical Impedance Spectroscopy (SPEIS) of half-cells using anodes made from the TiO2/MoO2 composite revealed that at a potential of 3.0 V vs. Li/Li+ (fully discharged state), the Nyquist profile changed significantly after cycling. Both charge transfer resistance and solution resistance were largely consistent after cycling, revealing similar Nyquist plots after 100, 200 and 300 cycles. At 2.0 V vs. Li/Li+, the Nyquist plots, after 100, 200, and 300 cycles, remained consistent but were significantly different to the Nyquist plot before cycling. Due to electrolyte decomposition, the solution resistance (Re) was significantly higher after cycling than it was before,
[image:14.596.121.472.286.698.2]both at 3.0 and 2.0 V vs. Li/Li+.
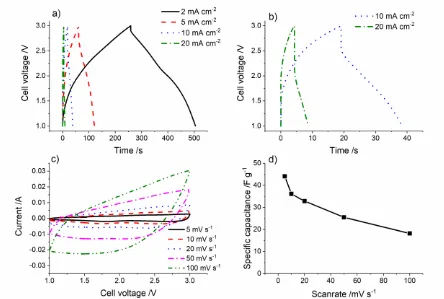
Figure 9. a) and b) Constant charge/discharge profiles for TiO2/MoO2//Activated carbon Li-ion hybrid electrochemical capacitors as well as c) cyclic voltammetry and d) specific capacitance of the whole cell at various scan rates.
The maximum charge transfer resistances (Rct) were observed at a potential of 2.0 V vs. Li/Li+
for all measurements after cycling and increased from 27 to 36 Ω after cycling for 100 and 300 cycles, respectively. For impedance measurements taken in the potential window of 1.5 to 0.1 V vs. Li/Li+, charge transfer and solution resistances did not differ significantly with different potentials and cycles. The general trend in charge transfer resistance was to increase as the cut-off potential of 0.1 V vs. Li/Li+ was approached (see Figure 7a). The resistance due to solid electrolyte interphase formation RSEI
showed no clear pattern and remained in the range 11 to 20 Ω after 100, 200 and 300 cycles.
were ca. 22, 13 and 8 % of the original capacity in the ranges 0 to 100, 100 to 200 and 200 to 300 cycles, respectively.
To explain the significantly worsening performance of the half-cells containing the pure MoO2 electrodes, post-mortem scanning electron microscopy (SEM) was carried out. The cycled electrodes of each material showed micro-cracks, which were relatively minor for the TiO2/MoO2 electrode (see Figure 8a and c), but much larger and connected for the pure MoO2 electrode (see Figure 8b and d). The expansion/shrinking during lithiation and delithiation, especially during the conversion reaction, may have been responsible for cracking for each set of materials [24] and the electrode itself [61]. Due to its chemical and structural stability, TiO2 has also been used to improve the stability of other active materials; for example, in TiO2@Fe2O3 arrays [62], Fe3O4@TiO2 clusters [30], and as previously mentioned a MoS2/TiO2 composite [59].
Because of its superior performance at high specific currents, the TiO2/MoO2 composite was identified as a potential anode material for a Li-ion hybrid electrochemical capacitor (Li-HEC). The cycling was limited to a potential window of 1.0 to 3.0 V to avoid lithium plating and the conversion reaction of the anode (to improve cycle life). Cyclic voltammograms revealed plots similar to those previously reported for similar Li-HECs [16,63]. Visible peaks for redox reactions were fairly indistinct at the slowest scan rate of 5 mV s-1, indicating good capacitor behaviour [64]. With increasing scan rate, the plots became increasingly featureless and broader (see Figure 9c). Interestingly, the behaviour was as would be expected for a typical Li-HEC, i.e. combining both capacitor-like and battery-like charge storage mechanisms [64–66]. During charging, fast Faradaic reactions of lithium cations with the anode, and hexafluorophosphate anion absorption onto the active carbon cathode, were expected. During discharging, PF6- desorption and Li+ extraction from the active material in the anode were expected [9,10,67].
Figure 10. Cyclic charge/discharge measurements of TiO2/MoO2//AC Li-ion hybrid electrochemical capacitor at varying current densities.
[image:16.596.158.441.476.666.2]
Where Q was the charge (C), ΔV was the voltage change (V) and m was the mass of active material in both the anode and cathode (g). The TiO2/MoO2//AC Li-HEC showed specific capacitances of 44, 36, 33, 26, and 18 F g-1 at scan rates of 5, 10, 20, 50, and 100 mV s-1, respectively (see Figure 9d).
These values were in good agreement with the results from the cyclic charge/discharge measurements, which were analysed using Equations (8) and (9):
(8)
(9)
Where I was the charge current (A), t was the discharge time (s), ΔV was the potential window (V), and m was the mass of active material in both the anode and cathode (g). Emax and Emin were the
potentials at the beginning and at the end of the discharge step.
At current densities of 2, 5, 10, and 20 mA cm-2, which were equivalent to specific currents of ca. 0.3, 0.75, 1.5 and 3.0 A g-1 (based on the mass of active materials in both cathode and anode), respectively, the TiO2/MoO2//AC Li-HEC showed specific capacitances of 40, 26, 19, and 12 F g-1 (equivalent to specific capacities of 22, 13, 8 and 4 mAh g-1), respectively. The charge/discharge curves had a nearly triangular shape, consistent with the expectations for a Li-HEC and indicative of good capacitive behaviour (see Figure 9a and 9b) [64]. The capacities and capacitances of the TiO2/MoO2//AC Li-HEC is shown in Figure 10.
After three formation cycles at 1 mV s-1, the Li-HEC using the composite as active material showed good capacity retention (65 %) over 3000 cycles at 5 mA cm-2.
To better compare these results to similar systems in the literature, power and energy densities were calculated using Equations (10), (11) and (12) to further investigate the performance:
(10)
(11)
(12)
Where Emax and Emin were the potentials at the beginning and the end of the discharge,
therefore, ΔV gave the average potential (V), I was the current (A), m was the mass of the active materials in both anode and cathode (kg) and t was the discharge time (s).
Figure 11. Ragone plot of the results herein compared to devices using anodes such as TiO2-Reduced Graphene oxide and anatase TiO2 [63], Li4Ti5O12 [69], TiO2-B [70], TiO2(B) [71], LiCrTiO4 [72], Ti9O17 [73], TiO2-Reduced Graphene oxide (2016) and Li4Ti5O12 (2016) [68], TiO2 microspheres wrapped with graphene nanosheets versus a graphene nanosheet positive electrode [74].
4. CONCLUSIONS
Nano-sized pure MoO2 and a TiO2/MoO2 nanocomposite were separately synthesised using a one-step continuous hydrothermal flow synthesis method. Adding 20 mol% titanium salt in the precursor feed containing the Mo salt significantly improved reaction yield and reduced the size of MoO2 particles, which resulted in a fivefold increase in surface area.
The presence of TiO2 and small size of MoO2 in the composite material significantly improved the electrode cycle life in Li-ion half-cells. The reduced average particle size increased lithium-ion diffusion and facilitated larger pseudocapacitive contributions to charge storage, which led to better high-rate performance compared to pure MoO2. The improved cycling stability of the composite was believed to be a result of TiO2 acting as a buffer (to excessive volume changes) and an anchor for Mo and MoO2 species that were formed/reformed during cycling.
[image:18.596.77.521.70.371.2]
active anode material and an activated carbon cathode, showed high energy densities of 44 Wh kg-1 and 15 Wh kg-1 at power densities of 600 W kg-1 and 2700 W kg-1, respectively.
ACKNOWLEDGEMENTS
The EPSRC are thanked for funding the Centre for Doctoral Training in Molecular Modelling & Materials Science (UCL, UK) and JAIST (Kanazawa, Japan) are thanked for supporting a studentship for DB. DJLB and PRS thank EPSRC for support of the ELEVATE (ELEctrochemical Vehicle Advanced TEchnology) low carbon vehicles project (EPSRC Ref. EP/M009394/1). JAD and CLS thank the JUICED Energy Hub for support (EPSRC Ref. EP/R023662/1).
References
1. G. Arunabha and Y. Lee, ChemsucChem, 5 (2012) 797. 2. W.J. Zhang, J. Power Sources, 196 (2011) 13.
3. M. Armand and J.-M. Tarascon, Nature, 451 (2008) 652. 4. J.M. Tarascon and M. Armand, Nature, 414 (2001) 359.
5. C. Lin, B. Ding, Y. Xin, F. Cheng, M.O. Lai, L. Lu and H. Zhou, J. Power Sources, 248 (2014) 1034.
6. M.R. Palacín, Chem. Soc. Rev., 38 (2009) 2565.
7. M. Winter and R.J. Brodd, Chem. Rev., 104 (2004) 4245.
8. H. Ibrahim, A. Ilinca and J. Perron, Renew. Sustain. Energy Rev., 12 (2008) 1221. 9. Z. Chen, V. Augustyn, X. Jia, Q. Xiao, B. Dunn and Y. Lu, ACS Nano, 6 (2012) 4319. 10. W. Zuo, R. Li, C. Zhou, Y. Li, J. Xia and J. Liu, Adv. Sci., 4 (2017) 1600539.
11. V. Aravindan, J. Gnanaraj, Y.-S. Lee and S. Madhavi, Chem. Rev., 114 (2014) 11619. 12. H.-S. Kim, J.B. Cook, S.H. Tolbert and B. Dunn, J. Electrochem. Soc., 162 (2015) A5083. 13. I.D. Johnson, E. Blagovidova, P.A. Dingwall, D.J.L. Brett, P.R. Shearing and J.A. Darr, J. Power
Sources, 326 (2016) 476.
14. J. Wang, J. Polleux, J. Lim and B. Dunn, J. Phys. Chem. C, 111 (2007) 14925.
15. M. Lübke, J. Shin, P. Marchand, P. Shearing, D. Brett, Z. Liu and J.A. Darr, J. Mater. Chem. A, 3 (2015) 22908.
16. D. Bauer, A.J. Roberts, N. Matsumi and J.A. Darr, Nanotechnology, 28 (2017) 195403. 17. A.G. Dylla, G. Henkelman and K.J. Stevenson, Acc. Chem. Res., 46 (2013) 1104.
18. H. Liu, Z. Bi, X.-G. Sun, R.R. Unocic, M.P. Paranthaman, S. Dai and G.M. Brown, Adv. Mater., 23 (2011) 3450.
19. U. Kumar Sen, A. Shaligram and S. Mitra, ACS Appl. Mater. Interfaces, 6 (2014) 14311. 20. Y. Shi, B. Guo, S.A. Corr, Q. Shi, Y.S. Hu, K.R. Heier, L. Chen, R. Seshadri and G.D. Stucky,
Nano Lett., 9 (2009) 4215.
21. B. Guo, X. Fang, B. Li, Y. Shi, C. Ouyang, Y.S. Hu, Z. Wang, G.D. Stucky and L. Chen, Chem. Mater., 24 (2012) 457.
22. Y. Sun, X. Hu, W. Luo and Y. Huang, J. Mater. Chem., 22 (2012) 425.
23. Y. Xu, R. Yi, B. Yuan, X. Wu, M. Dunwell, Q. Lin, L. Fei, S. Deng, P. Andersen, D. Wang and H. Luo, J. Phys. Chem. Lett., 3 (2012) 309.
24. F. Xia, X. Hu, Y. Sun, W. Luo and Y. Huang, Nanoscale, 4 (2012) 4707.
25. K. Zhu, Q. Wang, J.H. Kim, A.A. Pesaran and A.J. Frank, J. Phys. Chem. C, 116 (2012) 11895. 26. J.J. Auborn and Y.L. Barberio, J. Electrochem. Soc., 134 (1987) 638.
29. S. Li, Int. J. Electrochem. Sci., 13 (2018) 23.
30. S.E. Kim, K.W. Kim, S.W. Lee, S.O. Kim, J.S. Kim and J.K. Lee, Curr. Appl. Phys., 13 (2013) 1923.
31. X. Zhu, C. Yang, F. Xiao, J. Wang and X. Su, New J. Chem., 39 (2015) 683. 32. B.G. Lee, S.C. Nam and J. Choi, Curr. Appl. Phys., 12 (2012) 1580.
33. D. Wang, D. Choi, Z. Yang, V. V Viswanathan, Z. Nie, C. Wang, Y. Song, J. Zhang and J. Liu, Chem. Mater., (2008) 3435.
34. Q. Cheng, Int. J. Electrochem. Sci., 13 (2018) 265.
35. Y. Liang, Z. Yi, S. Yang, L. Zhou, J. Sun and Y. Zhou, Solid State Ion., 177 (2006) 501.
36. H. Choi, J.H. Heo, S. Ha, B.W. Kwon, S.P. Yoon, J. Han, W.S. Kim, S.H. Im and J. Kim, Chem. Eng. J., 310 (2017) 179.
37. O. Marin-Flores, T. Turba, C. Ellefson, K. Wang, J. Breit, J. Ahn, M.G. Norton and S. Ha, Appl. Catal. B Environ., 98 (2010) 186.
38. X. Liu, W. Ji, J. Liang, L. Peng and W. Hou, Phys. Chem. Chem. Phys., 16 (2014) 20570. 39. J.A. Darr and M. Poliakoff, Chem. Rev., 99 (1999) 495.
40. Z. Zhang, J.B.M. Goodall, S. Brown, L. Karlsson, R.J.H. Clark, J.L. Hutchison, I.U. Rehman and J.A. Darr, Dalton Trans., 39 (2010) 711.
41. T. Adschiri, Y.-W. Lee, M. Goto and S. Takami, Green Chem., 13 (2011) 1380. 42. J.A. Darr, J. Zhang, N.M. Makwana and X. Weng, Chem. Rev., 117 (2017) 11125.
43. M. Chen, C.Y. Ma, T. Mahmud, J.A. Darr and X.Z. Wang, J. Supercrit. Fluids, 59 (2011) 131. 44. R.I. Gruar, C.J. Tighe and J.A. Darr, Ind. Eng. Chem. Res., 52 (2013) 5270.
45. J.A. Darr, C.J. Tighe and R.I. Gruar, (United States: US2013/0136687 A1.)
46. A. Katrib, J.W. Sobczak, M. Krawczyk, L. Zommer, A. Benadda, A. Jablonski and G. Maire, Surf. Interface Anal., 34 (2002) 225.
47. J. Baltrusaitis, B. Mendoza-Sanchez, V. Fernandez, R. Veenstra, N. Dukstiene, A. Roberts and N. Fairley, Appl. Surf. Sci., 326 (2015) 151.
48. Z. Deng, Y. Hu, D. Ren, S. Lin, H. Jiang and C. Li, Chem. Commun. (Camb)., 51 (2015) 13838. 49. Z. Zhang, S. Brown, J.B.M. Goodall, X. Weng, K. Thompson, K. Gong, S. Kellici, R.J.H. Clark,
J.R.G. Evans and J.A. Darr, J. Alloys Compd., 476 (2009) 451.
50. L. Zeng, C. Zheng, C. Deng, X. Ding and M. Wei, ACS Appl. Mater. Interfaces, 5 (2013) 2182. 51. R. Van De Krol, A. Goossens and J. Schoonman, J. Phys. Chem. B, 103 (1999) 7151.
52. S.K. Das, M. Gnanavel, M.U.M. Patel, C. Shivakumara and A.J. Bhattacharyya, J. Electrochem. Soc., 158 (2011) A1290.
53. J.E.B. Randles, Trans. Faraday Soc., 44 (1948) 327.
54. V. Augustyn, P. Simon and B. Dunn, Energy Environ. Sci., 7 (2014) 1597.
55. V. Augustyn, J. Come, M.A. Lowe, J.W. Kim, P.-L. Taberna, S.H. Tolbert, H.D. Abruña, P. Simon and B. Dunn, Nat. Mater., 12 (2013) 518.
56. D. Bresser, E. Paillard, M. Copley, P. Bishop, M. Winter and S. Passerini, J. Power Sources, 219 (2012) 217.
57. M. Lübke, I. Johnson, N.M. Makwana, D. Brett, P. Shearing, Z. Liu and J.A. Darr, J. Power Sources, 294 (2015) 94.
58. Y. Yang, Y. Bai, S. Zhao, Q. Chang and W. Zhang, J. Alloys Compd., 579 (2013) 7. 59. X. Zhu, X. Liang, X. Fan and X. Su, RSC Adv., 7 (2017) 38119.
60. P. V. Braun, J. Cho, J.H. Pikul, W.P. King and H. Zhang, Curr. Opin. Solid State Mater. Sci., 16 (2012) 186.
61. J. Li, A.K. Dozier, Y. Li, F. Yang and Y.-T. Cheng, J. Electrochem. Soc., 158 (2011) A689.
62. Y. Luo, J. Luo, J. Jiang, W. Zhou, H. Yang, X. Qi, H. Zhang, H.J. Fan, D.Y.W. Yu, C.M. Li and T. Yu, Energy Environ. Sci., 5 (2012) 6559.
64. K. Karthikeyan, S. Amaresh, V. Aravindan, H. Kim, K.S. Kang and Y.S. Lee, J. Mater. Chem. A, 1 (2013) 707.
65. J. Yin, L. Qi and H. Wang, ACS Appl. Mater. Interfaces, 4 (2012) 2762.
66. X. Liu, N. Zhang, J. Ni and L. Gao, J. Solid State Electrochem., 17 (2013) 1939.
67. N. Arun, A. Jain, V. Aravindan, S. Jayaraman, W. Chui Ling, M.P. Srinivasan and S. Madhavi, Nano Energy, 12 (2015) 69.
68. H.K. Kim, D. Mhamane, M.S. Kim, H.K. Roh, V. Aravindan, S. Madhavi, K.C. Roh and K.B. Kim, J. Power Sources, 327 (2016) 171.
69. J. Ni, L. Yang, H. Wang and L. Gao, J. Solid State Electrochem., 16 (2012) 2791. 70. Q. Wang, Z. Wen and J. Li, Adv. Funct. Mater., 16 (2006) 2141.
71. V. Aravindan, N. Shubha, W.C. Ling and S. Madhavi, J. Mater. Chem. A, 1 (2013) 6145. 72. V. Aravindan, W. Chuiling and S. Madhavi, J. Mater. Chem., 22 (2012) 16026.
73. W.-Q. Han and X.-L. Wang, Appl. Phys. Lett., 97 (2010) 2431041.
74. F. Wang, C. Wang, Y. Zhao, Z. Liu, Z. Chang, L. Fu, Y. Zhu, Y. Wu and D. Zhao, Small, 12 (2016) 6207


![Figure 11. Ragone plot of the results herein compared to devices using anodes such as TiO2-Reduced Graphene oxide and anatase TiO2 [63], Li4Ti5O12 [69], TiO2-B [70], TiO2(B) [71], LiCrTiO4 [72], Ti9O17 [73], TiO2-Reduced Graphene oxide (2016) and Li4Ti5O1](https://thumb-us.123doks.com/thumbv2/123dok_us/1787896.133077/18.596.77.521.70.371/ragone-compared-reduced-graphene-anatase-licrtio-reduced-graphene.webp)
