Int. J. Electrochem. Sci., 13 (2018) 4055 – 4070, doi: 10.20964/2018.05.48
International Journal of
ELECTROCHEMICAL
SCIENCE
www.electrochemsci.org
Effect of Silane Coating on the Corrosion Resistance of TiO
2Conversion Films
Delin Lai, Gang Kong*, Xinrui Miao, Chunshan Che
School of Materials Science and Engineering, South China University of Technology,
*
E-mail: [email protected]
Received: 2 January 2018 / Accepted: 5 March 2018 / Published: 10 April 2018
TiO2 conversion films were prepared on surfaces undergoing the hot-dip galvanizing (HDG) process
using titanium sulphate (Ti(SO4)2) as the titanium source and hydrogen peroxide (H2O2) as the
chelating agent by a one-step impregnation method. The effect of passivation time on the morphology and corrosion resistance of the film was investigated. The results show that a large amount of TiO2
nanospheres appear on the HDG surface after a short immersion time. By increasing the immersion time, the nanospheres are gradually covered by the ZnO/Zn(OH)2 conversion film, and some cracks
appear on the conversion film. The electrochemical results reveal that the integral TiO2 conversion
film shows better corrosion resistance, and the cracks cause the pitting of the corrosion resistance. To improve its corrosion resistance, the TiO2 conversion film was modified by silane to realize
hydrophobic sealing, which results in obvious changes in the morphology and corrosion resistance. After modification, the gel layer covered the TiO2 conversion film, which would fill the cracks and
make the film hydrophobic. Thus, the corrosion resistance of the modified conversion film increased. The better the hydrophobicity of the film is, the better the corrosion resistance of the film is for a short immersion time. In addition, the corrosion resistance of the hydrophobic film is mainly determined by the bottom TiO2 conversion film.
Keywords: TiO2; Hydrophobic; Conversion film; Corrosion resistance; Silane
1. INTRODUCTION
Int. J. Electrochem. Sci., Vol. 13, 2018
4056 increasing attention[2]. Chromium-free passivation is mainly classified into inorganic salt passivation, organic passivation, and organic/ inorganic hybrid passivation. Inorganic salt passivation mainly includes silicate[3], molybdate[4], and rare earth salts[5]. Organic passivation mainly consists of phytic acid[6], acrylic resin[7], and silane[8].
Titanium (Ti) is very similar in nature to chromium and is stable in the natural environment resulting from the robust TiO2 formed on the Ti surface. The Ti(OH)4/TiO2 film, as an environmentally
friendly type of chromium-free conversion film, is formed on the HDG surface, which could effectively improve the corrosion resistance of the matrix. Many researchers have studied the formation mechanism of titanium conversion films on steel[9], copper[10], and magnesium alloys[11]. They found that TiO2 conversion films could effectively improve the corrosion resistance of these alloys. However, as far as we know, few works have focused on the formation of TiO2 conversion films on the HDG surfaces[7].
TiO2 passivation can improve the corrosion resistance of the galvanized layer. However, there
are some cracks on the surface of the conversion film that affect the corrosion resistance of the film. The hybrid or sealing treatment can solve this problem to some extent[12]. Simultaneously, the hydrophobic treatment can increase the corrosion resistance of the conversion film[13]. In this paper, a layer of TiO2 conversion film with a certain degree of roughness was prepared on the HDG surface,
and the effects of the treatment time on the morphology and corrosion resistance of the film were investigated. Then, the hydrophobic sealing treatment was used to improve corrosion resistance of the conversion film. the effects of silane treatment on the morphology, water repellency and corrosion resistance were explored.
2. EXPERIMENTAL
TiO2 conversion solution was prepared by adding 1 g of Ti(SO4)2 and 60 mL of 30% H2O2 into
940 mL of deionized water. The pH of the solution was adjusted to 2.0 by a 1 M H2SO4 solution.
The silane-modified solution was prepared via the sol-gel method, using TEOS (tetraethoxysilane) as a precursor, EtOH as a solvent, and HMDS (hexamethyldisiloxane) as a modification component. The molar ratio of the solution was TEOS/HMDS/C2H5OH/H2O =
1:2:96:4[14]. First, the TEOS, EtOH, and distilled water were mixed by vigorous stirring for 12 h at room temperature. Then, HMDS was added into the mixed solution. After that, the solution was aged for 2 h at 80 °C.
The hydrolysis reaction of TEOS and HMDS are shown in Eq. (1) and (2): Si(OCH2CH3)4+ H2O→Si(OH)n(OCH2CH3)m n+m=4 (1)
(CH3)3SiNH(CH3)3+H2O→2(CH3)3Si-OH +NH3 (2)
Simultaneously, the polymerization reactions happen between the hydrolysis products of TEOS and HMDS, the modification solution is formed.
Si(OH)n(OCH2CH3)m + (CH3)3Si-OH →Si(OH)3-Si(A)3
The HDG substrate (zinc layer thickness of approximately 50 μm) was prepared using the following process. Q235 cold rolled steel sheets of 50 mm × 40 mm × 2 mm were degreased, pickled and then fluxed in a mixed solution of 150 g/L NH4Cl and 100 g/L ZnCl2 at 60 °С. The samples were
dried and dipped in a zinc bath at 450 °С for 1 min, and then, they were withdrawn slowly and quenched in water immediately. Prior to immersion, the HDG samples were rinsed with ethanol and deionized water.
HDG samples were immersed at ambient temperature for 10 s, 60 s, 300 s, and 1800 s in TiO2
conversion solution, respectively. After immersion, the samples were dried at 120 °C for 30 min. The samples were named T10, T60, T300, and T1800, respectively. Furthermore, the conversion films were immersed into the silane-modified solution for 2 hours and then dried at 120 °C for 30 min. The silane-modified conversion films were named as T10M, T60M, T300M, and T1800M, respectively.
The morphologies of the samples were observed using a higher resolution scanning electron microscope (SEM, Nanosem 430, Nova, USA). The chemical composition of the surface was analysed by using an energy-dispersive spectrometer (EDS, X'Pert Pro, Philips, Netherlands). The coatings were also investigated by X-ray diffraction analysis (XRD, X'Pert Pro, Philips, Netherlands) and X-ray photoelectron spectroscope (XPS, PHI-5702, Perkin Elmer, USA). The water contact angles (WCAs) of the coatings were obtained by using an optical contact angle metre (OCA15, DataPhysics Instruments GmbH, Germany) with a 5 µL water droplet at room temperature (∼26 °C).
The potentiodynamic polarization (PDP) and electrochemical impedance spectroscopy (EIS) measurements were used to evaluate the corrosion resistance of the samples in a 5 wt.% NaCl solution. A three-electrode system (Model: 760C) was constructed to serve as the electrochemical reactor, in which a saturated calomel electrode (SCE) acted as the reference electrode, a platinum foil acted as the auxiliary electrode and the sample with an exposed area of 1.00 cm2 acted as the working electrode. EIS tests were carried out in a frequency range between 100 kHz and 10 mHz by applying an AC excitation of 10 mV amplitude of sinusoidal voltage. The scan rate for polarization was 1 mV/s. The EIS data of samples were evaluated using the ZView software (version 2.1C)[15]. The PDP tests were recorded from -0.2 V (vs. OCP, open circuit potential) to +0.2 V (vs. OCP) with a scan rate of 1 mV/s.
3. RESULTS AND DISCUSSION
3.1. XPS
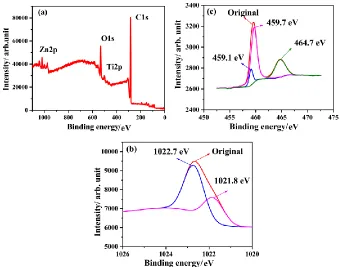
The conversion film sample with good corrosion was chosen to analyse the components. Fig. 1 is the XPS spectrum of T60 and the spectra of Zn2p and Ti2p. The conversion film is composed of the elements Zn, O, and Ti (Fig. 1a), element C comes form pollution. The Zn2p spectrum (Fig. 1b) exhibits two peaks at 1021.61 eV (Zn2p3/2) and 1022.70 eV (Zn2p3/2), which are attributed to ZnO and Zn(OH)2[16]. Simultaneously, the Ti2p spectrum (Fig. 1c) exhibits two peaks at 458.28 eV
(Ti2p3/2) and 463.96 eV (Ti2p1/2) corresponding to TiO2 and Ti(OH)4[17]. It is shown that after
passivation treatment, the conversion films with Ti(OH)4/TiO2 and ZnO/Zn(OH)2 have been formed on
Int. J. Electrochem. Sci., Vol. 13, 2018
[image:4.596.128.469.76.343.2]4058
Figure 1. XPS spectra of (a) T60, (b) Zn2p, and (c) Ti2p.
3.2. XRD
Figure 2. XRD spectra of the T60 and T60M samples.
[image:4.596.137.462.427.693.2]
been found that there are two peaks at 54.1° and 55° for T60 and T60M, which can be assigned to the (105) and (211) planes of TiO2 with anatase phase (according to the JCPDS standards, Card No.
21-1272[19]), respectively. However, the intensity of the TiO2 peak decrease after silane treatment. The
XRD plots of T60M (Fig. 2c) display that a diffraction peak at 2=18° is attributed to the amorphous SiO2[20]. The results indicate that after the sealing with silane, the amorphous silane gel layer covers
the TiO2 conversion film surface.
3.3. Morphology of TiO2 and silane-modified conversion films on HDG surfaces
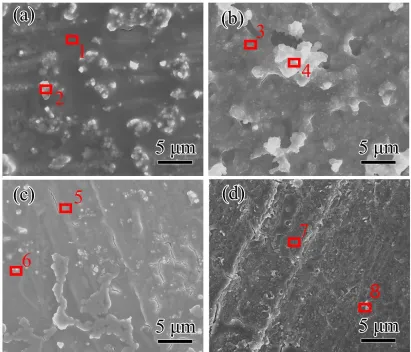
SEM images (Fig. 3) show the surface morphologies of TiO2 conversion films on HDG
[image:5.596.136.458.305.524.2]surfaces with different immersion times in the Ti(SO4)2 solution.
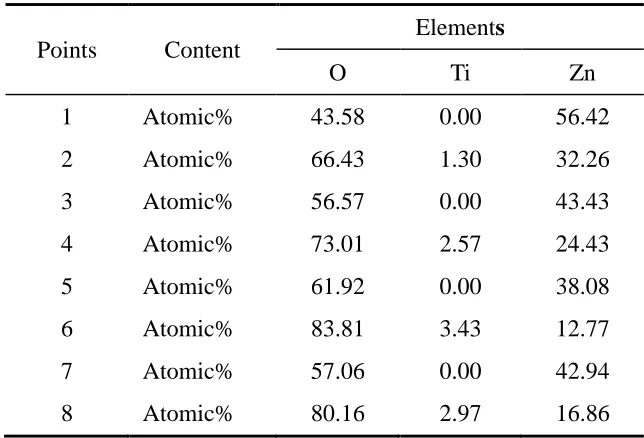
Table 1. EDS data of different areas showing the elemental components for TiO2 conversion films.
Points Content
Elements
O Ti Zn
1 Atomic% 43.58 0.00 56.42
2 Atomic% 66.43 1.30 32.26
3 Atomic% 56.57 0.00 43.43
4 Atomic% 73.01 2.57 24.43
5 Atomic% 61.92 0.00 38.08
6 Atomic% 83.81 3.43 12.77
7 Atomic% 57.06 0.00 42.94
8 Atomic% 80.16 2.97 16.86
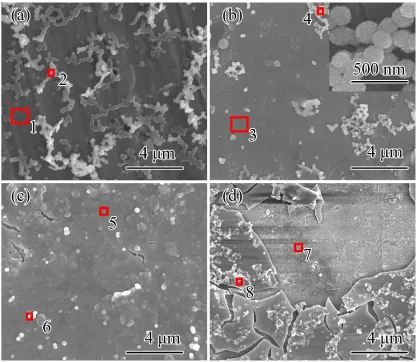
Table 1 is the EDS data obtained from different red regions in Fig. 3. It can be found that after 10 s of treatment (Fig. 3a), the conversion film with an abundance of powder is formed on the HDG surface. After 60 s of reaction, a relatively smoother film is formed on the HDG surface (Fig. 3b). Some nanoparticles can also be found on the film. From the magnified SEM image in Fig. 3b, the aggregations are rough round particles. When the immersion time increases to 300 s, the thickness of the conversion film is thicker, and a few small cracks occur resulting from the surface stress (Fig. 3c). When the immersion time is increased to 1800 s, the cracks become larger, and some conversion film has peeled off (Fig. 3d). The roughness of the conversion film increases with an increase of the passivation time. From the EDS data, the smooth region (regions 1, 3, 5, 7) comprised Zn and O elements. The aggregations (region 2, 4, 6, 8) consist of Zn, O, and Ti elements and are TiO2-rich.
Int. J. Electrochem. Sci., Vol. 13, 2018
4060
Figure 3. SEM images showing the surface morphologies of (a) T10, (b) T60, (c) T300, and (d) T1800.
The formation process of the conversion film can be concluded to occur as follows: when the HDG was dipped into the passivation solution, a displacement reaction occurs between Zn and H+, and a depolarization reduction reaction occurs between H+ ions and O2[21]. The chemical decomposition
reaction of H2O2 provides O2 to the solution and further produces more OH- ions, which promotes the
increase in the pH value of the solution. The reactions may occur as follows[22]: Zn+2H+→Zn2++H2 (4)
O2+2H2O+4e→4OH- (5)
The increasing amount of OH- ions provides the conditions to form Ti(OH)4 and Zn(OH)2.
When the pH of the small region is larger than 2.5, the deposition of Ti4+ induces the formation of Ti(OH)4/TiO2[23]. Simultaneously, Li[17] reported that the Ti4+ ions that come from the Ti(SO4)2
combine with the OH- to form the TiO2 nanoparticlesin weak alkaline conditions, and thus, the TiO2
nanoparticles preferentially deposit onto the HDG surface. The formation of TiO2 nanoparticles may
occur as follows:
[Ti(OH)2·(H2O)4]2++2OH-→[Ti(OH)4·(H2O)2]+2H2O (6)
[image:6.596.90.509.68.430.2]
When the pH of the small region is larger than 8, Zn(OH)2/ZnO deposits on the HDG
surface[24], which covers the TiO2 nanoparticles to form the smooth conversion film. The formation
of the Zn(OH)2/ZnO layer may be written as follows:
Zn2++2OH-→Zn(OH)2 (8)
Zn(OH)2→ZnO+H2O (9)
From the SEM (Fig. 3) and EDS (Table 1) results, it can be determined that after 10 s of reaction, the TiO2 nanoparticles are first formed on the HDG surface. The formation of Zn(OH)2/ZnO
is lagging, and the layer of Zn(OH)2/ZnO is relatively thin so that it cannot cover the TiO2
nanoparticles completely. By increasing the immersion time, a dense Zn(OH)2/ZnO layer could cover
the TiO2 nanoparticles. It can be noted that the TiO2 nanoparticles have been inserted into the
conversion film. With further increases in the immersion time, the denser layer begins to crack due to internal stress[25].
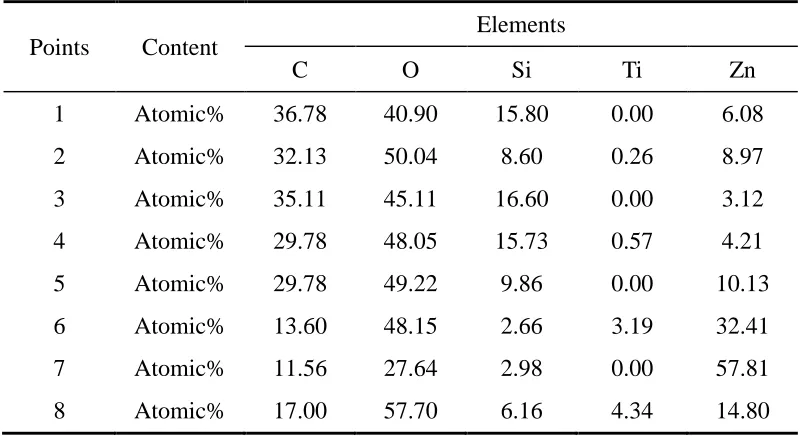
Table 2. EDS data of different areas showing the elemental components of silane-modified conversion films.
Points Content
Elements
C O Si Ti Zn
1 Atomic% 36.78 40.90 15.80 0.00 6.08
2 Atomic% 32.13 50.04 8.60 0.26 8.97
3 Atomic% 35.11 45.11 16.60 0.00 3.12
4 Atomic% 29.78 48.05 15.73 0.57 4.21
5 Atomic% 29.78 49.22 9.86 0.00 10.13
6 Atomic% 13.60 48.15 2.66 3.19 32.41
7 Atomic% 11.56 27.64 2.98 0.00 57.81
8 Atomic% 17.00 57.70 6.16 4.34 14.80
Fig. 4 shows the surface morphologies of silane-modified conversion films. After modification, all the conversion films are relatively smooth, and the cracks disappear. The EDS results (Table 2) display that the flat regions of the modified films are comprised of the elements O, C, Si, and Zn, and the particles contain the elements O, C, Si, Zn, and Ti. The results demonstrate that after the modification process, the TiO2 conversion film has been covered by a silane gel layer[26]. A large
number of hydroxyl groups exist on the TiO2 conversion film, and when the conversion films is
immersed into the modification solution, dehydration synthesis occurs between the conversion film and solution[26]. The reactions between the conversion film and silane modification solution may be written as Eq. (10) and (11). A layer of SiO2 layer with hydrophobic groups forms on the TiO2
conversion film.
[image:7.596.98.498.350.568.2]Int. J. Electrochem. Sci., Vol. 13, 2018
4062 -O-Zn-OH+Si(OH)3-Si(A)3→-O-Zn-O-Si(OH)2O-Si(A)3
[image:8.596.93.504.133.485.2]A: ((CH3)3SiO)x(SiO)y(OH) x, y>1, integer (11)
Figure 4. SEM images showing the surface morphologies of (a) T10M, (b) T60M, (c) T300M, and (d) T1800M.
3.3. Effect of silane modification on the water repellence of the conversion film
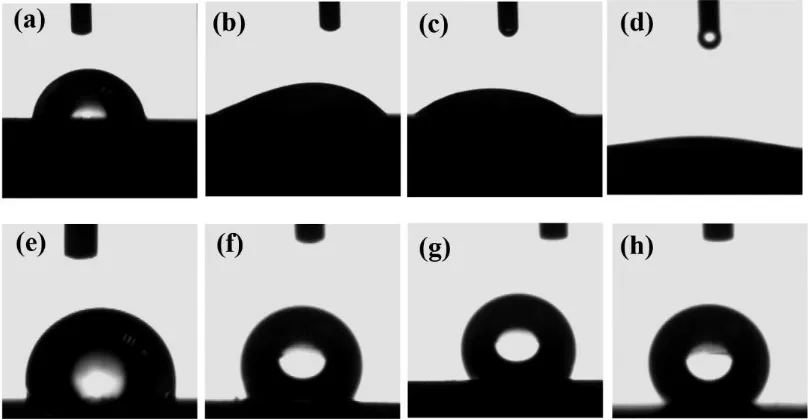
Fig. 5 shows the WCAs of TiO2 conversion films and silane-modified films. The WCA of T10
is 70° (Fig. 5a), which is similar with that of pure zinc[27]. T60 has a WCA of 25° (Fig. 5b) because a large amount of hydroxyl groups exist in the TiO2 conversion film. The WCAs of T300 and T1800 are
15° and 9° (Fig. 5c-d), respectively, indicating that prolonging the passivation time causes a decrease in the hydrophobicity of the TiO2 conversion films. The reason is that the roughness of the coating
Figure 5. WCA images of (a) T10, (b) T60, (c) T300, (d) T1800, (e) T10M, (f) 60M, (g) T300M, and (h) T1800M.
0
cos
r
cos
(12)Fig. 5e is the WCA image of T10M. The silane-modified film becomes hydrophobic with a WCA of 102.9° as a low surface material modification. Similarly, the WCA values of T60M, T300M and T1800M are 122°, 128°, and 131° (Fig. 5f-h), respectively. The roughness of the film increases with an increased immersion time, which results in the stronger hydrophobicity of the modified films. The results are consistent with the typical Wenzel model[28].
3.4. Anti-corrosion performance
[image:9.596.45.563.560.667.2]3.4.1 Anti-corrosion performance of TiO2 conversion films
Table 3. Electrochemical parameters obtained on the TiO2 conversion films
Samples Icorr (μA/cm2) Ecorr/ V vs. SCE Rp (·cm2) ba (mV/decade) bc (mV/decade)
T10 1.05 -1.143 8679 42.25 -40.27
T60 0.55 -1.037 12843 68.87 -21.32
T300 4.20 -1.102 2309 46.28 -43.20
T1800 15.37 -1.109 581 45.90 -37.23
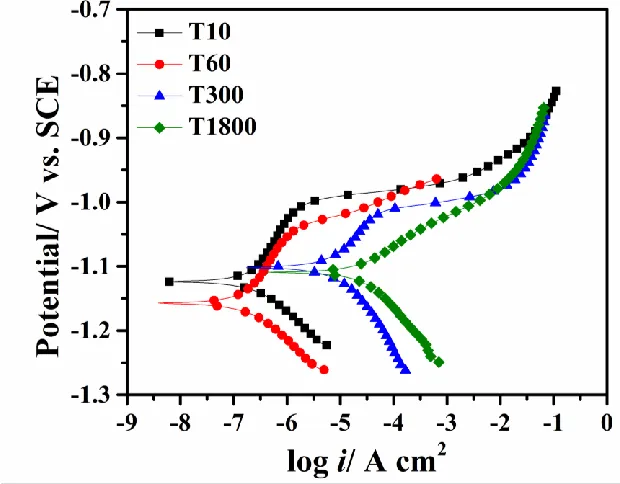
PDP and EIS were employed to evaluate the corrosion protection performance and to provide insight on the corrosion mechanism of the TiO2 and hydrophobic conversion films. Fig. 6 shows the
PDP curves of TiO2 conversion films with different immersion times in the Ti(SO4)2 solution. Table 3
shows the fitted results from Fig. 6. The corrosion current (icorr) for T60 is minimal, approximately 0.55 μA/ cm2
Int. J. Electrochem. Sci., Vol. 13, 2018
[image:10.596.142.452.229.471.2]4064 compared to those for T10 and T60, the lower the icorr, the lower corrosion rate for conversion film in the solution[29]. The anodic and cathodic branches for T300 and T1800 move towards the direction of a current increase compared with that of T60. Due to the existence of cracks for T300 and T1800, the corrosion medium can permeate through the conversion film, and the corrosion reaction occurs on the HDG surface, which results in decreases in the corrosion resistance of samples. Among the conversion films, T60 exhibits better protective properties relative to T10, T300, and T1800. The icorrof T1800 is similar to that of pure zinc[30], indicating that the cracks are a disadvantage to determine the corrosion resistance of the conversion films.
Figure 6. Potentiodynamic polarization curves for TiO2 conversion films with different immersion
times in 5 wt.% NaCl solution.
[image:10.596.61.537.537.719.2][image:11.596.47.549.303.397.2]
The Nyquist and Bode diagrams for the conversion films immersed in 5 wt.% NaCl are shown in Fig. 7. The corrosion resistance can also be calculated from the total impedance values (|Z|j→0). The higher the |Z|j→0, the lower corrosion rate for conversion film in the solution[29]. The value of |Z|j→0 for T10 and T60 are 1.04 × 104 cm2 and 1.06 × 104 cm2, respectively. The value of |Z|j→0 for the T60 sample is higher than those of the T300 and T1800 samples. The results are in good agreement with the results of PDP and further indicate that the corrosion resistance decreases with the increase of the immersion time due to the appearance of cracks. The Bode diagram shows that there are two-time constants for the conversion films, in which the capacitive resistance rings at high frequency are ascribed to the conversion films and those at low frequency are the charge transfer reaction at the inner film and substrate interface.
Table 4. Fitted results of EIS parameters obtained on the TiO2 conversion films.
Samples Rs (Ω cm2)
CPEf Rf
(Ω cm2)
Cdl Rct
(Ω cm2) Yf (sn/ Ω cm2) nf Ydl (sn/ Ω cm2) ndl
T10 1.3 5.0E-5 0.75 1800 3.3E-4 0.67 10605
T60 0.9 3.3E-5 0.66 7520 1.5E-4 0.85 6543
T300 1.7 6.5E-5 0.76 1600 1.3E-3 0.78 2750
T1800 1.0 9.4E-5 0.70 270 1.8E-3 0.73 750
Figure 8. Equivalent circuit schematizing the coating/NaCl solution interface of T10, T60, T300, and T1800.
Int. J. Electrochem. Sci., Vol. 13, 2018
4066 3.4.2 Anti-corrosion performance of hydrophobic conversion films
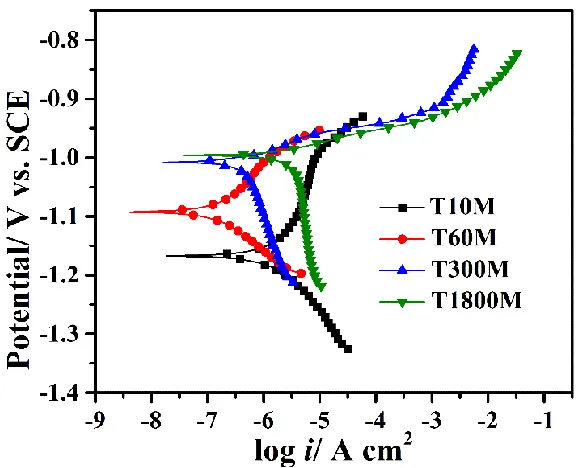
The PDP curves for hydrophobic silane-modified conversion films are shown in Fig. 9, and the corresponding electrochemical parameters obtained from the PDP curves are listed in Table 5. Compared with the PDP results of TiO2 conversion films, both the anodic and cathodic branches of
polarization curves for hydrophobic conversion films shift towards the direction where the icorr decreases, indicating that the anodic process and cathodic process of zinc corrosion are inhibited after silane treatment. From the Table 5, it can be found that the icorr values of the hydrophobic conversion films decrease and the polarization resistance values increase compared with the TiO2 conversion
[image:12.596.158.448.255.489.2]films.
Figure 9. Potentiodynamic polarization curves for silane-modified conversion films in a 5 wt.% NaCl solution.
Table 5. Electrochemical parameters obtained on the silane-modified conversion films
Samples (μA/cmIcorr 2
)
Ecorr/ V vs.
SCE
Rp (·cm2)
ba
(mV/decade)
bc
(mV/decade)
T10M 0.20 -1.167 28510 42.86 -47.60
T60M 0.10 -1.093 97510 45.32 -42.51
T300M 0.33 -1.008 14772 86.88 -28.10
T1800M 1.60 -0.996 4357 78.02 -20.39
The Nyquist and Bode diagrams for the hydrophobic conversion films in 5 wt.% NaCl are shown in Fig. 10. The total impedance values (|Z|j→0) of T10M, T60M, T300M, and T1800M are 18600, 31160, 5635, and 1891 cm2
[image:12.596.80.516.581.673.2]
capacitive loop in the high, medium and low frequency range, which is related to the double conversion films and HDG substrate/coating interface. For the T1800M, the conversion film has partly peeled off, and the EIS result shows the corrosion behaviour as if the silane film covers part of the HDG surface. Simultaneously, there is an inductive loop in the low frequency range which is related to the dissolution of zinc is inductive loop of pitting corrosion of the HDG[32].
In view of the different EIS behaviours of the hydrophobic TiO2 conversion films, different
equivalent circuits used to fit the EIS spectra are shown in Fig. 11. For T10M, T60M, and T300M, the silane film covers the TiO2 conversion film, a double conversion film has been formed on the HDG
surface. Thus, Rf1 and CPEf1 are added in the equivalent circuit as shown in Fig. 11a to fit T10M,
[image:13.596.99.493.274.419.2]T60M and T300M[33]. For T1800M, the two-time constant is used to fit T1800M, as shown in Fig. 11b.
Figure 10. EIS (a) Nyquist plots and (b) Bode plots (log |Z| Vs log Freq and phase angle vs log Freq) for hydrophobic conversion films in a 5 wt.% NaCl solution.
Figure 11. Equivalent circuits schematizing the coating/NaCl solution of (a) T10M, T60M, and T300M; and (b) T1800M.
Table 6. Fitted results of EIS parameters obtained on the hydrophobic conversion films
Sample Rs (Ω cm2)
CPEf
Rf
(Ω cm2)
CPEf1
Rf1
(Ω cm2)
CPEdl
Rct
(Ω cm2)
RL
(Ω cm2)
L
(H/ cm2) Yf
(sn/ Ω cm2) nf
Yf1
(sn/ Ω cm2) nf1
Ydl
(sn/ Ω cm2) ndl
T10M 1.1 3.5E-6 0.74 1081 4.6E-5 0.42 17325 0.0012 0.92 15000 T60M 1.9 5.2E-6 0.77 290 1.1E-5 0.70 26000 8.62E-5 0.59 32000 T300M 1.3 1.3E-6 0.78 504 1.6E-5 0.67 3068 0.00022 0.99 3969
[image:13.596.54.522.433.562.2] [image:13.596.35.563.656.758.2]Int. J. Electrochem. Sci., Vol. 13, 2018
4068 In the circuits, Rs corresponds to the solution resistance; Rf represents the charge transfer resistance of the hydrophobic conversion film; Rf1 represents the charge transfer resistance of the TiO2
conversion film; Cdl represents the double layer capacitance; and Rct represents the resistance of the HDG substrate/coating interface due to the interaction between Zn-OH and Ti-O. For T1800M, the RL and L represent the inductive loop, which is related to the dissolution of zinc and is indicative of the pitting corrosion of the HDG, respectively. The fitted parameters are presented in Table 6. It is evident that T60M has the lowest capacitance and the highest resistance, indicating that it can effectively protect the zinc from corrosion.
The above experimental results have shown that the hydrophobic sealing of the silane on the TiO2 conversion films could significantly improve the corrosion resistance of the samples. T60M has
the best corrosion resistance because the double dense films are integrated. Even though the TiO2
[image:14.596.94.505.313.472.2]conversion films are peeled off, the filled silane film could have the effect of preservation, further protecting the HDG from corrosion.
Figure 12. EIS (a) Nyquist plots and (b) Bode plots (log |Z| Vs log Freq and phase angle vs log Freq) for hydrophobic TiO2 conversion films in a 5 wt.% NaCl solution for one minute.
To explore the effect of hydrophobicity on the corrosion resistance of the films, the EIS experiments were conducted after the samples were immersed in NaCl solution for 1 min. The EIS results are shown in Fig. 12. It that can be seen that during the early immersion stage, the T1800M film with the largest WCA shows the best corrosion resistance. Therefore, after modification by silane, the hydrophobicity of the films was better, and thus, the corrosion resistance of the coatings was better at the initial stage of immersion. This is because there is an unstable air layer on the surface, which results in the increase of the corrosion resistance of the coatings[34]. However, according to the EIS data, when the unstable air layer was destroyed, the corrosion resistance of the films decreased after a short period of immersion which is similar to previous reports[35]. The results demonstrate that the hydrophobicity of the films could increase the corrosion resistance of the samples. The T60 and T60M have the best corrosion resistance, respectively, indicating that the corrosion resistance of the composite film is mainly determined by the corrosion resistance of the TiO2 conversion film.
resistance of silane-modified conversion film for short time immersion is determined by the water repellency of conversion film. However, the long-time immersion of corrosion resistance is determined by the conversion film.
4. CONCLUSION
The conversion film with Ti(OH)4/TiO2 and Zn(OH)2/ZnO was prepared on the HDG surface
by a one-step impregnation method. The Ti(OH)4/TiO2 aggregates into particles that cover or embed
into the Zn(OH)2/ZnO layer. The roughness of film increased with increasing passivation time. The
corrosion resistance of the conversion film was first enhanced and decreased later with the increase of the passivation time. The integrated conversion film showed better corrosion resistance. After the silane hydrophobic sealing treatment, a layer of silane covered the conversion film, and the water repellence of the conversion film changes from hydrophilic to hydrophobic, which results in the increased corrosion resistance of the coatings. Therefore, the greater the roughness of conversion film, the better its hydrophobicity. The corrosion resistance of the film was not only related to the hydrophobicity but was also mainly determined by the TiO2 conversion film.
ACKNOWLEDGEMENTS
This work was supported by the National Natural Science Foundation of China (Grants 21103053, 91023002).
References
1. A. Phanasgaonkar, and V.S. Raja, Surf. Coatings Technol., 203 (2009) 2260. 2. Y. Hamlaoui, L. Tifouti, and F. Pedraza, Corros. Sci., 51 (2009) 2455.
3. M. R. Yuan, J. T. Lu, G. Kong, and C. S. Che, Surf. Coatings Technol., 205 (2011) 4466.
4. G. Kong, J. T. Lu, S. H. Zhang, C. S. Che, and H. J. Wu, Surf. Coatings Technol., 205 (2010) 545. 5. J. H. Park, W. S. Kim, D. H. Jo, J. S. Kim, and J. M. Park, J. Ind. Eng. Chem., 20 (2014) 1965. 6. S. L. Manchet, D. Verchère, and J. Landoulsi, Thin Solid Films, 520 (2012) 2009.
7. B. Ramezanzadeh, and M. M. Attar, Surf. Coatings Technol., 205 (2011) 4649. 8. M. Hara, R. Ichino, M. Okido, and N. Wada, Surf. Coatings Technol.,169 (2003) 679. 9. Y. Masuda, T. Sugiyama, W. S. Seo, and K. Koumoto, Chem. Mater., 15 (2003) 2469.
10.V. Saarimaa, E. Kauppinen, A. Markkula, J. Juhanoja, B. J. Skrifvars, and P. Steen, Surf. Coatings Technol., 206 (2012) 4173.
11.Y. Song, K. Dong, D. Shan, and E. H. Han, Appl. Surf. Sci., 314 (2014) 888.
12.X. H. Xu, Z. Z. Zhang, and W. Liu, Colloids Surfaces A Physicochem. Eng. Asp., 341 (2009) 21. 13.A. M. A. Mohamed, A. M. Abdullah, and N. A. Younan, Arab. J. Chem., 8 (2015) 749.
14.D. L. Lai, G. Kong, and C. S. Che, Surf. Coatings Technol., 315 (2017) 509.
15.V. Ezhilselvi, J. Nithin, J. N. Balaraju, and S. Subramanian, Surf. Coatings Technol., 288 (2016) 221.
16.X. H. Xu, Z. Z. Zhang, F. Guo, J. Yang, X. T. Zhu, X. Y. Zhou, and Q. J. Xue, Colloids Surfaces A Physicochem. Eng. Asp., 396 (2012) 90.
17.Z. Li, Y. Zhu, J. Wang, Q. Guo, and J. Li, Ceram. Int., 41 (2015) 9057.
Int. J. Electrochem. Sci., Vol. 13, 2018
4070 19.M. A. Vargas, and J. E. Rodríguez-Páez, J. Non. Cryst. Solids, 459 (2017) 192.
20.X. Q. Meng, L. Q. Li, K. S. Zou, and J, C L, Opt. Mater. (Amst), 37 (2014) 367. 21.M. T. Z. Myint, G. L. Hornyak, and J. Dutta, J. colloid interface Sci., 415 (2014) 32. 22.B. Ramezanzadeh, and M. A. Attar, Surf. Coatings Technol., 205 (2011) 4649. 23.M. Chigane, T. Shinagawa, and J. C. Tani, Thin Solid Films, 628 (2017) 203. 24.B. Beverskog, and I. Puigdomenech, Corros Sci., 39 (1997) 107.
25.R. C. Zeng, F. Zhang, Z. D. Lan, H. Z. Cui, and E. H. Han, Corros. Sci., 88 (2014) 452. 26.S. D. Wang, and S. S. Luo, Appl. Surf. Sci., 258 (2012) 5443.
27.R. Qiu, D. Zhang, and P. Wang, Corros. Sci., 66 (2013) 350.
28.G. Cooperwood, Communication to the Editor, Stud. Intell, 9 (1965) 61.
29.P. J. Lee, C. C. Ho, C. S. Hwang, and S. J. Ding, Surf. Coatings Technol., 258 (2014) 374. 30.G. Kong, J. T. Lu, and H. J. Wu, J. Rare Earths, 27 (2009) 16.
31.T. Liu, Y. S. Yin, S. G. Chen, X. T. Chang, and S. Cheng, Electrochim. Acta, 52 (2007) 3709. 32. X. J. Cui, X. Z. Liu, C. H. Liu, R. S. Yang, X. W. Zheng, and M. Gong, Corros. Sci., 90 (2015)
402
33.S. H. Zhang, G. Kong, J. T. Lu, C. S. Che, and L. Y. Liu, Surf. Coatings Technol., 259 (2014) 654. 34.X. T. Zhang, J. Liang, B. X. Liu, and Z. J. Peng, Colloids Surfaces A Physicochem. Eng. Asp., 454
(2014) 113.
35.M. Ferrari, and A. Benedetti, Adv. Colloid Interface Sci., 222 (2015) 291.