Int. J. Electrochem. Sci., 12 (2017) 11855 – 11874, doi: 10.20964/2017.12.57
International Journal of
ELECTROCHEMICAL
SCIENCE
www.electrochemsci.orgDirect Oxidation of Ethylene Glycol on PtSn/C for Application
in Alkaline Fuel Cell
Letícia L. de Souza1, Almir Oliveira Neto2, Christina A. L. G. de O. Forbicini1,*
1
Centro de Química e Meio Ambiente,
2
Centro de Células a Combustível e Hidrogênio, Instituto de Pesquisas Energéticas e Nucleares, Av. Prof. Lineu Prestes, 2242 - Cidade Universitária - CEP 05508-000 - São Paulo–SP - Brasil
*
E-mail: cforbici@ipen.br
Received: 19 June 2017 / Accepted: 4 September 2017 / Published: 12 November 2017
PtSn/C electrocatalysts with different molar ratios were synthesized by borohidrate process for glycol ethylene oxidation. All electrocatalysts were, also, characterized by X-ray diffraction (XRD), transmission electronic microscopy (TEM), attenuated total reflectance Fourier transform infrared spectroscopy (ATR-FTIRS), energy dispersive X-ray (EDX), while the electrochemical activities of those materials were evaluated by cyclic voltammetry, chronoamperometry and polarization curves in Direct Ethylene Glycol Alkaline Fuel Cells (DEGAFC). TEM results for PtSn/C electrocatalysts showed crystallite size of 4 nm. The curves of power density indicated that PtSn/C, with molar ratio of 70:30, presented the best results for glycol ethylene oxidation, in comparison with other alternatives prepared. These results may be associated to the selectivity to form oxalate or a bifunctional mechanism (oxygenated species from Sn).
Keywords:PtSn/C electrocatalysts, ethylene glycol oxidation, alkaline fuel cell, ATR-FTIRS in situ.
1. INTRODUCTION
Fuel cells are devices that convert the chemical energy of a fuel (hydrogen, methanol, ethanol, ethylene glycol, and others) and an oxidant into electrical energy and heat [1-2]. Among the main types of fuel cells, AFC cells (alkaline fuel cells) have versatile characteristics that make their use feasible not only for stationary generation of electric power but, also, for portable applications and mobile applications [1-3].
kinetically favored in this reaction medium and they may, also, use non-noble materials for making the catalysts [3-7].
In a fuel cell system, supplied with hydrogen, there is great concern and severe requirements of safety measures due to the difficulties of storage and handling of this fuel. An alternative to this problem would be to produce, on-board, the hydrogen to be used in the cell, through the reform of natural gas [8]. Therefore, in the last years, fuel cells that use (DAFCs - Direct Alcohol Fuel Cells) have attracted interest, since they have the non-stocking of hydrogen as a major advantage plus the possibility of generating it through the reform of Alcohol [9]. However, the reform process, in addition to hydrogen, also produces CO, which is adsorbed strongly on the surface of the conventional Pt/C catalyst (platinum nanoparticles anchored in carbon), affecting the performance of the cell severely, even when traces of this contaminant are present [5,10]. Thus, carbon monoxide tolerance is an important factor in the choice of an electrochemical catalyst for anodic hydrogen oxidation in fuel cells fed with reformed gas [5,8].
Some approaches have been employed in the attempt to solve the problem of the electrode contamination by CO. One of these proposals is related to the production of binary catalysts, i.e., the presence of a second metal in addition to Pt, such as Ru, Sn, Mo and Os, forming alloys (substitute, complete or incomplete and/or interstitial solid solution) or co-deposits dispersed in carbon, resulting in a significant increase in CO tolerance [8-11]. It is important to point out that results in the literature are contradictory regarding the use of Pt or Pd for ethylene glycol oxidation, so what is reported in most studies is that the performance of the electrocatalyst is associated with the synthesis method employed, that is, the morphology, activity and particle size are dependent on the synthetic method employed.
Another aspect to be highlighted is that, today, there are different methodologies for the preparation of electrochemical catalysts and different strategies to compare the activities of the diverse prepared materials. These different strategies often prevent the direct comparison of the various results presented in the literature; therefore, studies considering Pt or Pd as electrochemical catalysts are of extreme importance for the advancement of the electrochemical oxidation of ethylene glycol. The use of tin as a co-catalyst has showed to be fundamental for the oxidation of alcohols, in general, since tin can be inserted into the crystalline structure of Pt or Pd, causing an electronic effect on these metals. A second hypothesis is the formation of oxygenated species, since tin has high affinity with oxygen, whose species are essential in the studies of the oxidation of ethylene glycol. Due to the controversies reported in the literature, the preparation of PtSn/ C by sodium borohydride, for the oxidation of ethylene glycol, was chosen.
The mechanisms that have been adopted to explain the higher efficiency of the electrochemical oxidation on binary electrochemical catalysts are the bifunctional mechanism and the electronic effect. According to the bifunctional mechanism, the fuel adsorbs, mainly, in the atoms of Pt, whereas the second metal, less noble and more oxidizable, produces oxygenated species or hydrated oxides that act in the contaminant oxidation. The electronic effect postulates that the presence of the second metal modifies the chemisorption energy of the fuel in the platinum by an electron donation/retroaction mechanism that weakens the Pt-CO bond. [8]
applications are of particular importance, since they represent a major field to be investigated in works involving the generation of energy. In this work, the following analyses were carried out: Transmission Electronic Microscopy (TEM), X-ray Difraction (XRD), Infrared (FTIR) and X-ray Dispersive Energy (XDE) for the characterization of electrochemical catalysts, while Cyclic Voltammetry (CV), Chronoamperometry (CA) and fuel cell tests were used to evaluate the electrocatalytic activities of the binary catalysts in the electrochemical oxidation reactions of ethylene glycol (EG), in basic medium. It is important to mention that the Infrared (FTIR) technique allows the activity of the different prepared materials to be correlated with the production paths in the oxidation reaction of EG, helping, consequently, in the determination of the reaction route, besides evaluating whether this occurs complete or incompletely.
1.1. Fuel Elements
Fuels to be considered efficient should have a high conversion rate to CO2 and low formation
of intermediates, such as CO that causes platinum poisoning with consequent loss of catalytic activity. Methanol, although widely studied for direct oxidation fuel cell (DAFC - Direct Alcohol Fuel Cell) has some disadvantages, such as being highly toxic and flammable, having a low boiling point (65 °C) and a high crossover rate. Crossover represents one of the major problems in the use of methanol, once methanol + water mixture crosses the polymer membrane, causing a significant loss of cathode activity. However, due to its low molecular complexity, in addition to presenting the best results with the use of PtRu/C electrochemical catalysts and other electrochemical catalysts, the oxidation reaction of methanol has been the object of study by several authors. [12-16]
Ethanol, although interesting for Brazil as a renewable source with facility for supply, presents, as one of its greatest difficulties, the breakage of the C-C bond during the oxidation process, leading to the formation of intermediate products (CO, acetaldehyde and acetic acid), which are strongly adsorbed onto the polycrystalline platinum, causing loss of the catalytic activity. Studies using electrochemical mass spectrometry (DEMS), electrochemical thermal desorption mass spectroscopy (ECTDMS) and Fourier transformed infrared spectroscopy (FTIRS) are performed in an attempt to uncover the intermediates adsorbed in the electrocatalyst, during the reaction of ethanol oxidation. [17-19]
Recently, Miyazaki et al [20] reported that ethylene glycol (C2H6O2) presents high conversion
to CO2 and is, therefore, an interesting alternative for use in AFC.[7,20].
Ethylene glycol in alkaline medium generates, as intermediates, oxalates, glyoxalate, glycollate, glycolaldehyde, glyoxal and carbon dioxide and it is considered an energy carrier for fuel cells. The importance of this fuel is attributed to several factors: low molecular weight, biomass origin, high energy density, high boiling point (198 °C) and lower toxicity than methanol [20, 21]. The energy density of ethylene glycol is about 5.2 kWh.kg-1, value that is near the energy densities of methanol, 6.1 kWh kg-1 and ethanol, 8.6 kWh kg-1.
and free energy (ΔG ° c) are close, but, the standard potential is much smaller, approaching methanol standard potential. These characteristics of ethylene glycol make it belong to the category of alcohols applicable to direct oxidation fuel cell.
Table 1. Values of enthalpy and free energy standards for the combustion reaction of alcohols and standard electrode potential. [21]
Alcohols ΔH°c
(kJ mol-1)
ΔG°c (kJ mol-1)
E° (mV)
Methanol (CH3OH) -725.65 -701.69 18
Ethanol (CH3CH2OH)
-1364.5 -1324.09 90
Ethylene glycol (HOCH2CH2OH)
-1188.5 -1175.9 10
1.2. Electrochemical oxidation mechanism of ethylene glycol (EG)
According to An & Chen [22], alkaline direct ethylene glycol fuel cells (DEGFC) are the most promising for use in portable equipment, cell phones and stationary sources because it uses a sustainable fuel. Studies on Pt, Pd and Au catalysts with different cocatalysts including innovative fuel cell systems operating with ethylene glycol are showed and they considered that the major challenges to be overcome for their implementation would be: 1) to achieve the direct oxidation of 10-electron oxidation of ethylene glycol to CO2, 2) to improve the design of the electrodes, 3) to study the effects
of liquid fuel on the membrane as a function of the operating time.
In the study of EG oxidation, the greatest difficulty is the C-C bond breakage for total alcohol oxidation at CO2 and maximum reach of energy efficiency. In direct oxidation, 10 electrons (e-) per
molecule are released, according to the reaction below (Eq.1):
(1)
However, the oxidation of EG may occur by parallel pathways, producing other products: glycolaldehyde, glyoxal, glycolic acid, glyoxylic acid and oxalic acid.
[image:4.596.93.504.194.322.2]
the products formed in the different potentials studied, besides confirming the activity of these materials under real operating conditions.
It is worth pointing out that the purpose of this work was to evaluate the electrocatalytic activities of the PtSn/C binary catalysts in the electrochemical oxidation reactions of EG, in basic medium, to propose a possible route for the oxidation of the EG, besides presenting studies carried out under real operating conditions, namely, experiments in a fuel cell fed directly by ethylene glycol. The importance of this study may be measured by the variety of results presented, such as conventional electrochemical, fuel cell and infrared studies. Several works mentioned in the literature often present, only, conventional electrochemical aspects, which usually do not correspond to the actual operating conditions.
Another important factor is the presence of infrared studies that indicate a probable mechanism for the oxidation of ethylene glycol, which, if not performed, would limit the discussion to the existing works in the literature, that is, the occurrence or not of the bifunctional mechanism and electronic effect.
2. EXPERIMENTAL PART
Pt and Sn-based electrochemical catalysts, carbon-supported, were prepared by the borohydride reduction method, which has proven to be effective in the production of nanoparticles [7, 23] with a nominal metal loading of 20%. Chloroplatinic hexahydrate acid (H2PtCl6.6H2O-Aldrich), tin chloride
dihydrate SnCl2.2H2O-Aldrich), as a source of metals, 2-propanol alcohol (Merck), as solvent, sodium
borohydride (NaBH4-Aldrich), as reducing agent, potassium hydroxide (KOH-Merck), as stabilizing
agent to avoid degradation of borohydride sodium and Vulcan® XC72 (Cabot) black carbon as support.
In a solution of 2-propanol/water with volumetric ratio equal to 50/50 (v/v), under stirring, metal precursors and carbon support were added. Then, 10 mL of 0.01 mol L-1 KOH solution and NaBH4 (molar ratio 5:1) were added, maintaining the stirring for 20 minutes. The obtained
electrochemical catalyst was vacuum filtered, washed with water and dried at 70 °C, for 2 h. The electrochemical catalysts were prepared in different atomic proportions, namely: Pt/C (100), Sn/C (100) and PtSn/C (90:10, 70:30 and 50:50).
The materials produced were physically characterized by X-ray diffraction (XRD), transmission electronic microscopy (TEM) and X-ray dispersive energy (EDX).
The XRD diffractograms were obtained with a Rigaku diffractometer Miniflex II model, at a scan speed of 2° min-1 and with a 2θ interval between 20° and 90°. The wavelength of the incident radiation was 1.54056 Å, which corresponds to the CuKα band. The materials prepared were also characterized by transmission electron microscopy, using a JEOL JEM-2100 electron microscope, operated at 200 kV, where the distribution and the size of the nanoparticles in the support were determined. In this work, the histogram with nanoparticles sizes was built by 120 particles measurements, from a 10 micrographs..
microscope, JSM-6010LA model. The data obtained allowed the chemical composition of the catalyst to be analyzed.
Cyclic voltammetry (CV) experiments were performed using a three-electrode cell: the electrochemical catalyst as a working electrode, an Ag/AgCl reference electrode and a platinum plate, as a counter electrode. These experiments were performed in a potentiostat/galvanostat PGSTAT 30, from AUTOLAB, coupled to a computer. 1.0 mol L-1KOH was used as support electrolyte. The studies were conducted in the potential range of -0.85 V to 0.1 V (vs. Ag/AgCl), with a scan rate of 10 mV s-1. The experiments were performed, firstly, in the absence of alcohol and, then, in the presence of alcohol, at the concentrationof 1.0 mol L-1 of EG, in saturated solution with N2, at room
temperature.
The electrochemical activity experiments were performed using the same chronoamperometry (AC) technique, at room temperature, in a 1.0 mol L-1 KOH solution, containing 1.0 mol L-1 EG and saturated with N2. These studies were carried out by applying a potential of -0.35 V (vs. Ag/AgCl), for
30 minutes.
For the identification of the products formed during the EG electrochemical oxidation on the various electrochemical catalysts prepared, infrared spectroscopy technique (FTIRS) was used, together with transformed Fourier in situ (FTIRS). [7, 23]
ATR-FTIRS measurements of the species resulting from EG oxidation were obtained using a Nicolet 6700 FT-IR spectrometer, equipped with a MCT (mercury and cadmium telluride) linear wideband detector and attenuated reflectance accessory (ATR PIKE MIRACLE), at room temperature, in basic medium of 1.0 mol L-1 KOH and in the presence of 1 mol L-1 EG. In the ATR accessory, the electrochemical cell of three electrodes was coupled, as already described previously. The working electrodes (geometric area of 0.3 cm2, with a depth of 0.3 mm) were prepared using the porous thin-film coating technique, [7] where a solution is prepared with 20 mg of catalyst and 100 μL of PTFE solution, in 50 mL of water, dispersed in an ultrasonic bath, for 5 minutes. Thereafter, the suspension was filtered and the resulting slurry is deposited on the working electrode.
The spectral absorbances were collected with the R/R0 ratio, where R represents the spectrum
at a given potential and R0, the spectrum collected at -0.85V (vs. Ag/AgCl). The spectra were collected
every 100 mV, from -0.85 V (vs. Ag/AgCl), with 96 interferograms per spectrum, between 3000 cm -1 and 850 cm -1, with a resolution of 8 cm-1. Initially, a reference spectrum (R0) was performed at - 0.85
V (vs. Ag/AgCl) and the sample spectra were obtained after successive potentials of -0.75 to 0.05 V (vs Ag/AgCl).
For the study in unitary fuel cell fed directly with EG 2.0 mol L-1 and KOH 2,0 mol L-1, Nafion® 117 (DuPontTM) membrane was used as electrolyte, after treaded to be used in basic medium. [7,11]
The chemical treatment of Nafion® membranes for application in alkaline unit fuel cell consists of cutting the membranes into the dimensions of 10 cm x 10 cm and inserting them in deionized water, at a temperature of 80 ºC and, then, treating them with solutions of H2O2 (3%) and
H2SO4 (1 mol L-1), at 80 °C, for removal of any organic and mineral residues. After removal of
in H2O2 and KOH was of 1 and 19 h, respectively, and at the end, the membranes were washed with
deionized water, three more times [7].
The gas diffusion layer (GDL) used to make all MEAs, was carbon fabric (EC-CC1-060T), which is treated with PTFE (35%), supplied by ElectroChem Inc. The catalytic layer of the anode was prepared using the Pt/C ETEK commercial catalyzer (20% Pt mass, lot: (C0740621) with
and 30% Nafion®, while for the anode catalytic layer preparation, from the electrochemical catalysts, Pt/C and PtSn/C and 30% Nafion® (5% DE520 dispersion, from DuPontTM) were used.
The electrode-membrane-electrode assembly (MEA) was prepared by the brush painting technique. [7,23] The two electrodes are pressed together with Nafion® membrane, at 125 °C and 1000 kgf cm -2, for 2 min. The MEA was packaged between graphite plates, which allow electrical contact and uniform distribution of the flow of oxygen gas that feeds the cell.
The performance of the fuel cell is evaluated by studying its polarization curve, which relates the cell potential to the current density. The polarization curves in steady-state, in unitary FC, were obtained galvanostatically, by maintaining the cell at 100 °C and using oxygen saturated with ultrapure water (˃ 18 M, Milli-Q) at 100 ° C.
2.1. Preparation of MEA
The MEAs were prepared by means of the brush painting process. In this method, the anodic and cathodic catalytic layers were prepared using the electrochemical catalyst to be studied by mixing a solution of Nafion® and isopropyl alcohol. After ultrasonic stirring, the mixture is applied to a carbon tissue and dried at room temperature. Then, for the MEA formation, the two prepared electrodes are pressed together with Nafion® membrane, at 125 °C, at a pressure of 225 kgf cm-2. The MEA area is 5 cm2.
3. RESULTS AND DISCUSSION
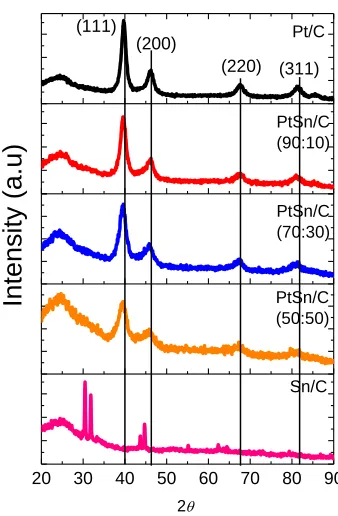
In Fig. 1, X-ray diffraction patterns for the Pt/C, PtSn/C and Sn/C electrochemical catalysts are shown. From the diffractograms, it may be seen that all materials showed a peak at, approximately, 2θ = 25° , associated with the carbon support. The Pt/C and PtSn/C electrochemical catalysts present four diffraction peaks at, approximately, 2θ = 40°, 47°, 68° and 82°, associated, respectively, with the planes (111), (200), (220), (311) and (311) of the platinum face centered cubic structure of platinum and its alloys [23,24].
the specific conditions for this work. For a better understanding, it would be necessary studies at lower scan rates, as a deconvolution of the crystalline planes obtained by XRD, which did not comprise the scope of this work.
20 30 40 50 60 70 80 90
2
Sn/C (311) (220) (200)
PtSn/C (50:50)
In
te
nsity (
a.
u)
(111)
PtSn/C (70:30) PtSn/C (90:10) Pt/C
Figure 1. Diffractograms of Pt/C, PtSn/C and Sn/C electrochemical catalysts.
[image:8.596.209.378.143.401.2]The electrochemical catalysts were characterized by EDX to obtain their molar ratios and to certify their composition. In Table 2, the results of the average crystallite size, the network parameters obtained by the XRD diffractograms and the composition of the molar catalysts obtained by EDX are shown. For all electrochemical catalysts Pt and Sn base- synthesized, on carbon substrate, the values of the molar ratios obtained by EDX were close to the nominal values, confirming that the borohydride method is efficient for the production of the proposed catalysts.
Table 2. Mean crystallite size, nominal composition and by EDX, for electrochemical Pt and Sn-based catalysts, on carbon substrate.
Material Crystallite mean size (nm)
Nominal Composition
Pt:Sn (molar)
EDX Composition Pt:Sn (molar)
Pt/C 5 0:100 ---
PtSn/C (90:10) 4 90:10 86:14
PtSn/C (70:30) 4 70:30 69:31
PtSn/C (50:50) 4 50:50 51:49
[image:8.596.65.532.620.750.2]
TEM images were carried out to evaluate the distribution and mean size of Pt/C, PtSn/C (90:10), PtSn/C (70:30), PtSn/C (50:50) and Sn/C catalysts particles. In Pt/C catalyst, the platinum nanoparticles dispersed in the carbon support exhibited an average particle size of 5 nm (Fig. 2a), while for the Sn/C electrochemical catalyst, numerous clusters were observed, which are characteristic of Sn (Fig. 2b).
(a)
0 2 4 6 8 10 12
0 10 20 30 40 50 60 70 80
Fr
equ
enc
y
(%)
Particle Size (nm)
Pt/C d
Medium = 5 nm
b)
[image:9.596.145.449.176.463.2]
Figure 2. Micrographs obtained by transmission electronic microscopy and particle size distribution of the electrochemical catalysts prepared by borohydride method: (a) Pt/C, (b) Sn/C.
TEM images for PtSn/C (90:10), PtSn/C (70:30) and PtSn/C (50:50) electrochemical catalysts exhibited a mean particle size of 4 nm (Fig. 3), indicating that the increase of tin amount in the composition of the electrochemical catalyst does not lead to an increase in the particle average size, according to the literature [7]. The average size particle plays an important role in the oxidation reactions of EG fuel, i.e. its decrease leads to an increase in the number of defects in the catalyst crystalline structure and, consequently, a higher power density.
a)
0 2 4 6 8 10 12 0
10 20 30 40 50 60 70 80
Frequ
en
cy (%)
Particle size (nm) PtSn/C- 90:10
dMedium = 5nm
b)
2,0 2,5 3,0 3,5 4,0 4,5 5,0 0
5 10 15 20 25 30 35
Frequ
en
cy (%)
Particle Size (nm)
PtSn/C - 70:30 dMedium= 4 nm
c)
0 2 4 6 8 10 12 0
2 4 6 8 10 12 14 16 18 20
Frequ
en
cy (%)
Particle Size (nm) PtSn- 5050
dMedium = 4nm
Figure 3. Micrographs obtained by TEM and distribution of particle sizes in the eletrochemical catalysts prepared by borohydrate method: a) PtSn/C (90:10), b) PtSn/C (70:30) and c)PtSn/C (50:50)
The cyclic voltammograms of Pt/C, PtSn/C (90:10), PtSn/C (70:30) and PtSn/C (50:50) electrochemical catalysts prepared by the borohydride method, in the absence of alcohol, are shown in Fig. 4. The choice of these three proportions of PtSn for the binary electrochemical catalysts was made to study how each composition behaves in relation to the oxidation of EG (Fig. 5) and which of them presents the best result.
[image:10.596.115.483.77.571.2]
voltammetric curves in alkaline medium were obtained in the presence of KOH electrolyte, 1.0 mol. L
-1
and recorded in the range of -0.85 V to 0.2 V vs. Ag / AgCl (E = -0.9 V vs. ERH).
In the cyclic voltammograms, corresponding to the electrochemical catalysts in alkaline medium, there are three anodic regions. The peaks in region I correspond to the adsorption and desorption of hydrogen, called hydrogen region. In region I, it is observed that the peaks for PtSn/C catalysts were suppressed in relation to Pt/C. This indicates that the strong H2 adsorption on the
catalyst surface has been weakened, that is, this behavior may be related to the fact that tin atoms cover the platinum sites, preventing the adsorption of hydrogen. This type of behavior is commonly observed, in the literature, for platinum combined with a second metal, such as Sn, Rh or Au [28-30]. For PtSn/C catalysts, the voltammetric peaks in the region of -0.8 to -0.5 V (vs. Ag/AgCl) are caused by the sum of hydrogen adsorption processes.
Region II of VC corresponds to the region of the double electric layer (region that presents only capacitive current). In this region, superficial oxidation processes of the electrode related to the adsorption of species OH- formed by the oxidation of the water occur. In region III (more positive potentials), the formation of metallic oxides (hydrated) occurs.
In the cyclic voltammograms of PtSn/C (90:10) and PtSn/C (70:30) electrochemical catalysts (70:30), an increase in the current peak of oxide reduction was, also, observed when considering the negative scan, compared to Pt/C catalyst. This behavior is associated to the following factors: the electronic effect, bifunctional mechanism and the presence of Sn, i.e., for these binary catalysts there is the formation of a greater amount of oxygenated species, what could facilitate EG electrochemical oxidation, in basic medium.
[image:11.596.102.492.452.734.2]
From the voltammetric profiles, it is observed that the PtSn/C catalysts present oxidation peaks for values smaller than the potential for Pt/C oxidation. Therefore, the formation of oxides for PtSn/C catalysts will occur at smaller potentials. Hence, the intermediates will be oxidized in smaller potentials related to Pt/C catalyst.
By means of these results it is possible to observe, for the PtSn/C catalyst (70:30), a peak in the region of the electric double layer (region II), related to the adsorption of OH species. This means that the adsorption of OH- species occurred on the surface of PtSn/C (70:30), and, thus, the production of oxides may favor the oxidation process of intermediates resulting from EG oxidation.
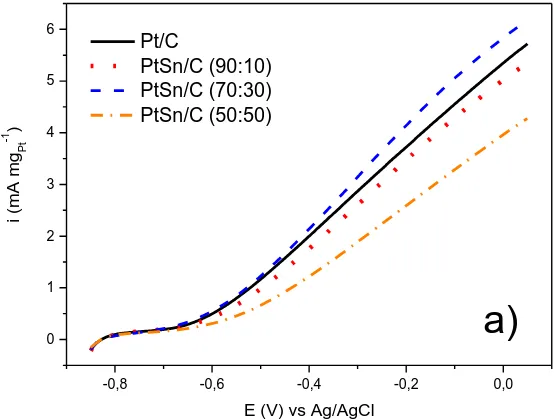
Fig. 5a shows the linear scanning voltammetry curve of Pt/C and PtSn/C electrochemical catalysts, in a solution of EG 1.0 mol L-1 with 1.0 mol L-1 KOH saturated with N2, at a scanning speed
of 10 mV s-1. With this experiment, it is possible to verify that the potentials of the ethylene glycol oxidation reaction are very close to -0.68 V (vs. Ag / AgCl), except for PtSn/C (50:50), which shifted to -0.70 V (vs Ag/AgCl), showing to be more positive than the other materials and, consequently, less active. Among all the materials studied by cyclic voltammetry, PtSn/C (70:30) electrochemical catalyst was the most active in the entire potential range, indicating that it is a promising candidate for fuel cell tests fed, directly, by ethylene glycol.
The stability of PtSn/C materials was evaluated by chronoamperometry (Fig. 5b). The chronoamperometry curves of PtSn/C and Pt/C electrochemical catalysts were performed in 1 mol L-1 ethylene glycol in 1 mol L -1 KOH, at a fixed potential of -0.35 V (vs. Ag/AgCl). In the first seconds, the electrochemical catalysts showed great decreases and, after 3 minutes, all the materials reached a stable current until the end of the 30 minute-experiment.
Along this timeframe, the current density measurements were 1.46 for Pt/C, 1.72 for PtSn /C (90:10), 1.92 for PtSn/ C (70:30) and 1.30 for PtSn/C (50:50). The studies with chronoamperometry technique confirmed that PtSn/C (70:30) electrochemical catalyst was more active for EG oxidation, that is to say, it remains active when subjected to longer operating times, at a given potential.
-0,8 -0,6 -0,4 -0,2 0,0
0 1 2 3 4 5 6
i (mA
mg
Pt
-1 )
E (V) vs Ag/AgCl Pt/C
PtSn/C (90:10) PtSn/C (70:30) PtSn/C (50:50)
[image:12.596.150.427.540.750.2]
0 5 10 15 20 25 30
1,0 1,2 1,4 1,6 1,8 2,0 2,2 2,4 2,6 2,8 3,0
j (mA)
t (min)
Pt/C
PtSn/C (90:10) PtSn/C (70:30) PtSn/C (50:50)
b)
Figure 5. a) Cyclic voltammograms for Pt/C and PtSn/C electrochemical catalysts in 1 mol L -1 EG and 1 mol L-1 KOH solution, with a scanning speed of 10 mV s-1, b) Chronoamperometry curves in 1.0 mol.L-1 of ethylene glycol in solution of 1.0 mol L-1 KOH for the electrochemical catalysts PtSn/C, in different compositions prepared by the borohydride method, at the potential of -0. 35 V (vs. Ag/AgCl), at 25 ° C.
The best electrochemical performance of PtSn/C (70:30) could result from the synergistic effect, which facilitates the oxidation of alcohol by means of oxygen-containing species adsorbed on Sn [7,26] atoms, but, the bifunctional mechanism cannot be discarded. PtSn/C (50:50) showed less activity than the other catalysts, probably because it is related to an optimum 30% tin composition, in the composition of binary electrochemical catalysts.
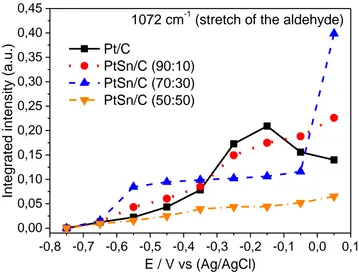
In situ FTIR spectra (Fig. 6) were obtained in order to correlate the electrochemical oxidation activity of EG with the main formation paths FTIR spectra in the region between 3000 to 850 cm-1 were registered during the electrochemical oxidation of the ethylene glycol for Pt/C and PtSn C electrochemical catalysts, in a solution of 1 mol.L-1 of EG and 1 mol L- 1 of KOH. Considering the resulting FTIR, it was possible to observe the appearance of bands related to the formation of CO2, at
2343 cm-1, in 1072 cm-1, the stretching of aldehydes (glyoxal, glycollate, glyceraldehyde), in 1240 cm
-1
, the CO of glycolate and the band in at 1320 cm-1 , attributed to glycerate and oxalate.
Alterations in specific species concentrations produced during EG oxidation (increase or decrease) were analyzed by linear Lorentzian functions [31]. Hence, the intensity and width of the line of each band could be analyzed individually, as shown in the graph of the integrated intensity of the aldehyde stretching bands (glyoxal, glycollate, glyceraldehyde) [32,33], oxalate stretch [32,34], glycerate and oxalate [32,34].
[image:13.596.151.433.95.305.2]
overpotentials.
3000 2700 2400 2100 1800 1500 1200 900
E (mV) v
s Ag /Ag Cl Absorb an c e (a. u. )
Wave Number (cm-1) R/R0 = 1x10⁻²
Pt/C -750 -650 -550 -450 -350 -250 -150 -50 50 1072 1240 1320 2343
3000 2700 2400 2100 1800 1500 1200 900
E / m V vs (Ag /Ag Cl) Absorb an c e (a. u. )
Wave Number (cm-1) R/R0 = 2x10⁻²
PtSn/C (90:10) -750 -650 -550 -450 -350 -250 -150 -50 50 1072 1240 1320 2343
3000 2700 2400 2100 1800 1500 1200 900
E (mV) v
s Ag /Ag Cl Absorb an c e (a. u. )
Wave Number (cm-1)
R/R
0 = 2 x 10
-2 PtSn/C (70:30) -750 -650 -550 -450 -350 -250 -150 -50 50 1072 1240 1320 2343
3000 2700 2400 2100 1800 1500 1200 900
E (mV) v
s Ag /Ag Cl Absorb an c e(a .u .)
Wave Number (cm-1)
R/R0 = 1x10⁻²
-750 -650 -550 -450 -350 -250 -150 -50 50 PtSn/C (50:50) 1072 1240 1320 2343
-0,8 -0,7 -0,6 -0,5 -0,4 -0,3 -0,2 -0,1 0,0 0,1 0,00
0,05 0,10 0,15 0,20 0,25 0,30 0,35 0,40 0,45
In
te
gra
te
d
in
te
nsity (a.u
.)
E / V vs (Ag/AgCl)
Pt/C
PtSn/C (90:10)
PtSn/C (70:30)
PtSn/C (50:50)
1072 cm
-1(stretch of the aldehyde)
Figure 7. Integrated intensity of the aldehyde bands (1072 cm-1) as a function of the potential for Pt/C, PtSn/C electrochemical catalysts. The ‘backgrounds’ were collected at -0.85 V (vs. Ag/AgCl), at a scanning speed of 1 mV s-1.
-0,8 -0,7 -0,6 -0,5 -0,4 -0,3 -0,2 -0,1 0,0 0,1
0,00 0,02 0,04 0,06 0,08 0,10
In
te
gra
te
d
in
te
nsity (a.u
.)
E/V vs (Ag/AgCl)
Pt/C
PtSn/C (90:10) PtSn/C (70:30) PtSn/C (50:50)
1320 cm-1 (oxalate and glycollate)
[image:15.596.106.465.98.375.2]
-0,8 -0,7 -0,6 -0,5 -0,4 -0,3 -0,2 -0,1 0,0 0,1
0,0 0,1 0,2 0,3 0,4 0,5
In
te
gra
te
d
in
te
nsity (a.
u.
)
E (V) vs Ag/AgCl Pt/C
PtSn/C (90:10) PtSn/C (70:30) PtSn/C (50:50)
1240 cm-1 (O-H stretch of oxalate)
b)
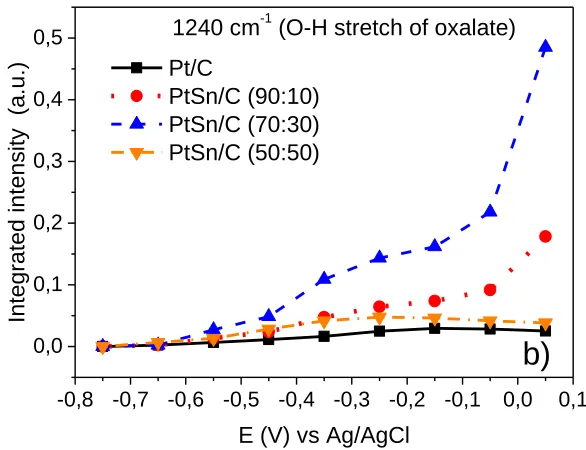
Figure 8. Integral intensity of the bands, as a function of the potential for Pt/C and PtSn/C electrochemical catalysts, a) oxalate and glycollate, b) O-H stretch of oxalate.
Some authors suggest that glycerate and oxalate are the main oxidation products of EG on Pt-based electrochemical catalysts [34,35] and, for these products, the band is attributed at 1320 cm -1 [32,34] (Fig. 8a). It is observed that, with the decrease of the Pt amount in the catalysts, the appearance of carboxylic groups in the production potential is shifted to more positive potentials, and its intensity decreases. However, it is noticed, in the 1240 cm-1 band (Fig. 8b), that the most oxidized product, without a break of C-C bond, corresponds to the oxalate O-H stretch; for PtSn/C catalyst (70:30) it is observed that the integrated intensity band is higher than other electrochemical catalysts. This may be a possible explanation for a higher electrochemical activity; however, this result is, also, an indication that the EG oxidation reaction in PtSn electrochemical catalysts is processed incompletely.
According to the results, EG oxidation occurs by indirect mechanism and, according to De Lima et al. [34], the dissociative adsorption of EG produces adsorbed carbon monoxide and this intermediate is oxidized by CO2.
In this work, CO2 production occurred only at more positive potentials, -0.05V (Fig. 9) and a
lack of carbonate signal (1,400 cm -1) [20] was observed. This fact may indicate that the main oxidation products of ethylene glycol on PtSn/C are glycollate and oxalate [20,34] certifying, somehow, that this reaction occurs incompletely, without the total use of the number of electrons. Carbonate formation is associated with the presence of CO2 from the environment or generation of
CO2 as a product from ethylene glycol oxidation. Considering that the presence of CO2 in the
environment was not observed, since there is formation of CO2 only at high potentials, it is expected
that carbonate formation will not occur in the experiments resulting from this work.
In another study for alcohol oxidation in acid media, Silva et al. [36] reported that SnO2
[image:16.596.143.436.97.322.2]
-0,8 -0,7 -0,6 -0,5 -0,4 -0,3 -0,2 -0,1 0,0 0,1 0,00
0,01 0,02 0,03 0,04 0,05 0,06 0,07
In
te
gra
te
d
in
te
nsity (a.u
.)
E/V vs Ag/AgCl Pt/C
PtSn/C (90:10) PtSn/C (70:30) PtSn/C (50:50)
2343 cm-1 (CO2)
Figure 9. Integral intensity of the CO2 bands (2343 cm-1), as a function of the potential for Pt/C and
PtSn/C electrochemical catalysts.
-10 0 10 20 30 40 50 60 70 80 0,0
0,2 0,4 0,6 0,8 1,0
1,2 Pt/C PtSn/C 90:10
PtSn/C 70:30 PtSn/C 50:50
Current Density (mA.cm-2)
Cell
Volt
ag
e
(V)
-2 0 2 4 6 8 10 12 14 16
Power
Den
sity (mW.cm
-2
)
[image:17.596.121.449.101.352.2] [image:17.596.123.482.431.695.2]
Fig. 10 shows the performances of Pt/C, PtSn/C electrochemical catalysts in unitary alkaline fuel cell fed, directly, by EG. It is observed that the OCV (Open Circuit Voltage) for catalysts containing Sn is higher than that for Pt/C electrochemical catalyst, a result that is in agreement with what is observed in cyclic voltammetry experiments. The power density curves indicate that the electrochemical catalysts containing Sn are more active for EG oxidation reaction, especially PtSn/C - 70:30 (14.5 mW cm-2) composition, with a higher power measure than Pt/C (≈ 10 mW cm-2), what represents an optimal binary composition for EG oxidation. This activity is related to the performance of the bifunctional mechanism, i.e, oxygenated species derived from tin or electrolytic solution help in the oxidation of strongly adsorbed intermediates.
In Fig. 10, several curves of potential variation are shown, with the current density of AFC-type cells. Two slopes in the polarization curve are observed, representing the processes that occur in a fuel cell: the first slope corresponds to the activation region and the second slope refers to the region of ohmic fall and mass transport. Nevertheless, it was observed that the use of a PtSn/C binary catalyst enhances, significantly, the catalytic activity, recognized in the cell potential raising. The addition of Sn also reduces, significantly, the catalyst poisoning.
4. CONCLUSIONS
The borohydride reduction method was effective in the production of binary electrochemical catalysts for the oxidation of ethylene glycol in alkaline media, where EDX results showed that the values of molar ratios are similar to starting nominal values.
The results obtained from the X-ray diffractograms showed a cubic face-centered structure, typical of platinum, for all prepared electrocatalysts. However, for PtSn/C, the formation of metallic alloys was not observed between Pt and Sn.
The results obtained with the ATR-FTIR spectroscopy technique showed that EG oxidation occurs by the indirect mechanism, i.e., there is not a total profit in the use of all electrons present and, consequently, there is the formation of oxalate and glycollate as main products.
The power density curves indicate that the electrochemical catalysts containing Sn are more active for EG oxidation reaction, especially PtSn/C 70:30 composition (14.5 mW cm-2), which reached values higher than those of Pt/C (≈ 10 mW cm-2
). This activity may be attributed to the occurrence of the bifunctional mechanism and the synergistic effects between platinum and tin.
ACKNOWLEDGEMENTS
To Nuclear and Energy Research Institute (IPEN-CNEN/SP), where the present work was carried out. To Coordination for the Improvement of Higher Level -or Education- Personnel (CAPES), for the financial support.
References
1. P. P. Lopes and E. A. Ticianelli, Quím. Nova, 30 (2007) 1256.
Paulo, Brazil.
3. H. Wendt; M. Linardi and E. M. Aricó, Quím. Nova, 25 (2002) 470. 4. E. R. Gonzalez, Quím. Nova, 23 (2000) 262.
5. B. C. H. Steele and A. Heinzel, Nature, 414 (2001)345. 6. L. Shlapback and A. Zuttel, Nature, 414 (2001) 353.
7. R. M. Piasentin, Estudo da eletro-oxidação do etanol utilizando eletrocatalisadores PtPd/C+ATO e PtPdSn/C+ATO preparados via redução por borohidreto de sódio, Doctoral Thesis, (2013)
University of São Paulo, Brazil.
8. L. G. S. Pereira, M. E. Pereira and E. A. Ticianelli, Quím. Nova, 30 (2007) 1644. 9. E. A. Ticianelli, G. A. Camara and L. G. R. A. Santos, Quím. Nova, 28 (2005) 664. 10. M. S. Wilson and S. J. Gotterfeld, Appl. Electrochem., 139 (1992) 28.
11. A. Esmaeilifar, S. Rowshanzamir, M. H. Eikani and E. Ghazanfari, Electrochim. Acta, 56 (2010) 271.
12. T. Iwasita, Electrochim. Acta, 47 (2002) 3663.
13. E. A. Batista, G. R. P. Malpass, A. J. Motheo and T. Iwasita, J. Electroanal. Chem., 571 (2004) 273.
14. G. A. Planes, G. Garcia and E. Pastor, Electrochem. Commun., 9 (2007) 839. 15. J. Prabhuram and R. Manoharan, J. Power Sources, 74 (1998) 54.
16. A. V. Tripkovic, K. D. Popovic, B. N. Grgur, B. Blizanac, P. N. Ross and N. M. Markovic, Electrochim. Acta, 47 (2002) 3707.
17. J. Barroso, A. R. Pierna; T. C. Blanco, E. Morallon and F. Huerta, J. Power Sources, 196 (2011) 4193.
18. H. Pramanik and S. Basu, Chem. Eng. Proc., 49 (2010) 635.. 19. L. An. and T. S. Zhao, Int. J. Hydrogen Energy, 36 (2011) 9994.
20. K. Miyazaki, T. Matsumiya, T. Abe, H. Kurata, T. Fukutsuka, K. Kojima and Z. Ogumi, Electrochim. Acta, 56 (2011) 7610.
21. R. B. Lima, Estudo da eletrooxidação do etileno glicol e de seus produtos de oxidação parcial em eletrodos de Pt e PtRu, Doctoral Thesis, (2006) São Carlos Chemistry Institute, University of São Paulo, Brazil.
22. L. An and R. Chen, J. Power Sources, 329 (2016) 484.
23. M. Brandalise, Preparação e caracterização de eletrocatalisadores PtRu/C, PtBi/C, PtRuBi/C para eletro-oxidação direta de etanol em células a combustível tipo PEM utilizando a metodologia da redução via borohidreto de sódio. Masters Dissertation, (2010) University of São Paulo, Brazil. 24. R. M. Antoniassi, Desempenho elétrico e distribuição dos produtos da célula a combustível com
etanol direto utilizando Pt/C, PtSn/C (liga) e PtSnO2/C como eletrocatalisadores anódicos. Masters
Dissertation, (2013) University of São Paulo, Brazil.
25. J. M. Sieben and M. M. E. Duarte, Int J. Hydrogen Energy,.36 (2011) 3313.
26. H. A. R. Ferreira, Catalisadores binários e ternários à base de Pt, Sn e Mo para aplicações em células a combustível, Doctoral Thesis, (2010) Federal University of Paraíba, Brazil.
27. D. R. M. Godoi, J. Perez. and H. M. Villullas, J. Power Sources, 195 (2010) 3394.
28. J. C. M. Silva, S. G. da Silva, R. F. B. de Souza, G. S. Buzzo, E. V. Spinacé, A. Oliveira Neto and M. H. M. T. Assumpção, Appl. Catal., 490 (2014) 33.
29. A. Oliveira Neto, J. Nandenha, M. H. M. T. Assumpção,M. Linardi, E. V. Spinacé and R. F. B. de Souza, Int. J. Hydrogen Energy, 38 (2013) 10585.
30. A. Falase, M. Main, K. Garcia, A. Serov, C. Lau and P. Atanassov, Electrochim. Acta, 66 (2012) 295.
31. L. Xin, Z. Zhang, J. Qi; D. Chadderdon and W. Li, Appl. Catal., 125 (2012) 85.
35. P. A. Christensen and A. Hammet, J. Electroanal. Chem., 260 (1989) 347.
36. J.C.M. Silva, L.S. Pereira, R.F.B. de Souza, M.L. Calegaro, E.V. Spinacé, A. Oliveira Neto and M.C. Santos, Appl. Catal., 110 (2011) 141.