BLUEPRINT SERIES 26
AN ANATOMY OF
INCLUSIVE GROWTH
IN EUROPE
Zsolt Darvas and Guntram B. Wolff Editor: Stephen Gardner
© Bruegel 2016 All rights reserved. Short sections of text, not to exceed two paragraphs, may be quoted in the original language without explicit permission provided that the source is acknowledged. Opinions expressed in this publications are those of the author alone.
Bruegel
Acknowledgements
With the support of Uuriintuya Batsaikhan, Pia Hüttl and Jaume Martí Romero.
Contents
Acknowledgements III
About the authors VI
Foreword VII
Executive summary 1
1. Introduction 9
2. Inclusive growth: why it matters 13
2.2 Inequality and growth 14
2.3 Social mobility 18
2.4 Impact on politics: Brexit vote boosts case for inclusive growth 21
3. Labour markets, inequality and technology 23
3.1 Income inequality: Europe is different 23
3.2 Long-term structural changes to labour markets: the EU and US
are similar 28
3.3 Technological change and the skill premium 32
3.4 Technological change and the risk of ‘robotisation’ 41
3.5 Wage share and globalization 45
4. Prospects for social mobility in Europe 46
4.1 Poverty 46
4.2 Education 51
4.3 Health 54
5. National and European Union policies for fostering inclusive growth 67
Annex 1: Econometric analysis of the June 2016 Brexit vote (derived
from Darvas, 2016a) 80
Annex 2: Further indicators of income and wealth inequality 93
References 98
About the authors
Zsolt Darvas is a Senior Fellow at Bruegel. His research interests include economic governance, macroeconomics, international eco-nomics and time-series analysis. He is also a senior research fellow at the Institute of Economics of the Hungarian Academy of Sciences and at the Corvinus University of Budapest. From 2005 to 2008, he was research advisor to the Argenta Financial Research Group in Budapest. Before that, he was deputy head of the research unit of the Central Bank of Hungary. Zsolt has a PhD in economics from Corvinus University of Budapest.
Foreword
With only seven percent of the world’s people but about half of its welfare payments, the European Union’s levels of inequality and absolute poverty are low in a global context. Nevertheless EU countries face social challenges. Unemployment remains high in a number of member states, while the intergenerational divide between the young and the old has widened. Social mobility is weak, in particular in the more unequal economies of southern Europe, limiting opportunities for the children of poor and disadvantaged families.
Striving for fairness in economic development is crucial in order for societies to be stable and citizens not to feel disenchanted. This was why my colleague Zsolt Darvas and I attempted an analysis of inclu-sive growth in Europe with a global perspective. With around 50 charts and many tables, we provide an anatomy of inclusive growth in the EU.
Our data casts doubt on the popular hypothesis that inequality is an unavoidable counterpart of technological change that favours those with skills. While we find evidence that the demand for university graduates has increased significantly in recent years and that certain tasks, most notably manual and cognitive tasks requiring routine skills, have been automatised, we also find that in many European countries university graduates receive a smaller premium over the wages of lower-educated workers compared to the US, and the premium has fallen. Our results suggest that we should not fear the ‘new machine age’, but must instead equip the next generation of workers with skills that benefit from technology. Such skills are likely to emphasise social and creative intelligence.
European policymakers have a long to-do list to foster inclusive growth in Europe. Pressing tasks include improving access to quality education for all to ensure greater equality of opportunity. Welfare systems should be reformed for greater effectiveness in a number of countries, because the same amount of social spending often yields very different results in terms of inequality. A lower tax burden on low incomes would contribute to inclusive growth, as would a review of protectionism in certain segments of markets and unjustified rents. Designing fiscal policies so that fiscal adjustments do not disadvan-tage the young and families, or undermine education and investment, is equally important. Last but not least, unemployment needs to be addressed.
These policies mostly concern national policymakers. EU institu-tions can highlight best practices and apply peer pressure to member states, but we warn that promising results without proper instruments could backfire and lead to a backlash against the EU if citizens perceive that promises are not being kept.
Executive summary
Years of crisis and stagnation have left Europeans worried about both growth and fairness. They have seen the impact of recessions on their communities, but they are well aware that hardship has not fallen equally on all shoulders. Policymakers need to strive to bring European economies back to robust growth, in order to meet promises of opportunity and prosperity. But that growth must also be fair if cit-izens are not to grow disenchanted. This is why the concept of ‘inclu-sive growth’ is so important and deserving of detailed investigation.
Growth is considered inclusive if it creates opportunities for all segments of the population and shares them fairly. To understand inclusive growth, we must first understand inequality. This can be inequality of opportunity in access to education, jobs, finance or the judicial system, for example. Or it can be inequality of outcomes, such as income, wealth, health and educational attainment. Both categories of inequality are central to discussions of inclusive growth.
Recognition is growing that inclusive growth matters: in specific countries, and in the European Union as a whole. At EU level, an inclusive economy is among the prominent targets of the Europe 2020 strategy.
What are the EU’s main social challenges?
• The EU’s social problems are generally different from social prob-lems in other parts of the world. Poverty, defined as a very low ab-solute income, is extremely rare in the EU. Income inequality also tends to be low, compared with the emerging economies of Asia, Africa and Latin America, and also with the United States.
• Nevertheless, EU economies are diverging in terms of social dy-namics. Social indicators show that polarisation between the south and the north has widened since 2008. Several EU countries, in par-ticular in the south, have suffered increases in material deprivation and unemployment (including youth unemployment and a greater share of children living in jobless households), and a growing intergenerational divide between the young and the old. Income inequality is relatively high in some EU countries, in particular in the southern EU.
• Unemployment has a negative impact on the living conditions of a large segment of society. It also has major negative consequences for medium- and long-term economic growth. Long spells of un-employment erode skills and discourage labour market participa-tion, thereby undermining countries’ long-term growth potentials.
3 | AN ANATOMY OF INCLUSIVE GROWTH IN EUROPE
Why is inclusive growth important?
• When assessing inclusive growth, poverty and income inequality are the two most relevant indicators, although there are many others, including non-monetary indicators. Income inequality and poverty have an impact on inequality of opportunity and prospects for social mobility, with major consequences for individuals and societies.
• Research shows that in most countries children growing up in poorer and disadvantaged families tend to underperform in school compared to their classmates from richer families. Educational underachievement then leads to low employability. Moreover, people with a low level of education tend to have worse health and live shorter lives. An economy cannot be regarded as inclusive if opportunities to progress depend on family background.
• Inequality and poverty also influence the prospects of social convergence across regions, generations and families belonging to different socio-economic groups.
• Higher income inequality is associated with less intergenerational (or social) mobility: the children of poor families tend to become poor, while the children of rich families tend to become rich. The same result holds for educational achievements too. Nordic coun-tries, such as Finland and Denmark, exhibit low income inequality and relatively high social mobility. Southern European countries such as Italy, but also the United Kingdom, are marked by high income inequality and relatively low social mobility.
greater inequality tended to have higher household borrowing prior to the crisis, which led to weaker consumption growth during the crisis. The higher private debt rendered economies more vul-nerable and contributed to the higher unemployment and higher levels of poverty.
• High levels of income inequality and poverty can also boost protest votes in referenda and elections. Our econometric estimates reveal that in the United Kingdom’s June 2016 Brexit referendum, in-come inequality and poverty were factors that boosted the vote for ‘leave’ – in addition to geographical differences and larger shares of less-educated and older people in certain UK regions. Our esti-mates confirm that the young (who will dominate the population in the coming decades) and the well-educated (who may be better able to understand the benefits of EU integration) were more in favour of EU membership.
Does technological change drive income inequality?
• There is no indicator of income inequality for the EU as whole from official statistical sources. Therefore we estimated the EU-wide Gini coefficient and other relevant indicators. Our calculations show marked differences in the development of inequality between the European Union and most other parts of the world, including the United States and emerging countries. In many parts of the world, income inequality increased in the past two decades, but Europe was different. Since 1994, there was a steady decline in net (after taxes and transfers) inequality in the EU until 2008, after which inequality remained broadly the same.
• In the EU and the United States, there has been a decline in
5 | AN ANATOMY OF INCLUSIVE GROWTH IN EUROPE
attainment over the past 25 years. Meanwhile, there has been a tre-mendous increase in jobs for workers with tertiary education, and this is the only job category that expanded after 2008, even in sev-eral countries that were hit hard by the recent global and European financial and economic crises. While underemployment (when a worker takes a job for which they are over-qualified) is a prevailing phenomenon, it tends to be temporary.
• If a greater share of jobs is only open to tertiary-educated workers, it could contribute to greater inequality. This is the case if the skill premium (the potential for higher income that comes with higher educational achievement) is large and increasing. Several authors build on this and explain rising wage inequality through ‘skill-bi-ased technical change’. This is the idea that technological progress is biased in favour of skilled workers and against unskilled workers. However, our data raises doubts about the relevance of this ex-planation for Europe. There was a significant increase in the skill premium in the US and China, and a limited increase in Germany, but the skill premium has in fact declined in many other countries during the past two decades, including the United Kingdom, Italy, Spain, France, Sweden and Japan.
• The income share of the top 1 percent of earners is a major con-tributor to overall income inequality. However, in the US, a rather small fraction of the top 1 percent of earners comes from high-tech industries such as ICT and manufacturing. The bulk of top earners are lawyers, doctors, dentists and financial sector professionals. Some of these industries enjoy a relatively high level of protection, while the impact of technological change may still be comparative-ly modest. Europe tells a different story. In many European coun-tries a much higher share of the top 1 percent of earners than in the United States is in the manufacturing sector.
• Therefore, our comparison of countries suggests that even though technological change tends to favour those with greater skills, it is hard to see how it has contributed to rising inequality. Other factors such as redistribution and education policies or the regulation of certain professions may be more relevant.
• The literature about the risk posed by the automation or ‘robotisa-tion’ of jobs reaches mixed conclusions. Some authors conclude that the risk is high for many current jobs, but others conclude only a few jobs are at high risk. It is difficult to compare such estimates because of their differing assumptions and methodologies.
environ-7 | AN ANATOMY OF INCLUSIVE GROWTH IN EUROPE
ment, such as various services and sales jobs. Demand for labour in ‘middling’ jobs, which require routine manual and cognitive skills – clerks, operators and assemblers, for example – will fall. By analys-ing the largest countries in Europe, we find data that supports this hypothesis.
• Looking ahead, if technology is able to start to cope with
non-routine cognitive tasks, the next generation of workers must be equipped with skills that benefit from technology rather than being threatened by it. Such skills are likely to emphasise social and creative intelligence. Appropriate shifts in education policy are recommended.
implications for growth, while exacerbating inequality and the growing intergenerational divide. A sixth issue is to address (youth) unemploy-ment which is an issue for national labour market policies alongside European and national macroeconomic policies.
The EU has set itself social targets. The EU can set targets but has few direct instruments to achieve them. Such normative power can be useful in increasing peer pressure but it can also lead to frustra-tion as perceived promises are not kept. But the EU can play a greater role in tax policies and by using its regulatory power in setting certain social standards.
1. Introduction
There is a growing recognition that economic growth in itself does not provide equal opportunities to different segments of society. In most countries disadvantaged people find it difficult to progress, as shown by, for example, Sen (2000), Atkinson (2005) and Silver (2007). Children growing up in disadvantaged families tend to underperform
compared to their classmates from richer families (Van der Berg et al,
2011; Leventhal and Brooks-Gunn, 2000), while educational under-achievement leads to low employability (Rutter, 1993; Bynner, 2000). People with low educational levels tend to be less healthy and live shorter lives (Wilkinson, 2003; Braveman and Gottlieb, 2014).
Economic growth that leads to increased inequality in different aspects of life could also be unsustainable. A high level of inequality might lead households to rely on debt financing to maintain living standards, a factor that might have been a significant driver of the housing boom in the pre-crisis period in the US, and the consequent bust (Rajan, 2012; Van Treeck, 2014). Greater inequality could reduce the level and duration of periods of growth (Ostry, Berg and Tsangarid, 2014), and could also be linked to greater financial instability (Skott, 2013; Vandemoortele, 2009). For the euro area, Darvas and Wolff (2014) showed that in countries with greater inequality, households tended to borrow more prior to the crisis, resulting in more subdued consumption growth during the crisis. The resulting high private debt, high unemployment, poverty and more limited access to education undermine long-term growth and social and political stability.
as health, educational opportunities, employment prospects and possibly also environmental issues. An extensive academic literature has explored the reasons behind income inequality and its conse-quences. Multinational institutions, such as the OECD, World Bank, International Monetary Fund and the World Economic Forum have played a pivotal role in defining conceptual issues, indicators and poli-cies for fostering inclusive growth.
Inclusive growth is a top priority in the European Union’s overall strategy. The European Commission, for example, argues in its Europe
2020 strategy, that “in a changing world, we want the EU to become a
smart, sustainable and inclusive economy”1. Other major economies
have similar goals2.
The EU’s social problems are generally different from social prob-lems in other parts of the world. With one of the largest welfare states in the world, the concept of inclusive growth must be explored and defined differently in the EU than in many emerging economies. To illustrate the differences, Table 1 presents three simple indicators. Poverty, as measured by the share of people living on less than $2.50 a day, is practically non-existent in the EU, while the developing world still suffers massively from this problem. Income inequality, as meas-ured by the Gini coefficient, is somewhat diverse in the EU, yet even the most unequal EU countries are somewhat more equal than the United States and much more equal than emerging and developing countries in Africa, Asia and Latin America. Only in terms of the third indicator reported in Table 1, unemployment, do some EU countries rank worse than most of the rest of the world.
1 http://ec.europa.eu/europe2020/index_en.htm.
11 | AN ANATOMY OF INCLUSIVE GROWTH IN EUROPE
Table 1: Poverty and income inequality around the world (latest available data)
N
o. c
oun
tr
ie
s
P
ov
er
ty (%)
In
com
e
in
eq
ual
ity
U
n
em
plo
ym
en
t
ra
te (%)
EU EU15 (ex. south & UK) 10 0.5 27 7.8
Southern EU 4 2.3 34 19.4
United Kingdom 1 0.5 35 6.2
Baltics 3 1.5 34 9.6
Other newer EU members 10 1.7 30 10.3
Non-EU United States 1 1.3 37 6.1
Non-EU advanced (ex. US) 7 0.3 29 4.8
China 1 19.3 53 4.1
Asia (ex. China & CIS) 19 23.6 40 4.5
Latin America 19 12.1 44 6.9
Africa 36 72.5 44 12.0
CIS (former USSR) 10 19.3 35 6.9
Source: Bruegel based on World Bank World Development indicators (poverty), the Standardised World Income Inequality Dataset (income inequality), International Monetary Fund World Economic Outlook (unemployment rate). Note: Poverty refers to the percent of population living below $2.50 a day. Income inequality refers to the Gini coefficient after taxes and transfers. For each country and indicator, the latest available data is used, which is typically available for 2012 or 2013 for poverty and income ine-quality and 2015 for the unemployment rate. Unweighted averages of country data are shown for country groups. EU15 refers to the EU member states before 2004. Southern EU refers to Greece, Italy, Portugal and Spain. Baltics refers to Estonia, Latvia and Lith-uania. Other newer EU members are countries that joined the EU between 2004-13, excluding the three Baltic countries.
The low level of absolute poverty and diverse and relatively lower levels of income inequality underline the different nature of social
challenges in the EU. Darvas et al (2014) demonstrated that Europe’s
the south and the north of the EU has increased, as well as between the young and the old. Hüttl, Wilson and Wolff (2015) show that there was increasing intergenerational polarisation during the economic crisis years. Piketty (2014), in turn, focuses on increases in wealth inequality. Such polarisations, along with differences in access to good jobs, good education and high-quality healthcare, call for a new policy focus in the EU.
2. Inclusive growth:
why it matters
2.1 Defining and measuring inclusive growth
OECD (2014) defines inclusive growth as “economic growth that
cre-ates opportunity for all segments of the population and distributes the dividends of increased prosperity, both in monetary and non-monetary terms, fairly across society”. Inclusive growth goes beyond one-dimen-sional GDP growth. Jobs, skills, education, health, the environment and active participation in the economy and society also matter. The OECD emphasises that what is considered relevant for inclusive growth varies in different countries and circumstances. For instance, in developing countries, social connections and quality of institutions matter more, whereas social protection (such as access to services and unemploy-ment insurance) tend to be more relevant in advanced countries.
Measurement of inclusive growth ranges across a broad spectrum of indicators. OECD research suggests using wide-ranging indicators, including income and wealth, health status, work-life balance, envi-ronmental quality, housing conditions and personal security. White (2012) presents a broad list of requirements for inclusive growth, such as lower income inequality, a reduction in absolute poverty, internalis-ing the externalities of growth, reducinternalis-ing the North–South income gap, reducing inequality of opportunity (such as in access to education, jobs, finance and the judicial system) and greater space for emerging market economies in the governance of international financial institu-tions. A few studies attempt to calculate a single indicator for inclusive growth, such as the ‘opportunity index’ of Ali and Son (2007) or the index based on the ‘social mobility curve’ of Anand, Mishra and Peiris (2013).
While there is a growing consensus that poverty and inequality themselves are not sufficient to characterise the inclusiveness of the growth process, these two indicators are generally considered to be the most relevant factors: see for example Habito (2009), Rauniyar and Kanbur (2010), Dagdeviren, van der Hoeven and Weeks (2000) and Ramos, Ranieri and Lammens (2013).
2.2 Inequality and growth
Inequality of outcomes (such as income, wealth, health and educa-tion) and opportunities (access to education, jobs, finance and the judicial system) are central to understanding how inclusive growth is.
IMF (2015) highlights key factors driving inequality, such as:
• Technological change: inequality has also increased as growth has been accompanied by technological change that favours those with the right skills (skill premium).
15 | AN ANATOMY OF INCLUSIVE GROWTH IN EUROPE
are commonly cited as driving income inequality by lowering wag-es for unskilled labour in advanced countriwag-es (though the empirical evidence is mixed).
• Financial globalisation: while it can facilitate efficient internation-al internation-allocation of capitinternation-al and promote internationinternation-al risk-sharing, financial globalisation can increase income inequality in advanced and emerging market economies because of the concentration of cross-border financial claims in relatively higher-skill and technol-ogy-intensive sectors, which pushes up demand for, and there-fore wages of, higher skilled workers. Financial deregulation and globalisation has increased wages in financial industries, thereby contributing to increases in inequality.
• Financial deepening: financial development could benefit the rich in early stages (Roine, Vlachos, and Waldenstrom, 2009), though it will likely also promote better access of households and firms to finance and thereby reduce income inequality.
• Changes to labour market institutions: more flexible labour market institutions can foster economic dynamism by reallocating resources to more productive firms and therefore provide better opportunities for skilled workers. On the other hand, greater flexibility can pose challenges to low-skilled employees, while the decline in trade union membership and increase in more temporary forms of employment can increase their vulnerability.
Greater inequality could affect economic growth in various ways (as various papers have already summarised, for example OECD, 2008, 2011, 2014). Greater inequality and financial market imperfections might reduce the capacity of low-income households to invest in education, lowering economic growth (Galor and Zeira, 1993, 1998). Under-investment in human capital by poorer segments of society might reduce social mobility and adequate allocation of talent across
occupations (Banerjee and Newman, 1993; Fershtman et al, 1996;
Owen and Weil, 1998). Greater inequality might also reduce growth if it leads to political instability and social unrest (Alesina and Perotti, 1996; Knack and Keefer, 2000). If inequality becomes unacceptable for voters, they might insist on higher taxation and regulation and mis-trust businesses, reducing incentives to invest (Bertola, 1993; Alesina and Rodrick, 1994).
On the other hand, greater inequality could increase growth if it provides incentives to work harder and take risks in order to capitalise on high rates of return (Mirrlees, 1971; Lazear and Rosen, 1981). High differences in rates of return for education might encourage more people to seek education. Higher inequality could foster aggregate savings and capital accumulation, because the rich consume relatively less (Kaldor, 1956; Bourguignon, 1981).
The empirical evidence for the impact of inequality on growth is inconclusive. Several papers have found that inequality reduces growth, while many others have concluded that it increases growth. A number of papers have concluded that the impact is insignificant or that earlier findings that seemed conclusive are not robust.
17 | AN ANATOMY OF INCLUSIVE GROWTH IN EUROPE
Among the studies that found inconclusive results or concluded that earlier findings in the literature were not robust, Barro (2000), for exam-ple, found that the relationship is insignificant for the whole sample (which includes 84 countries), but positive in rich and negative in poor countries. Castelló and Domenech (2002) found a negative relationship for the whole sample, but a positive relationship when income and human capital inequality are considered simultaneously. Banerjee and Duflo (2003) found negative effects on growth resulting from changes in inequality in any direction. Voitchovsky (2005) found an insignificant relationship considering the whole sample, but a positive relationship at the top of the inequality distribution and negative at the bottom of the inequality distribution. The findings of Castelló (2010) were similar to the findings of Barro (2000): that there is a negative relationship for poor countries and a positive relationship for rich countries, though for the whole sample he found a negative relationship.
Anderson and Maibom (2016) rationalise the mixed results of the literature. They argue that theoretically, there exists a trade-off between efficiency and equity only at the frontier of the possible set of combinations of economic performance and income equality availa-ble to policymakers. However, there may be many historical, institu-tional and political reasons why countries are not at the frontier, and these countries can improve efficiency and equity at the same time. Their empirical stochastic frontier analysis using data from OECD countries supports these theoretical predictions: the estimated frontier indicates a trade-off between efficiency and equity, but there are many countries well below the frontier and therefore a simple cross-country correlation would suggest a seeming positive relationship between efficiency and equity. By using a different frontier analysis and data
from US states, Aghion et al (2015) report similar findings. They find
2.3 Social mobility
Higher inequality is found to be associated with less inter-generational mobility: the children of poor families tend to stay poor, while the children of rich families tend to stay rich. This association is described by the so-called ‘Great Gatsby Curve’ (Figure 1), which relates inter-generational earnings elasticity (how much a child’s adult earnings vary from his/her parents’ earnings) to income inequality (Corak,
2013; Andrews and Leigh, 2009)3. The higher this elasticity (that is,
earnings of a worker correlate more with the earnings of his/her parents), the lower social mobility is. The results clearly indicate that greater inequality tends to be associated with a greater likelihood that economic advantage/disadvantage will be passed from parents to their children. For example, in some Nordic countries (Finland, Denmark, Norway), where income inequality is relatively low (Gini coefficient around 21-23), intergenerational earnings elasticity is also relatively low, below 0.2, implying relatively high social mobility. In contrast, in countries where income inequality is relatively high (Italy, United Kingdom, United States), intergenerational earnings elasticity is much higher and close to 0.5, implying relatively low social mobility. While there are differences in intergenerational mobility in different regions
in each country, Bratberg et al (2015) found that the most socially
mobile region in the US is substantially less mobile than the least mobile regions of Norway and Sweden.
Educational achievement is a driver of social mobility. For the United States, Belley and Lochner (2007) concluded that even con-trolling for cognitive skills, the strength of the relationship between family income and college attendance is persistent and even increases over time. Bailey and Dynarski (2011) found that the rate of college graduation increased by only 4 percentage points for low-income cohorts born in the early 1980s relative to cohorts born in the early
19 | AN ANATOMY OF INCLUSIVE GROWTH IN EUROPE
1960s, while those born into high-income households increased by 20 percentage points during the same period. Reardon (2011) showed that maths and reading score differences between the 90th and 10th percentiles did not change from 1950-70, but increased to 30-40 per-cent between 1970-2001.
Figure 1: The Great Gatsby Curve: more inequality is associated with less mobility across the generations
Source: Reproduced with permission from Corak (2013), Figure 1.
An important reason for such a relationship is that richer parents
can provide better educations for their children. Knudsen et al (2006)
emphasised the importance of socio-economic status, including the quality of neighbourhoods and schools, which influences children’s’ cognitive abilities. Socio-economic status has an impact on success in primary school, which in turn influences success in high school and college, and subsequently the access to good jobs in the labour market. McLanahan (2004) found that children born to more-educated mothers are likely to be raised by older, more mature mothers who are working and have better paying jobs and who are thus able to support their children more, while children of less-educated mothers are likely
Denmark Norway Finland
Canada
Australia
Sweden New Zealand
Germany Japan
France United States
United Kingdom Italy
0 0.1 0.2 0.3 0.4 0.5
20 25 30 35
Generational
e
ar
n
in
gs
e
la
st
ic
it
y
(l
es
s
m
ob
il
it
y
→
)
to make less significant gains and even incur losses in the parental
resources available to them. Aghion et al (2016a) conclude that
inno-vation, particularly new entrants, is positively associated with social
mobility, while Aghion et al (2016b) find that the probability of
becom-ing and inventors is strongly correlated with parental income, which correlation is mostly driven by the ability of richer parents to provide better education to their children.
Another aspect is the skill premium. Aaronson and Mazumder (2008) and Mazumder (2012) found that the higher the returns from going to college, the lower the degree of intergenerational mobility. They showed that the correlation between returns from going to col-lege and intergenerational mobility of earnings was quite strong in the United States from 1940-2000.
Some authors highlight that prospects for social mobility differ for different segments of society. For example, Bratsberg (2007) concluded that in Denmark, Finland and Norway (three countries in which social mobility is relatively high) being raised by a low-income father does not disadvantage children, but being raised by high-income father confers an advantage (ie intergenerational elasticity of income does not change for the lower part of the distribution, but changes for the
top part). For the United States, Bratberg et al (2015) found particularly
21 | AN ANATOMY OF INCLUSIVE GROWTH IN EUROPE
Moreover, Solon (2004) also argued that public policy can either accentuate or dampen the influence of labour market inequality and intergenerational mobility. Public programmes that benefit the less
well-off relatively more may increase social mobility4. A possible
political reason for reduced intergenerational mobility might be that wealthy individuals capture the political system and thereby reduce more redistributive policies, which in turn lowers social mobility
(Burtless and Jencks, 2003)5.
2.4 Impact on politics: Brexit vote boosts case for inclusive growth
High inequality and poverty can boost protest votes in referenda and elections.In the United Kingdom’s Brexit referendum on 23 June 2016, 51.9 percent of voters rejected the United Kingdom’s membership of the European Union. Did income inequality, poverty and unemployment contribute to ‘leave’ votes? To answer this question, we estimated some regressions to uncover the determinants of ‘leave’ votes and voter turnout. Full details of our regression analysis are presented in Annex 1, while here we summarise the key findings and conclusions.
Using hard data from statistical offices (as opposed to using the results of opinion surveys) for 173 UK regions, our regression results confirm that younger and better-educated people voted for ‘remain’ in greater proportions and older and less-educated people tended to vote for ‘leave’. There was a clear geographical pattern in which Scotland, Northern Ireland and London were for ‘remain’. The actual presence of immigrants did not have a significant effect on the results, supporting
4 For example, public spending on education directed at high-quality early childhood education and to primary and secondary schooling accessible for all is likely to benefit more families that are lower in the socioeconomic scale than public spending directed at high-quality private tertiary education accessible to only a few.
the conjecture of Mourlon-Druol (2016) that it was the perception that immigration could be a problem, rather than the actual presence of immigrants, that influenced the vote. Average household income did not play a role either; we adjusted for several socio-economic char-acteristics of the regions. Turnout was lower among disadvantaged people and in the ‘remain’ strongholds: the young and residents of Scotland, Northern Ireland and London voted in lower proportions.
Despite the clear overall vote for ‘leave’, EU leaders could take a positive message from the referendum result. The young (who will come to dominate the population) and the well-educated (who might be able to understand better the benefits of EU integration) were more in favour of EU membership.
A key contribution of our calculations is to show using regres-sion analysis that in areas of the UK where inequality and poverty are higher, there were more ‘leave’ votes, even after controlling for socio-economic and geographic factors. This finding calls for more inclusive growth. In the UK, income inequality – a key indicator of inclusive growth – is almost the highest in the European Union. Theresa May, who became prime minister of the UK in the wake of the Brexit vote, rightly emphasised very strongly the importance of social
reform to reduce inequality of opportunity (Asthana et al, 2016).
3. Labour markets, inequality
and technology
The key underlying theme from our literature survey and our analysis in the previous section is that inequality of opportunity, fuelled by poverty, inadequate access to good education, jobs and healthcare are likely to be detrimental not just to personal well-being and social cohesion, but also in terms of macroeconomic prospects and polit-ical stability. Income inequality can be a major factor influencing the inequality of opportunity and the prospects for social mobility and convergence of social indicators among families with different socio-economic standings, age profiles and that live in different regions. In this chapter, we document the development of income inequality in the European Union as a whole, based on our novel estimates, and assess the potential drivers of income inequality.
3.1 Income inequality: Europe is different
European countries are different from most countries in terms of how income inequality has developed. Unfortunately, income inequality indicators are not available from official statistical sources for the EU
as a whole6. Therefore, in Darvas (2016b), we estimated for the EU the
Gini coefficient of income inequality from 1989 to 2014.
Figure 2 shows a marked difference between the United States and the European Union in inequality over time. In the US, income inequality declined in the 1960s and remained broadly unchanged in the 1970s. Since then, however, there has been a steady increase in income inequality, both before redistribution (so-called ‘market’ inequality) and after taxes and transfers (‘net’ inequality).
There was a sharp increase in EU-wide inequality from 1989-93, reflecting a large increase in inequality among the first 15 EU member states and among the 13 countries that joined the EU from 2004 onward. The central and eastern European countries in the latter group suffered from massive output declines because of their transitions from socialist to market-based economies during this time, which widened the income gap between their citizens and those of western European countries, pushing up aggregate EU-wide income inequality.
Nevertheless, the most notable feature of Figure 2 is the steady and remarkable decline in net income inequality in the 28 current EU countries from 1995 to 2008. This development differentiates the EU not just from the US, but also from most other countries.
The decline in EU-wide net income inequality stopped in 2008 and income inequality has remained broadly stable since then. Therefore, the recent global and European financial and economic crises might have played a role in halting the 15-year long trend of declining net income inequality in the EU.
25 | AN ANATOMY OF INCLUSIVE GROWTH IN EUROPE
same level as the EU in 2010-14, yet net inequality is much lower in the EU, underlining the importance of redistribution. We will analyse redistributive issues in more detail in chapter 5.
Figure 2: Gini coefficient of market (before taxes and transfers) and net (after taxes and transfers) income inequality: comparing the EU as a whole with the US, 1960-2014
Source: Bruegel based on US data: the Standardised World Income Inequality Da-tabase (SWIID) from Solt (2016); EU28 data: Darvas (2016b), which is based on the individual country data from Solt (2016); thereby the US and EU28 data reported in this figure are comparable. Note: A Gini index of zero represents perfect equality (ie incomes are perfectly evenly distributed) and a Gini index of indicates 100 perfect inequality (all incomes are owned by one person).
Unfortunately, missing data does not allow calculation of the EU28-wide Gini index before 1989. In order to show inequality over an even longer term for some EU countries, Figure 3 reports Gini coefficients for the five largest EU countries compared to Brazil, China, Japan and the US. While there were some fluctuations, the Gini coefficient tended to be lower in France and Germany than in other countries. Italy, Spain and the UK are less equal than France and Germany, yet they are much more equal than the Brazil, China and the US.
30 35 40 45 50 55
19
60
19
65
19
70
19
75
19
80
19
85
19
90
19
95
20
00
20
05
20
10
20
15
Market, US
Net, US
Market, EU28
Figure 3: Gini coefficient of net income inequality (after taxes and transfers), selected countries, 1960-2014
Source: Bruegel based on the Standardized World Income Inequality Database (SWIID). Note: A Gini index of zero represents perfect equality (ie incomes are perfect-ly evenperfect-ly distributed) and a Gini index of indicates 100 perfect inequality (all incomes are owned by one person).
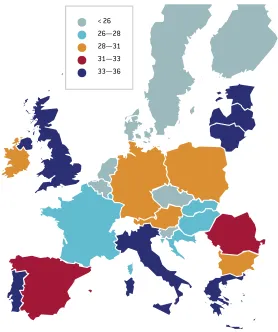
While the EU as a whole, and individual EU countries, tend to be characterised by lower income inequality than the US and most emerging/developing countries, there is are significant differences between EU countries, as Figure 3 shows for the five largest EU coun-tries. Figure 4 maps the inequality levels of EU countries between 2010-14. Mediterranean countries, Baltic countries and the United Kingdom exhibit relatively high Gini coefficients, while Nordic coun-tries and ‘core’ continental EU councoun-tries are characterised by lower income inequality levels.
27 | AN ANATOMY OF INCLUSIVE GROWTH IN EUROPE
Figure 4: Gini coefficient of net disposable income in the EU, average of 2000-14
3.2 Long-term structural changes to labour markets: the EU and US
are similar
Despite differing developments in net income inequality, there is a striking similarity between the EU and the US in terms of a major long-term change in the labour market: the decline in jobs with low education requirements and the increase in jobs with high education requirements. This development has major implications for social mobility.
While the categorisation of jobs according to education require-ments differs somewhat between the EU and the US, Figure 5 and Figure 6 show notable similarity.
The number of jobs for people with higher education has increased significantly and steadily in both the EU and the US, starting at least after 1992 (since when there is available EU data). The number of such jobs has practically doubled in two decades. It is really noteworthy that during the global and European financial and economic crises of the past few years, employment of highly-educated workers continued to increase in the EU, even in countries suffering from large increases in unemployment, such as Cyprus, Italy, Ireland, Lithuania, Portugal and Spain. In three other hard-hit countries, Estonia, Latvia and Greece, the employment of the highly-educated remained broadly stable. In the US, there was just a slight decline in the number of jobs requiring high-level educational attainment in 2009, since the increasing trend
has resumed7.
29 | AN ANATOMY OF INCLUSIVE GROWTH IN EUROPE
Jobs requiring medium-level qualifications also increased signif-icantly after 1992 in both the EU and the US, but the growth of such jobs stopped in the EU in 2008 and after some decline, only a slow job growth has resumed in the US.
On the other hand, the number of jobs in the EU for people with
lower qualification levels declined between 1992 and 20078 and
dropped massively during the crisis. In the US, the number of such jobs was more or less stable from 1993 to 2007, after which there was a major decline.
Figure 5: Employment by educational attainment in the EU, 1992-2015 (millions of jobs)
Source: Eurostat ‘Employment by sex, occupation and educational attainment level (1 000) [lfsa_egised]’ dataset. Note: the solid line shows the aggregate of EU15 countries (EU members before 2004), which is available from 1992. The same-colour dashed line indicates the aggregate for 27 EU member states, which is available from 2000.
Therefore, the recent global and European crises have amplified the difference between the availability of jobs requiring high and low
8 There were a few exceptions to this trend, like in Spain and Ireland, where the pre-crisis housing bubbles were associated with the creation of low-skilled jobs in the construction sector. However, the excess creation of such jobs proved to be unsustain-able.
0 20 40 60 80 100 120
19
92
19
94
19
96
19
98
20
00
20
02
20
04
20
06
20
08
20
10
20
12
20
14
Less than primary, primary and lower secondary education (EU15)
(EU27)
Upper secondary and post-secondary non-tertiary education (EU15)
(EU27)
Tertiary education (EU15)
levels of education, even though the divergence started at least 25 years ago.
Using data from the United States, Bitler and Hoynes (2015) report that lower income earners experience much greater income variabil-ity than higher earners. Furthermore, this disproportionate effect of recessions on low earners was greater in the great recession of 2008-09 compared to the previous 1980s recession. The vulnerability of low-skilled workers likely applies in the EU too.
The long-term decline in the number of jobs for low-educated workers, and the consequent vulnerability of those workers, underline the importance of upward social mobility. More and more children and young people need to attain higher levels of education, including those who were born to parents with low educational achievements.
Figure 6: Employment by educational attainment in the US, 1992-2015 (millions of jobs)
Source: US Census Bureau. http://data.bls.gov/pdq/SurveyOutputServlet. Note: An-nual averages for employed persons 25 years and over.
Developments in China have been different, reflecting its different level of economic and social development (Figure 7). In 1997, almost 100 million jobs were filled by illiterate people, declining to close to zero by 2014. The number of jobs for workers with only primary
0 5 10 15 20 25 30 35 40 45 50 55
19
92
19
94
19
96
19
98
20
00
20
02
20
04
20
06
20
08
20
10
20
12
20
14
High school graduates and less
Associate's degree or some college
31 | AN ANATOMY OF INCLUSIVE GROWTH IN EUROPE
education also declined considerably from 246 million to 143 mil-lion between 1997 and 2014, possibly related to urbanisation and the decline in agricultural jobs. On the other hand, only 20 million jobs, less than 3 percent of total jobs, were occupied by people with college and higher degrees in 1997. The number of such jobs increased tre-mendously to 112 million by 2014, reaching a share of 15 percent of all jobs. Among workers with college and higher education, the number of university graduates increased from 10 million in 2001 to 46 million in 2014. The number of jobs requiring junior and senior school qualifi-cations also went up. It has to be noted, moreover, that the number of illiterate and semi-literate workers declined sharply from 90 million in 1997 to 14 million in 2014.
Figure 7: Employment by educational attainment in China, 1997-2014 (millions of jobs)
Sources: National Bureau of Statistics of China. Note: Data for employment of universi-ty graduates and above only available from 2001 onwards. China has 9 years of publicly funded compulsory education, which consists of 6 years of primary school and 3 years of junior school. After 9 years of primary and junior school, there is 3 years of senior school. After senior school graduation (equivalent to US high school education and EU upper-secondary education) people enter either college (equivalent to US and EU spe-cialised and vocational education) or university (equivalent to US bachelor’s degree or higher and EU tertiary education).
0 100 200 300 400 500 600 700 800
19
97
19
98
19
99
20
00
20
01
20
02
20
03
20
04
20
05
20
06
20
07
20
08
20
09
20
10
20
11
20
12
20
13
20
14
University
College
Senior school
Junior school
Primary school
On the other hand, it is notable that the total number of jobs in China increased only by 11 percent from 1997 to 2014, which corre-sponds to 0.6 percent per year job creation, while average GDP growth during the same period was 9.5 percent.
3.3 Technological change and the skill premium
Recent economic research studying the impact of technology on the labour market emphasised the role played by skill-biased technical change, the idea that technical changes shifts production to technology that favours skilled over unskilled workers (see Katz and Autor, 1999, and Violante, 2008, for surveys of the literature). By increasing the pro-ductivity of skilled workers, and thereby the demand for such workers, skill-biased technical change may explain rising wage inequality.
The skill premium and/or returns from schooling refer to the gain that a worker gets by investing in higher education. It is calcu-lated as the ratio of wages of the high-skilled workers to the wages of low-skilled workers. Autor (2014) notes the dramatic rise in the skill premium in the US and argues that this contributes substantially to the rise in income inequality. Figure 8 shows that the median weekly earnings of high-skilled workers continually increased during the 1980s and 1990s, whereas the weekly earnings of those with primary and high school education experienced a decline. Since about 2000, however, the increase in the skill premium has stopped.
Autor (2014) attributes the sharp increase in the skill premium in the US to:
• The decline in non-college employment in production, administra-tive and clerical work;
• The sharp rise in low-skilled labour supply and competition from the developing world;
33 | AN ANATOMY OF INCLUSIVE GROWTH IN EUROPE
Figure 8: Median weekly earnings by education (left hand scale) and the skill premium (right hand scale) in the US, 1979-2013
Source: US Bureau of Labor Statistics. Note: the sample is not longitudinal (ie not following the same people through time) and thereby compositional changes (eg the arrival of new workers with a lower wage) influence the median value. In Figure 10 we show the average real wage growth according to skill level, which is not a longitudinal sample either. Figure 10 suggests that there was some real wage increase even for low-skilled workers (though such an average statistic is also influenced by compositional changes). Still, Figure 10 confirms that the skill premium has increased in the United States.
However, the question remains of whether, in such analyses, education can be used interchangeably with skills, ie if we can cred-ibly state that education translates into skill and thus has an impact on wages. The OECD Program for International Assessment of Adult Competences (PIAAC) provides an internationally compatible data-base of adult cognitive skills and skills needed in the workplace, namely literacy, numeracy and problem-solving. The results of the survey indicate that cognitive skills differ greatly depending on edu-cational attainment. Figure 9 compares the mean numeracy score of adults with lower than high school education to the scores of those who have obtained tertiary education. Workers with tertiary education have higher numeracy scores in all countries, particularly in the US
0 0.5 1 1.5 2 2.5 3 400 500 600 700 800 900 1000 1100 1200 1300 19 79 19 81 19 83 19 85 19 87 19 89 19 91 19 93 19 95 19 97 19 99 20 01 20 03 20 05 20 07 20 09 20 11 20 13 R at io (s ki ll p re m iu m ) C u rr en t U SD (w ee kl y ea rn in gs )
where the mean score difference is greatest at 82 points between those with less than high school education and those with college education. France ranks second with a 78 point gap.
Figure 9: Mean score on the numeracy test by educational attainment, 2013
Source: OECD PIAAC survey, 2013.
However, over time, the skill premium has not increased every-where. As Figure 10 shows, in the United States, the wages of high-skilled workers increased much more than the wages of low-high-skilled workers from 1995 to 2009. While such a development can also be observed in China and to a much lesser extent in Germany, exactly the opposite has happened in France, Italy, Spain, the United Kingdom, Sweden and Japan, where the wages of high-skilled workers declined relative to the wages of the low-skilled, while in Korea wages increased broadly at the same rate in all three skill categories. Consequently, there are major differences in the level of skill premium. While it is around 2.5 in the US and China, the EU average skill premium is around 1.6, albeit with significant differences between EU countries (Figure 11). Turkey and Brazil have the highest skill premiums among the countries considered.
200 220 240 260 280 300 320 U S Fr an ce Sp ai n C an ad a Ir el an d U K It al y So u th K or ea P ol an d A u st ra lia G er m an y Sl ov ak ia Sw ed en A u st ri a D en m ar k N et h er la n d s C ze ch R ep u b lic N or w ay Ja p an Fi n la n d
35 | AN ANATOMY OF INCLUSIVE GROWTH IN EUROPE
Figure 10: Percent change in wage per hour worked from 1995-2009 (deflated by the consumer price index)
Source: World input output database, July 2014 release; Note: definition of skills follows 1997 ISCED level, where LOW encompasses primary education or first stage of basic education and lower secondary or second stage of basic education; MEDIUM is (Upper) secondary education and post-secondary non-tertiary education; HIGH is first stage of tertiary education and second stage of tertiary education.
One possible reason for the differences in the way skill premiums have developed is the supply of higher-educated workers. The supply of such people in a given year is composed of those who obtained their degrees earlier, those who obtained their degrees in the current year, the net immigration of people with university degrees, minus those who left the labour force because of retirement or any other reason. It is not easy to obtain data for each of these components, but we report two relevant indicators: the annual number of new graduates (representing the annual ‘home production’ of workers with univer-sity degrees) and the unemployment rate among people with tertiary education (which indicates the tensions in the labour market).
The number of new graduates has increased steadily in the EU and in the US (Figure 12). Interestingly, the total percent increase from
-20 -10 0 10 20 30 40 50
G
er
m
an
y
Fr
an
ce
It
al
y
Sp
ai
n
U
K
Sw
ed
en
Ja
p
an US
So
u
th
K
or
ea
High; skilled. Middle skilled Low skilled
-100 -50 0 50 100 150 200 250
C
h
in
1998 to 2014 was very similar: 85 percent in the US and 90 percent in the EU. In our view, this slight difference in the number of new graduates cannot explain the major differences in the EU and US skill premium trends. On the other hand, there was a huge increase of new graduates in China, where the skill premium increased dramatically.
Figure 11: Relative earnings of workers by educational attainment (earnings of medium-educated workers = 100), 2013
Source: OECD Education at a glance, 2015. Note: Adults with income from employ-ment, medium education refers to upper secondary education and equals 100. (*) Data for 2012. (**) Data for 2011. (***) Data for 2010.
Moreover, the unemployment rate among people with tertiary education should be a useful indicator, reflecting the tightness of the labour market. Figure 13 shows that there is a statistically significant association between the unemployment rate among people with ter-tiary education and the change in the skill premium: a lower unem-ployment rate is associated with a higher increase in the skill premium, as expected. But the increase in the skill premium in the United States was much faster than the regression relationship would have implied. Figure 13 therefore suggests that the supply-demand conditions were
0 0.5 1 1.5 2 2.5 3 3.5 4 4.5 0 50 100 150 200 250 300 350 Sw ed en D en m ar k E st on ia B el gi u m C an ad a It al y* * So u th K or ea Fi n la n d * G re ec e U K Sp ai n * Ja p an * A u st ri a Fr an ce N et h er la n d s* ** Lu xe m b ou rg P or tu ga l P ol an d * Sl ov ak ia G er m an y* Sl ov en ia C ze ch R ep u b
lic US
Ir el an d T u rk ey H u n ga ry B ra zi l
37 | AN ANATOMY OF INCLUSIVE GROWTH IN EUROPE
not the key determinants of the major skill premium increase in the United States, and that there were other reasons.
Therefore, relative to the EU and China, the data does not support the claim that a reduced supply of university graduates relative to demand has been one of the main reasons for the increased skill pre-mium in the United States.
Figure 12: Number of new tertiary education graduates per year, millions, 1998-2014
Source: Eurostat, OECD and Chinese Ministry of Education. Note: Tertiary education is classified as ISCED 5 and above/bachelor’s degree and above.
In terms of the wage skill premium, Hanushek et al (2014) find
that on average one standard deviation increase in numeracy score is associated with an 18 percent increase in wages. In Sweden, the Czech Republic and Norway the returns range from 13-15 percent, while in the US, Ireland and Germany the wage returns to skill average 24-28 percent, thus showing significant differences between countries.
Felgueroso et al (2010) document the reasons for the falling wage
skill premium in Spain in two periods: from the mid-1980s and from the mid-1990s to 2010. The authors conclude that despite the signif-icant increases in the number of graduates with tertiary education,
0 1 2 3 4 5 6 7 8
19
98
19
99
20
00
20
01
20
02
20
03
20
04
20
05
20
06
20
07
20
08
20
09
20
10
20
11
20
12
20
13
20
14
European Union (27 countries) United States
Spain recorded a falling wage skill premium starting from the begin-ning of 1990s. Over-education and a continuous mismatch between education and occupation explain the falling returns on education among high skilled workers. Structural changes to the Spanish labour market with a marked increase in temporary employment also con-tributed to the falling premium. Temporary contracts have affected workers of all ages and educational levels, in particular the middle skilled, which affects their employment and wages in later stages of their careers.
Figure 13: The correlation between the average rate of unemployment of those with tertiary education and the change in the skill premium, 1998-2009
Source: Eurostat, OECD. Skill premium is calculated from World Input-Output database.
We note that the United States is also an outlier in terms of the relationship between the share of tertiary-educated workers and the tertiary education premium: in OECD countries where the share of tertiary-educated workers is high, the tertiary education premium
AUT
BEL
BGR*
CZE
DEU
DNK
ESP
EST FIN
FRA
GBR GRC
HUN
IRL
ITA JPN
KOR
LTU LUX*
LVA
NLD
POL
PRT ROU
SVK SVN SWE USA
-40% -30% -20% -10% 0% 10% 20% 30%
0.0 1.0 2.0 3.0 4.0 5.0 6.0 7.0 8.0
% change in the skill premium
39 | AN ANATOMY OF INCLUSIVE GROWTH IN EUROPE
tends to be relatively low (Figure 14). But the United States and Ireland are exceptions to this trend and the relatively high share of tertiary-educated workers is associated with a relatively high tertiary education premium. On the other hand, Italy, where income inequal-ity is relatively high, is an outlier on the other side: the very low share of tertiary-educated workers is associated with a rather low tertiary education premium.
Figure 14: Share of tertiary-educated workers and their relative earnings, 2013
Source: OECD, Education at a glance 2015. Note: Workers with medium education= 100. Data for Netherlands: 2010; France and Italy: 2011; Australia, Canada, Finland, Japan, Poland, Spain: 2012.
Finally, we report data on the composition of the top 1 percent of income earners. If technological development was the key driver of the skill premium, then we would expect many high-tech sector workers to be in the top 1 percent. This is not really the case for the US: many of the top earners are lawyers, doctors and financial service employees, and very rarely ICT sector workers (Figure 15). Rothwell (2016) argues
AU AT
BE CA
CZ
DK EE
FI FR
DE
GR
IE
IT
JP
KR LU MX
NL
NZ
NO PL
PT SK
SI
ES
SE CH TK
UK US
R2 = 0.2823
120 130 140 150 160 170 180 190 200
10 15 20 25 45 50 55 60
that these high-earning sectors enjoy high levels of protection in the US and thereby enjoy unjustified rents relative to their skills.
Figure 15: Industries with the most top 1% earners in the United States
Source: Rothwell (2016).
Europe is different from the US in terms of the composition of the top 1 percent. As calculated by Denk (2015), after finance and insur-ance, manufacturing is the second industry with about 18 percent of the top 1 percent of earners, and ICT also ranks prominently. In Germany, manufacturing sector employees account for 34 percent of the top 1 percent of earners. Therefore, in Europe a larger share of technology-intensive sector workers are privileged to be in the top 1 percent, compared to the US.
To sum up, our comparison of countries suggests that even though technological change tends to favour those with greater skills, it is hard to see in the data how it has contributed to rising skill premia and consequent income inequalities. Most likely, other factors were more important, such as redistribution and education policies or regula-tion of certain professions. This result is in line with the findings of Anderson and Maibom (2016), who argue that political changes can explain the movements of the United States toward higher efficiency and lower equity during recent decades.
0 2 4 6 8 10
Banking & related activities Colleges & universities Offices of dentists Accounting & related services Insurance Computer systems design Real estate Management & related services Securities & financial investments Offices of physicians Hospitals Legal services
41 | AN ANATOMY OF INCLUSIVE GROWTH IN EUROPE
Figure 16: Industries with the most top 1% earners in the European Union
Source: Denk (2015). Note. Employees in the public administration are not available for all countries and are therefore removed from the sample for cross-country compar-ison. Germany is excluded from the average since its industry classification is different.
3.4 Technological change and the risk of ‘robotisation’
Autor, Levy and Murnane (2013) argue that technology can replace human labour in routine tasks, whether manual or cognitive, but (as yet) cannot replace human labour in non-routine tasks. Combining these two strands, Goos and Manning (2013) argue for the UK that the impact of technology leads to rising relative demand in well-paid skilled jobs, which typically require non-routine cognitive skills, and rising relative demand in low-paid least-skilled jobs, that typically require non-routine manual skills. At the same time, demand for ‘mid-dling’ jobs, that have typically required routine manual and cognitive skills, will fall. The authors call this process ‘job polarisation’.
Acemoglu and Autor (2011) found similar results for the US and concluded that technological change increased the demand for skilled labour. Technology was incorporated into the subset of core job tasks previously performed by middle-skill workers, causing substantial change. When differentiating employment growth by occupation, one
0 5 10 15 20 25
Leisure activities Education Energy Admin. & support Construction Transportation Health & social care ICT Professional services Wholesale & retail Manufacturing Finance & insurance
Bottom 99%
can see similar developments also in Europe (Figure 17). The number of high-education jobs such as managers, engineers and
Figure 17: Employment growth, 1995-2015, by occupation
Source: Eurostat. *data for Sweden starts only in 1997. Note: Top left panel: Clerks include office clerks (eg secretaries and keyboard-operating clerks, library, mail and related clerks, etc) and customer services clerks (eg cashiers, tellers, client information clerks). Top right panel: Craft and related trades workers include extraction, building trades, metal, machinery, precision, handicraft, craft printing, food processing, wood treaters textile and related trades workers, while operators and assemblers include sta-tionary-plant operators, machine operators and assemblers, drivers and mobile plant operators. Bottom left panel: professions included are service workers and shop and market sales workers, agriculture, fishery and related labourers, and labourers in ming, construction, manufacturing and transport. Bottom-right panel: professions in-clude legislators, senior officials, managers and various professionals and technicians (including physical, mathematical, engineering science, life science, health, teaching, business, finance, legal, social science and other professionals, police inspectors and detectives). See the complete classification here: http://ec.europa.eu/eurostat/docu-ments/1012329/6070763/ISCO88.pdf/192120ae-49cb-4f24-bfbc-06f054471e3b. -12.5 -10 -7.5 -5 -2.5 0 G er m an y Sp ai n Fr an ce It al y Sw ed en * U K -12.5 -10 -7.5 -5 -2.5 0 G er m an y Sp ai n Fr an ce It al y Sw ed en * U K 0 2.5 5 7.5 10 12.5 G er m an y Sp ai n Fr an ce It al y Sw ed en * U K 0 2.5 5 7.5 10 12.5 G er m any Sp ai n Fr an ce It al y Sw ed
en* UK
Clerks
Services, Sales, Elementary
Craft, Trade, Operators, Assemblers
43 | AN ANATOMY OF INCLUSIVE GROWTH IN EUROPE
health professionals, is growing, while the number of middle-edu-cation jobs (clerks, machine operators, assemblers) is declining. By contrast, the number of low-education service occupations, such as shop workers, which are non-standard and difficult to replace by automatisation, is growing. Looking ahead, a second wave of roboti-sation is on its way, in which intelligent robots will more and more be capable to carrying out high skill level jobs. In recent years, a series of studies has revived the debate about robotisation taking over jobs. Frey and Osborn (2013) in particular sparked a debate by claiming that 47 percent of US jobs are at risk of being automated. Bowles (2014) redid these calculations for the European labour market, and found that on average, 54 percent of EU jobs are at risk of computerisation.
By contrast, Arntz et al (2016) argue that one of the major
limita-tions of Frey and Osborn is that they view occupalimita-tions rather than tasks as being threatened by automation. They therefore focus on the task-content of jobs, and find that in the US only 9 percent of jobs (as opposed to 47 percent) are potentially automatable. Figure 18 shows their results by country. Breaking down the risk according to educational attainment (Figure 19), one can see that low-edu-cated workers will likely bear the brunt of technological change related adjustment costs.
Figure 18: Potential for automation of jobs, OECD countries
Source: Arntz et al (2016) based on the Survey of Adult Skills.
Figure 19: Share of people with at risk of automation of their jobs by educational level and country
Source: Arntz et al (2016) based on the Survey of Adult Skills. 0% 5% 10% 15% 20% 25% 30% 35% 40% 45% 50% C ze ch R ep u b lic Sl ov ak ia A u st ri a G er m an y It al y N et h er la n d s P ol an d C an ad a U K B el gi u m D en m ar k Fr an ce Sp ai n U S Ja p an N or w ay E st on ia Ir el an d Sw ed en Fi n la n d So u th K or ea R u ss ia
Mean automatibility High risk
0% 10% 20% 30% 40% 50% 60% 70% 80% 90% 100%
Austria US Germany Canada Korea Belgium Spain Finland Netherlands UK France Italy Denmark Sweden Poland
Upper secondary education