International Journal of
ELECTROCHEMICAL
SCIENCE
www.electrochemsci.org
Determination of Lead(II) Using Glassy Carbon Electrode
Modified with Hexagonal Co
3O
4Microparticles
Jingmin Liu, Riya Jin*, YinaQiao, Yuanyuan Wu, Xiaojian Wang, Ying Wang
School of Environment and Safety Engineering, North University of China, Taiyuan, Shanxi 030051, People's Republic of China.
*E-mail:[email protected]
Received: 8 July 2018/ Accepted: 28 August 2018 / Published: 1 October 2018
In this study, cobaltosic oxide (Co3O4) was synthesized by a simple surfactant-free hydrothermal
method. The as-prepared materials were characterized by scanning electron microscope and X-ray diffraction, indicating that Co3O4 is formed by stacked hexagonal microsheets. The as-obtained
microsheet-stacked Co3O4 was drop-coated on glassy carbon electrode (GCE) to allow the fabrication
of electrochemical sensors for the detection of trace Pb2+ by square wave anodic stripping voltammetry. The proposed Co3O4/GCE sensors exhibited a linear correlation for Pb2+ concentration in
the concentration range from 0.5 to 5 μM, and the limit of detection was calculated as 1.18×10⁻⁸ M
(S/N=3). The results showed that the as-prepared Co3O4/GCE sensor had good repeatability and
sensitivity and the ability to effectively avoid the interference from Cd2+ and Hg2+. In addition, the method for the preparation of proposed sensor was simple and cost effective. Overall, this work provides a promising material for electrochemical detection of heavy metal ions in water.
Keywords: Hydrothermal; Co3O4; Square wave anodic stripping voltammetry (SWASV); Lead(II)
1. INTRODUCTION
technique to detect Pb2+. Considering electrochemical technology has the advantages of high sensitivity, real-time on-line analysis, low cost, and simple pre-treatment [1,4,17,18], a chemically modified electrode was designed for the detection of Pb2+ in water.
Cobaltosic oxide (Co3O4) with AB2O4 spinel structure is a significant magnetic p-type
semiconductor oxide [19]. Co3O4 is widely used in sensors, supercapacitors, lithium-ion batteries,
catalytic materials, and magnetic materials owing to its magnetism, diffusivity, conductivity, chemical activity, and catalysis [19–21]. A variety of methods including pyrolysis, chemical vapor deposition, pulsed laser deposition, and traditional sol-gel method have been used for preparing Co3O4 [22]. In the
charge storage process, because of the difference in the material/electrolyte interface properties and ion transfer rate, Co3O4 of different surface morphologies showed marked differences in their
electrochemical properties [23,24]. Liu synthesized Co3O4 microspheres through a simple
hydrothermal treatment [25], exhibiting good electrochemical behaviors as lithium ion anode materials. Xie successfully synthesized layered Co3O4 consisting of oriented and self-assembled
micrometer-length rectangular 2D flakes by a hydrothermal method followed by the subsequent calcination process [23]. The as-prepared Co3O4 sample provides a potential electroactive material for
supercapacitor. Zhang described hierarchical Co3O4 nanoporous nanoflowers prepared via a
hydrothermal reaction followed by heat treatment [26]. The main anti-ferromagnetic property of Co3O4
nanoflowers was exhibited by temperature dependence curve of magnetization in zero-field-cooled, while the weak ferromagnetic characteristics of Co3O4 nanoflowers can be shown from temperature
dependence curve of magnetization in field-cooled. Wen successfully prepared rhombus-shaped Co3O4
nanorod (NR) arrays through a fluorine-mediated hydrothermal method [27]. The prepared Co3O4 was
used as an ethanol sensor material, exhibiting good performance for ethanol detection.
In this study, a surfactant-free simple hydrothermal method was used to obtain Co3O4 of
hexagonal structure with special morphology and uniformity in a reasonable reaction time and temperature. A highly sensitive sensor, Co3O4 modified glassy carbon electrode (GCE) abbreviated as
Co3O4/GCE, was developed to detect trace Pb2+ by square wave anodic stripping voltammetry
(SWASV). The anti-interference and repeatability of Co3O4/GCE are discussed in detail, and the
as-prepared Co3O4/GCE was applied to real water sample analysis to demonstrate its practical
application.
2. EXPERIMENTAL SECTION
2.1 Materials and Instruments
The material used in this study are as follows: Cobalt nitrate (Co(NO3)2·6H2O, Tianjin Hedong
Hongyan Reagent Factory); Urea (CO(NH2)2, Tianjin BeichenFangzheng Reagent Factory);
Ammonium fluoride (NH4F, Tianjin Dengfeng Chemical Reagent Factory); Lead nitrate (Pb(NO3)2,
The equipment used are as follows: Electrochemical workstation (CHI660E, Shanghai Chenhua Instrument Company); Three-electrode system: GCE, platinum electrode and saturated calomel electrode (SCE); Vacuum/atmosphere tubular resistance furnace 1200°C (TianjinLaiboTerui Instrument Equipment Co. Ltd.); Scanning electron microscope (JEOL Ltd.); X-ray diffractometer (Ultima IV, Dandong Haoyuan Instrument Co. Ltd.).
2.2 Synthesis of Co3O4
Co3O4 was prepared via the hydrothermal method without using any surfactant. The specific
preparation process is as follows: 2 mmol Co(NO3)2·6H2O, 8 mmol NH4F and 15 mmol CO(NH2)2
were dissolved in 40 mL of ultrapure water and stirred magnetically for 30 min at room temperature to make a homogeneous and transparent solution. Then, the mixed solution was transferred into a 50 mL Teflon-lined stainless steel autoclave. The autoclave was placed in an oven and reacted for 12 h at 110°C. After cooling down to room temperature, the pink-violet samples were collected by centrifugation. The samples were washed several times with anhydrous ethanol and ultrapure water successively and dried in a thermostatic drying oven at 80℃ for 10 h. Then, the samples were placed in a tube muffle furnace. The black Co3O4 powder was obtained by calcination at 400℃ for 3 h at a
heating rate of 1℃/min.
2.3 Preparation of Co3O4/GCE
Before modification, the GCE was polished to a glossy surface with 0.05 µm alumina powder. The polished GCE was rinsed with ultrapure water, then ultrasonically washed in absolute ethanol and ultrapure water for 3 to 5 min, and finally dried under nitrogen atmosphere. Subsequently, 5 mg Co3O4
was dispersed in 5 mL water and kept in an ultrasonic bath for 10 min to make a homogeneous suspension. 10 µL of the suspension was taken with a pipette and dropped onto the surface of GCE, and the suspension was allowed to dry at room temperature to get Co3O4/GCE.
2.4 Electrochemical Measurements
The electrochemical behavior of Co3O4/GCE was observed by SWASV. First, Pb was
deposited via the reduction of Pb2+ in supporting electrolyte with constant stirring. The parameters
such as supporting electrolyte, deposition potential, and deposition time were individually optimized through experiments. Second, the anodic stripping (reoxidation of Pb to Pb2+) was carried out in the
potential range from 1.0 to 0 V under the following conditions: increment potential, 4 mV; amplitude, 25 mV; frequency, 15 Hz vs. SCE. At last, to avoid the remaining Pb2+ of the electrode affecting the experimental results, amperometric i–t curve was used for desorption. Under continuous stirring, desorption of Co3O4/GCE was completed at a potential of 0.2 V in 270 s. All the tests were performed
3. RESULTS AND DISCUSSION
3.1 Morphology and Structure Characterization of Co3O4 Materials
The morphology and the structure of prepared Co3O4 samples were characterized by scanning
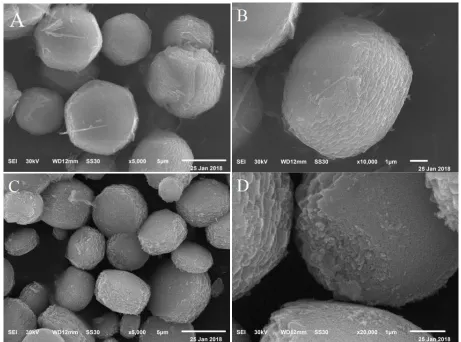
electron microscope (SEM) and X-ray diffraction (XRD), respectively. Figure 1 shows the SEM images of Co3O4. Figures 1A and Figure 1B are the images of an uncalcined precursor, which was a
[image:4.596.68.529.321.663.2]particle stacked by hexagonal microsheets with a uniform particle size of 8 μm. The flake surface was smooth and the edge was scaly, which could provide a certain adsorption site for Pb2+ [28,29]. Figures 1C and Figure 1D are the images of the calcined product. Figure 1C shows that the particle size of the calcined product was slightly smaller than the precursor. The image was magnified up to 20,000 times (Figure 1D), clearly indicating that the precursor was completely oxidized by oxygen in the air at a high temperature of 400℃. The flake surface had a foam-like mesoporous characteristic, which could improve the specific surface area of the material and provide more adsorption sites for Pb2+.
Figure 1. SEM images of Co3O4 precursors at magnifications of 5000 (A) and 10000 (B). SEM images
of Co3O4 at magnifications of 5000 (C) and 20000 (D).
From Figure 2, we could infer the possible growth process of a single Co3O4 ultrafine particle.
into irregular microsheets. Further, irregular microsheets gradually grew into regular single-layer hexagonal microsheets. Finally, the single-layer hexagonal microsheets stacked into independent microsheets. Because of small crystallite size, large specific surface area, and porosity, the prepared Co3O4 had potential applications as electrochemical sensors and thus providing active centers for the
[image:5.596.73.524.182.361.2]accumulation of metal ions.
[image:5.596.157.445.516.721.2]Figure 2. Schematic diagram of the growth process of hexagonal Co3O4 microparticles
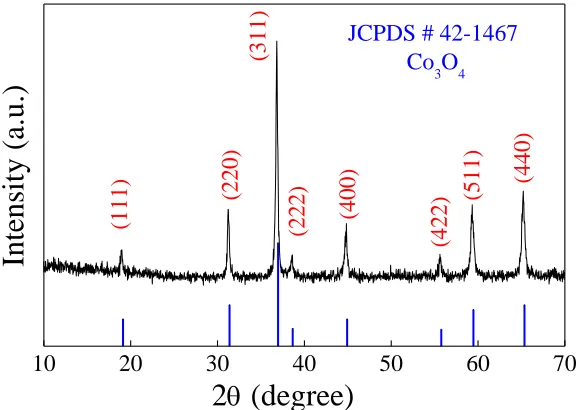
Figure 3 shows the XRD pattern of the as-prepared Co3O4, indicating good crystallinity of the
material. The diffraction peaks at the 2θ of 19°, 31.27°, 36.85°, 38.54°, 44.81°, 55.66°, 59.36° and 65.24° were consisitent with the diffractions of the crystal planes {111}, {220}, {311}, {222}, {400}, {422}, {511}, and {440} of the XRD of standard, respectively, and is in accordance with the literature values (JCPDS card No. 42-1467) [30]. These results indicated that Co3O4 has a pure spinel structure.
Figure 3. XRD pattern of the as-prepared microsheet-stacked Co3O4.
10 20 30 40 50 60 70
(440)
(511)
(422)
(400)
(222)
(311)
(220)
(111)
Intensity (a.u.)
2
(degree)
JCPDS # 42-1467
3.2 Electrochemical Characterization of Co3O4/GCE
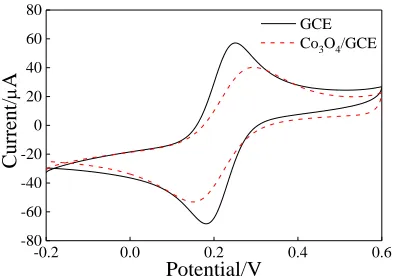
Figure 4 shows the typical cyclic voltammetry (CV) response of GCE and Co3O4/GCE.
Compared to GCE, the peak current of the oxidation and reduction peaks of Co3O4/GCE decreased.
The decrease in the peak current could be attributed to successful modification of Co3O4 on the GCE
surface. Moreover, the potential difference between the oxidation peak and the reduction peak was also larger than that of GCE, hindering the electron transfer on the electrode surface to a certain extent [29]. The peak current ratio of oxidation and reduction peak of Co3O4/GCE was close to 1, indicating that
Co3O4/GCE had a good redox potential.
-0.2 0.0 0.2 0.4 0.6
-80 -60 -40 -20 0 20 40 60 80
GCE Co3O4/GCE
Cur
ren
t/
A
Potential/V
Figure 4.Cyclic voltammograms of GCE and Co3O4/GCE in 5.0 mM [Fe(CN)6]3-/4- containing 0.1 M
KCl. The potential range of CV is from –0.2 V to 0.6 V at a scan rate of 100 mV/s.
0 1000 2000 3000 4000 5000 6000
0 1000 2000 3000 4000 5000
40 80 120 160 200 240 0
40 80 120 160
-Z"/
Z'/
GCE
Co3O4/GCE
-Z"/
Z'/
Figure 5. Electrochemical impedance plots of GCE and Co3O4/GCE in 5.0 mM [Fe(CN)6]
3-/4-containing 0.1 M KCl. The frequency range of EIS is 10 mHz–100 kHz.The amplitude is 5 mV, and the initial potential is 0.23 V.
Figure 5 shows the electrochemical impedance spectroscopy (EIS) of GCE and Co3O4/GCE.
[image:6.596.201.398.244.384.2] [image:6.596.181.403.443.608.2]process [31], where the equivalentseries resistance (ESR) can be acquired. Figure 5 shows that the ESR almost had no change, and the semi-circle part of Co3O4/GCE in the high-frequency area was
slightly larger than that of the GCE. Compared to GCE, the electron transfer resistance of [Fe(CN)6] 3-/4- was larger than that for Co
3O4/GCE. This could be attributed to the fact that Co3O4 is a
semiconductor material [27]. In contrast, it proved that the surface of GCE was successfully modified by Co3O4, and in accordance with the CV result, indicating that the Co3O4/GCE still had a good
electrochemical catalytic behavior and electron-transfer rate, which shows good capacitance characteristics.
3.3 Effect of Operational Parameters
B-R PBS HAc-NaAc
-0.9 -0.8 -0.7 -0.6 -0.5 -0.4 -0.3 -0.2
2 4 6 8 10 12 Cur ren t/ A Potential/V
Figure 6. Effect of supporting electrolyte on the peak current of Pb2+ at Co3O4/GCE. Amplitude, 25
mV; frequency, 15 Hz; quite time: 2 s.
Co3O4/GCE exhibited different electrochemical reactions in different electrolytes. In this
experiment, we studied the SWASV test of 3.5 µM Pb2+ with Co
3O4/GCE in B-R buffer solution
(pH=5.0), 0.1 M phosphate buffer solution (PBS, pH=5.8) and 0.1 M acetic acid-sodium acetate buffer solution (HAc-NaAc, pH=5.0). The test results showed that Pb2+ only responds in HAc-NaAc buffer
solution (Figure 6). Therefore, HAc-NaAc solution was selected as the substrate solution for the detection of Pb2+ using Co
3O4/GCE.
-0.9 -0.8 -0.7 -0.6 -0.5 -0.4 -0.3 -0.2 4 8 12 16 20 24 28
30 40 50 60 70 18 20 22 24 26 28 Curr ent/ A
Deposition Time /s
70s Cur ren t/ A Potential/V 30s
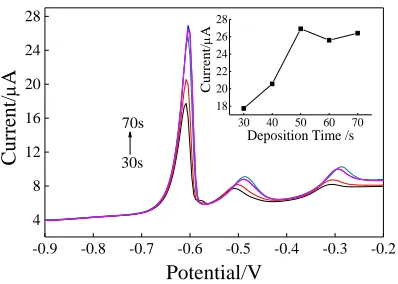
Figure 7.Effect of deposition time on the peak current of Pb2+ at Co3O4/GCE. Experimental
[image:7.596.196.400.261.402.2] [image:7.596.199.398.569.711.2]In the 0.1 M HAc-NaAc buffer solution (pH=5.0) in the presence of 3.5 µM Pb2+, the SWASV response at different deposition times (30, 40, 50, 60 and 70 s) was compared. As shown in Figure 7, when the deposition time increased from 30 s to 50 s, the peak current kept increasing and reached the maximum value. However, after 50 s, with increasing deposition time, the dissolution peak showed slight change. This could be ascribed to the saturation of the available active sites on the electrode interface [2], thus the deposition time parameter was chosen as 50 s.
-0.9 -0.8 -0.7 -0.6 -0.5 -0.4 -0.3 -0.2 4 8 12 16 20 24 28 Cur ren t/ A Potential/V -0.7V -0.8V -0.9V -1.0V -1.1V -1.2V
-1.2 -1.1 -1.0 -0.9 -0.8 -0.7 16 20 24 28 Curr ent/ A Deposition Potential/V
Figure 8. Effect of deposition potential on the peak current of Pb2+ at Co3O4/GCE. Experimental
parameters are the same as in Figure 6.
Next, in the 0.1 M HAc-NaAc buffer solution (pH=5.0) in the presence of 3.5 µM Pb2+, the effect of deposition potential on the peak current was studied in the range from0.2 to 1.0 V. The test results are shown in Figure 8, indicating that the peak current shows an upward trend from 0.7 to 1.0 V. Therefore, the more negative deposition potential could easily result in a greater analytical signal [2]. As a result of increase in hydrogen evolution, the peak current started to drop from 1.0 to 1.2 V. Thus, the deposition potential parameter was set at 1.0 V.
3.4 Standard Curve and Detection Limit
-0.9 -0.8 -0.7 -0.6 -0.5 -0.4 -0.3 -0.2 5 10 15 20 25 30 35 40
5 M
0.5 M
Cur ren t/ A Potential/V
0 1 2 3 4 5 0
10 20 30
40 Ip(A)=7.31c(M)+1.30 r2=0.997
Curr
ent/
A
[image:8.596.199.397.187.330.2]Concentration/M
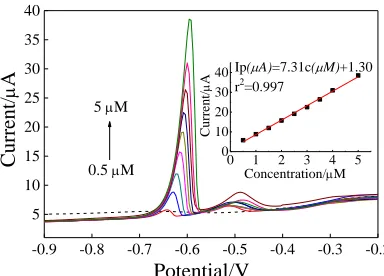
Figure 9. SWASV response toward Pb2+ on the Co3O4/GCE in the concentration range 0.5–5.0 μM by
[image:8.596.201.393.544.682.2]Under the optimized conditions, SWASV was used to determine Pb2+ on the Co
3O4/GCE.
Figure 9 shows the SWASV response of Pb2+ in the concentration range from 0.5 to 5.0 μM. The peak current increases proportionally with increasing concentration of Pb2+. The linear equation was calculated as Ip = 7.31c+1.30 (Ip in µA, c in mol/L) and the correlation coefficient was 0.997. The limit of detection (LOD, calculated by the 3σ method) and the sensitivity were 1.18×10⁻⁸ M and 7.31 μA/μM, respectively. The results show that the Co3O4/GCE had excellent sensitivity for the detection
of Pb2+. Table 1 shows a comparison of the Co
3O4/GCE and other fabricated electrodes. We noticed
that the detection limit of Co3O4/GCE was slightly smaller than Fe3O4/GCE and Mn3O4-graphitic
carbon/GCE. Furthermore, the linear range of Co3O4/GCE was larger than almost all the mentioned
electrodes. Overall, this method is of great interest, as Co3O4 can be prepared by simple hydrothermal
method without adding any surfactant, and the Co3O4/GCE has a sensitive response to Pb2+ in a wide
[image:9.596.47.562.336.563.2]detection range.
Table 1. Comparison of the Co3O4/GCE and other fabricated electrodes.
Modified electrode Method Linear range LOD Reference
MCNA-SPANB/GCE SWASV 0.005–0.08 µM 0.2 nM 17
MWNTC-Nafion/GCE DPV 0.005–0.02 µM; 1.0×10⁻⁹ M 3
0.025–5 µM Mn3O4-graphitic
carbon/GCE DPASV 0.02–0.68 µM 9.66×10
-11 M 2
Fe-MOFs/PdPtNPsD
-HP-BSA/GCE chronoamperometry 0.005–1000 nM 2 pM 1
BiFE/SPCEF SWASV 0.0005–0.5 µM 1.41×10⁻¹⁰ M 32
Fe3O4/GCE SWASV 0.1–1.8 µM 0.0595 µM 28
Co3O4/GCE SWASV 0.5–5 µM 1.18×10⁻⁸ M this work
AMCN: Mesoporous Carbon Nitride BSPAN: Self-Doped Polyaniline Nanofibers
CMWNT: Multiwalled Carbon Nanotube DNPs: Nanoparticles
EBiF: Bismuth Films
FSPCE: Screen-printed Carbon Electrode
3.5 Repeatability and Interference Studies
Under the optimized condition, 2.5 µM Pb2+ was tested 10 times on Co
3O4/GCE. The test
overlapped. The standard deviation of the peak current value in Table 2 was calculated as 1.96%, indicating that the Co3O4/GCE has a good stability.
-0.9 -0.8 -0.7 -0.6 -0.5 -0.4 -0.3 -0.2 0 5 10 15 20 25
0 2 4 6 8 10 10 15 20 25 Curr ent/ A Time/s Cur ren t/ A Potential/V RSD=1.96%
Figure 10. Repeatability measurements of 2.5µM Pb2+ on the Co3O4/GCE in 0.1 M HAc-NaAc
(pH=5.0). Inset is the repeatability of the Co3O4/GCEat ten parallel measurements forPb2+. All
other parameters are the same asin Figure 9.
In the 0.1 M HAc-NaAc buffer solution (pH=5.0), the interference to the detection of Pb2+ was also investigated with two heavy metal ions, Cd2+ and Hg2+. The test results are shown in Figure 11. After adding 4.5 μM Cd2+ and 1.5 μM Hg2+, the concentration of Pb2+ was determined by Co3O4/GCE.
It was found that the dissolution peak of Cd2+ and Hg2+ appeared at approximately 0.85 V and 0.1 V, respectively. The dissolution peak of Pb2+ shifted slightly to the right and the peak current value was almost constant, indicating that Cd2+ and Hg2+ did not interfere with the detection of Pb2+.
Table 2.The standard deviation of peak current value. Pb2+ was detected with Co3O4/GCE, and the
measurement was repeated10 times.
Time 1 2 3 4 5 6 7 8 9 10 RSD(%)
Peak current/μA 22.5 21.55 21.11 22.6 22.3 22.11 22.4 22.2 22.34 22.15 1.96%
3.6 Real Sample Analysis
-1.0 -0.8 -0.6 -0.4 -0.2 0.0 0.2
4 6 8 10
12 Hg2+
Current/ A Potential/V Pb2+ A
[image:10.596.205.391.119.253.2]-1.0 -0.9 -0.8 -0.7 -0.6 -0.5 -0.4 -0.3 -0.2 4 6 8 10 12 Cd2+ Pb2+ Current/ A Potential/V B
Figure 11.Electrochemical detection of 1.5 µM Pb2+ with Co3O4/GCE and its interference with (A) 1.5
[image:10.596.92.501.580.725.2]The spike and recovery experiment was investigated to determine the concentration of Pb2+ in local tap water samples. Since the concentration of Pb2+ was unknown in the tap water samples, the
experiment was carried out via adding known concentrations of Pb2+. As shown in Table 3, the calculated recovery rate was between 98.00% and 102.00%, revealing that Pb2+ did not exist in the tap water samples. As a result, the prepared Co3O4/GCE could serve as a practical and reliable tool for the
[image:11.596.115.479.217.276.2]detection of Pb2+.
Table 3. Recovery results for Pb2+ with modified electrodes in tap water
Sample Content (μM) Added (μM) Found (μM) Recovery(%)
1 0.50 0.50 1.01 102.00%
2 1.00 0.50 1.48 98.00%
3 1.50 0.50 1.98 98.67%
4. CONCLUSIONS
In this study, Co3O4/GCE was prepared and used to determine trace lead(II) by SWASV. The
Co3O4/GCE was able to provide larger active areas for Pb2+. The effects of supporting electrolytes,
deposition time, and deposition potential were investigated to improve the electrode sensitivity and anti-interference ability. In future, Co3O4-based hexagon microsheet-stacked structure will provide
more ways to develop new electrodes for the determination of heavy metals.
ACKNOWLEDGMENTS
This research did not receive any specific funding. NOTES
The authors declare no conflicts of interest.
References
1. Y. Yu, C. Yu, Y. Niu, J. Chen, Y. Zhao, Y. Zhang, R. Gao, J. He, Biosens. Bioelectron., 229 (2017) 297.
2. P.S. Adarakatti, V.K. Gangaiah, C.E. Banks, A. Siddaramanna, J. Mater. Sci., 53 (2018) 4961. 3. Q. Xu, N. Liu, J Zhu, Chin. J. Chem., 23 (2005) 1510.
4. J. M. Jian, Y. Y. Liu, Y. L. Zhang, X. S. Guo, Q Cai, Sens., 13 (2013) 13063. 5. T.M.D. Oliveira, J.A. Peres, M.L. Felsner, K.C. Justi, Food Chem., 29 (2017) 721. 6. W. Zhong, T. Ren, L. Zhao, J. Food Drug Anal., 24 (2016) 46.
7. H. Ciftci, M.M. Temuz, E. Ciftci, J. AOAC Int., 96 (2013) 875.
8. A. Zou, Y. Liu, M. Chen, J. Wang, Chin. J. Anal. Chem., 36 (2008) 162. 9. J. Xue, S. Gong, X. Wang, Y. Fan, X. Li, Anal. Lett., 45 (2012) 2257.
10. I. Rapp, C. Schlosser, D. Rusiecka, M. Gledhill, E.P. Achterberg, Anal. Chim. Acta, 976 (2017) 1. 11. C. Y. Tai, S. J. Jiang, A. C. Sahayam, Food Chem., 192 (2016) 274.
13. H. Lu, S. Mou, Y. Yan, S Tong, JM Riviello, J. Chromatogr. A, 800 (1998) 247.
14. R. J. Vancott, B. J. Mcdonald, A. G. Seelos,Nucl. Instrum. Methods Phys. Res., 422 (1999) 801. 15. M. G. Nejad, H Faraji, A Moghimi, Bull. Environ. Contam. Toxicol., 98 (2017) 546.
16. M. Iqbal, A. Saeed, S.I. Zafar, J. Hazard. Mater., 164 (2009) 161.
17. C. Zhang, Y. Zhou, L. Tang, G. Zeng, J. Zhang, B. Peng, X. Xie, C. Lai, B. Long, J. Zhu, Nanomaterials, 6 (2016) 7.
18. J. Lv, X. He, X. Zeng, Z. Zhang, Chin. J. Chem., 21 (2003) 687.
19. K. Pourzare, S. Farhadi, Y. Mansourpanah, ActaChim. Slov., 64 (2017) 945.
20. X. Lang, H. Fu, C. Hou, G. Han, P. Yang, Y. Liu, Q. Jiang, Nat. Commun., 4 (2013) 2169. 21. F. Liu, B. Zhang, H. Su, H. Zhang, L. Zhang, W. Yang, Nanotechnol., 27 (2016) 355603. 22. C. Shin, J. Manuel, D.S. Kim, H.S. Ryu, H.J. Ahn, J.H. Ahn, Nanoscale Res. Lett., 7 (2012) 73. 23. L. Xie, K. Li, G. Sun, Z. Hu, C. Lv, J. Wang, C. Zhang, J. Solid State Electrochem., 17 (2013) 55. 24. P. Balaya, Energy Environ. Sci., 1 (2008) 645.
25. Y. Liu, C. Mi, L. Su, X. Zhang, Electrochim. Acta, 53 (2008) 2507.
26. Y. Zhang, Y. Chen, T. Wang, J. Zhou, Y. Zhao, Microporous Mesoporous Mater., 114 (2008) 257. 27. Z. Wen, L. Zhu, W. Mei, Y. Li, L. Hu, L. Sun, W Wan, Z Ye, J. Mater. Chem. A, 1 (2013) 7511. 28. W. Li, X. Yao, Z. Guo, J. Liu, X. Huang, J. Electroanal. Chem., 749 (2015) 75.
29. K. Rechendorff, M.B. Hovgaard, M. Foss, V.P. Zhdanov, F. Besenbacher, Langmuir, 22 (2006) 10885.
30. K. Thangavelu, K. Parameswari, K. Kuppusamy, Y. Haldorai, Mater. Lett., 65 (2011) 1482. 31. Y. Sun, W. Chen, W. Li, T. Jiang, J. Liu, Z. Liu, J. Electroanal. Chem., 714-715 (2014) 97. 32. K. Tyszczuk-Rotko, K. Domańska, J. Electrochem. Soc., 164 (2017) H537.