Measurement of the
t
¯
tZ
and
t
¯
tW
cross sections in proton-proton collisions
at
p
ffiffi
s
= 13
TeV
with the ATLAS detector
M. Aaboudet al.* (ATLAS Collaboration)
(Received 14 January 2019; published 29 April 2019)
A measurement of the associated production of a top-quark pair (t¯t) with a vector boson (W, Z) in proton-proton collisions at a center-of-mass energy of 13 TeV is presented, using 36.1fb−1 of integrated luminosity collected by the ATLAS detector at the Large Hadron Collider. Events are selected in channels with two same- or opposite-sign leptons (electrons or muons), three leptons or four leptons, and each channel is further divided into multiple regions to maximize the sensitivity of the measurement. The t¯tZ and t¯tW production cross sections are simultaneously measured using a combined fit to all regions. The best-fit values of the production cross sections are σt¯tZ¼0.95 0.08stat0.10syst pb and σt¯tW¼0.870.13stat0.14syst pb in agreement with the Standard Model
predictions. The measurement of thet¯tZcross section is used to set constraints on effective field theory operators which modify the t¯tZ vertex.
DOI:10.1103/PhysRevD.99.072009
I. INTRODUCTION
Properties of the top quark have been explored by the Large Hadron Collider (LHC) and previous collider experi-ments in great detail. The production cross sections of top-quark pairs and single top top-quarks, as well as the top-top-quark mass, spin correlations andWboson helicity fractions have all been measured. Other properties of the top quark are now becoming accessible, owing to the large center-of-mass energy and luminosity at the LHC. These include its coupling to the Higgs boson and electroweak neutral-current couplings, accessed by measurements of pair-produced top quarks in association with a Higgs boson [1–4]or a photon [5–8].
Measurements of top-quark pairs in association with aZ or W boson (t¯tZ and t¯tW) provide a direct probe of the weak couplings of the top quark[9–11]. These couplings may be modified in the presence of physics beyond the Standard Model (BSM). Any deviations from the SM predictions due to BSM effects can be parametrized in a model-independent way using the framework of the Standard Model effective field theory (SMEFT) [12–14]. If no deviations are observed, measurements of thet¯tZand t¯tWproduction cross sections,σt¯tZandσt¯tW, can be used to set constraints on the weak couplings of the top quark in the
SMEFT context. Thet¯tZandt¯tWprocesses were observed by ATLAS[15,16]and CMS[17,18], with measured cross sections compatible with the SM prediction. At 13 TeV, ATLAS analyzed 3.2fb−1 of data using the same-sign dimuon, trilepton and tetralepton channels, and mea-suredσt¯tZ ¼0.90.3pb andσt¯tW ¼1.50.8pb, while CMS analyzed 35.9fb−1 and measured 0.99þ−00..1315 pb and
0.77þ−00..1618 pb, respectively.
The production of t¯tZ and t¯tW is often an important background in searches involving final states with multiple leptons and b-quarks. These processes also constitute an important background in measurements of the associated production of the Higgs boson with top quarks.
This paper presents measurements of the t¯tZ and t¯tW cross sections using proton-proton (pp) collision data at a center-of mass energypffiffiffis¼13TeV corresponding to an integrated luminosity of36.1fb−1, collected by the ATLAS detector in 2015 and 2016. The final states of top-quark pairs produced in association with aZor aWboson contain up to four isolated, prompt leptons.1In this analysis, events with two opposite-sign (OS) or same-sign (SS) leptons, three leptons or four leptons are considered. The dominant backgrounds in these four channels are Zþjets and t¯t, events with nonprompt or misidentified leptons,WZ, and ZZ production, respectively. An interpretation of the t¯tZ cross-section measurement in the SMEFT framework is also performed.
*Full author list given at the end of the article.
Published by the American Physical Society under the terms of
the Creative Commons Attribution 4.0 International license.
Further distribution of this work must maintain attribution to the author(s) and the published article’s title, journal citation, and DOI. Funded by SCOAP3.
1In this paper, lepton is used to denote electron or muon, and
II. THE ATLAS DETECTOR
The ATLAS detector [19] consists of three main sub-systems: an inner tracking system, electromagnetic (EM) and hadronic calorimeters, and a muon spectrometer (MS). The inner detector (ID) consists of a high-granularity silicon pixel detector, including the insertable B-layer [20,21], which is the innermost layer of the tracking system, and a silicon microstrip tracker, together providing precision tracking in the pseudorapidity2 range jηj<2.5, followed by a transition radiation tracker covering
jηj<2.0. All these systems are immersed in a 2 T magnetic field provided by a thin superconducting solenoid. The EM sampling calorimeter uses lead and liquid argon (LAr) and is divided into barrel (jηj<1.475) and end cap (1.375<
jηj<3.2) regions. Hadronic calorimetry is provided by a steel/scintillator-tile calorimeter, segmented into three bar-rel structures, in the range jηj<1.7, and by two copper/ LAr hadronic end cap calorimeters that cover the region
1.5<jηj<3.2. The solid angle coverage is completed with forward copper/LAr and tungsten/LAr calorimeter modules, optimized for EM and hadronic measurements, respectively, covering the region3.1<jηj<4.9. The muon spectrometer measures the deflection of muons in the range
jηj<2.7 using multiple layers of high-precision tracking chambers located in toroidal magnetic fields. The field integral of the toroids ranges between 2.0 and 6.0 Tm for most of the detector. The muon spectrometer is also instrumented with separate trigger chambers covering
jηj<2.4. A two-level trigger system [22], using custom hardware followed by a software-based trigger level, is used to reduce the event rate to an average of around 1 kHz for offline storage.
III. DATA AND SIMULATED EVENT SAMPLES
The data were collected with the ATLAS detector during 2015 and 2016 at a proton-proton (pp) collision energy of 13 TeV. The bunch spacing was 25 ns and the mean number of interactions per bunch crossing was 14 (25) in 2015 (2016). With strict data-quality requirements, the integrated luminosity considered corresponds to 36.1fb−1 [23,24].
Monte Carlo (MC) simulation samples are used to model the expected signal and background distributions in the different control, validation and signal regions described below. The heavy-flavor hadron decays involving b- and c-quarks, particularly important in this measurement, were
modeled using EVTGEN [25] v1.2.0, except for those
processes modeled using the SHERPA [26] generator, as
described below. In all samples the top-quark mass was set to 172.5 GeV, and the Higgs boson mass was set to 125 GeV. The response of the detector to stable3 particles was emulated by a dedicated simulation[27]based either fully on GEANT[28], or on a faster simulation[29]using a parametrized calorimeter response and GEANT for other detector systems. To account for additionalppinteractions from the same and nearby bunch crossings (pileup),
minimum-bias interactions generated using PYTHIA
v8.186 [30], referred to as PYTHIA 8 in the following, with the A2 [31] set of tuned MC parameters (A2 tune) were superimposed on the hard-scattering events.
Simulated events were corrected using per-event weights to describe the distribution of the average number of interactions per proton bunch crossing as observed in data. All samples were processed through the same reconstruction software as used for the data. Simulated events were corrected so that the object identification, reconstruction and trigger efficiencies, energy scales and energy resolutions match those determined from data control samples.
The associated production of a top-quark pair with one or two vector bosons was generated at next-to-leading order
(NLO) with MADGRAPH5_aMC@NLO[32](referred to in
the following as MG5_aMC) version 2.3.2 interfaced to PYTHIA8. The cross sections for thet¯tZandt¯tWprocesses at 13 TeV, computed including NLO QCD and electroweak corrections using MG5_aMC, are σt¯tZ¼0.88pb and σt¯tW ¼0.60pb with an uncertainty of ∼12% [32–34]. The uncertainty is primarily due to higher-order QCD corrections, estimated by varying the renormalization (μR) and factorization (μF) scales. The γ contribution and the Z=γ interference were included in the t¯tZ samples, with the dilepton invariant mass (mll) required to be above 5 GeV. The NNPDF2.3NLO parton distribution function
(PDF) set [35] was used in the matrix-element (ME)
computation. The A14 [36] set of tuned MC parameters (A14tune) was used together with theNNPDF2.3LOPDF set[37] in the parton shower.
The t-channel production of a single top quark in association with aZboson (tZ) was generated at leading order (LO) using MG5_aMC v2.2.3 interfaced to PYTHIA v6.427[38], referred to as PYTHIA6 in the following, with
theCTEQ6L1[39]PDF set and thePerugia2012[40]
set of tuned MC parameters at NLO in QCD. The four-flavor scheme was used in the generation, and the sample was normalized using the cross section computed at NLO in QCD using MG5_aMC.
The production of a single top quark together with aW and aZboson (tWZ) was generated with MG5_aMC v2.3.3 using the NNPDF3.0NLO PDF set [35]. The generation was performed at NLO in QCD using the five-flavor scheme. Diagrams containing a top-quark pair were
2ATLAS uses a right-handed coordinate system with its origin
at the nominal interaction point (IP) in the center of the detector and thezaxis along the beam pipe. Thexaxis points from the IP to the center of the LHC ring, and the y axis points upward. Cylindrical coordinatesðr;ϕÞare used in the transverse plane,ϕ being the azimuthal angle around thezaxis. The pseudorapidity
removed to avoid overlap with thet¯tZprocess. The parton shower was modeled by PYTHIA8 with theA14tune. The sample was normalized using the NLO cross section obtained from the generator.
Events containingZorWbosons with associated jets were simulated using the SHERPA 2.2.1 event generator. The matrix-element calculation was performed using COMIX [41] and OPENLOOPS [42] for up to two partons at NLO and four partons at LO, and merged with the SHERPA
parton shower [43] according to the ME+PS@NLO
pre-scription[44]. TheNNPDF3.0NNLOPDF set was used in conjunction with dedicated parton-shower tuning developed
by the SHERPA authors. The Z=Wþjets samples were
normalized to next-to-next-to-leading-order (NNLO) QCD cross sections forZ=Wproduction calculated by the FEWZ program[45].
Diboson processes with four charged leptons (4l), three charged leptons and one neutrino (lllν) or two charged leptons and two neutrinos (llνν) were simulated using the SHERPA2.1.1 generator. The matrix elements included all diagrams with four electroweak vertices. They were calcu-lated including up to three partons at LO, and the CT10 PDF set [46] was used in conjunction with a dedicated parton-shower tune developed by the SHERPAauthors. The invariant mass of any two opposite-sign, same-flavor (OSSF) leptons was required to be greater than 5 GeV in the generated events.
The production of three massive vector bosons with subsequent leptonic decays of all three bosons was mod-eled at LO with the SHERPA2.1.1 generator and theCT10 PDF set. Up to two additional partons were included in the matrix element at LO and the full NLO accuracy was used for the inclusive process.
Electroweak processes involving the vector-boson scattering (VBS) diagram and producing two same-sign leptons, two neutrinos and two partons were modeled
using SHERPA 2.1.1 at LO accuracy and the CT10 PDF
set. Processes of orders four and six in the electroweak coupling constant were considered, and up to one addi-tional parton was included in the matrix element. Other VBS processes are found to be negligible in the analysis regions considered.
The POWHEG-BOX [47–50] v2 generator with the
NNPDF3.0NLO PDF set was used for the generation of t¯tevents. The parton shower and the underlying event were simulated using PYTHIA8 with theNNPDF2.3LOPDF set and the corresponding A14 tune. The hdamp parameter, which controls the transverse momentum of the first gluon emission beyond the Born configuration, was set to 1.5 times the top-quark mass. Thet¯tsamples were normalized to the NNLO cross-section predictions, including soft-gluon resummation to next-to-next-to-leading-logarithm order, as calculated with the Top++2.0[51] program.
Electroweak s-channel and t-channel single-top-quark events, and Wt final states, were generated with
POWHEG-BOX v1, and the parton shower modeled by
PYTHIAv6.428. TheCT10PDF set was used fors-channel production andWt events, while fort-channel production the four-flavor scheme was used for the NLO matrix element calculations together with the fixed four-flavor
PDF set CT10f4. Diagram removal was employed to
remove the overlap betweent¯tandWtproduction[52]. The single-top-quark samples were normalized to the cross sections computed at NLO reported in Refs.[53,54]for the s- andt-channels and at NLO with next-to-next-to-leading-logarithm soft-gluon corrections forWt production[55].
Samples of t¯t events produced in association with a Higgs boson (t¯tH) were generated using NLO matrix
elements in MG5_aMC with the NNPDF3.0NLO PDF
set and interfaced to PYTHIA 8 for the modeling of the parton shower. Higgs boson production via gluon-gluon fusion (ggF) and vector-boson fusion (VBF) was generated using the POWHEG-BOXv2 generator with theCT10PDF set. The parton shower and underlying event were
simulated using PYTHIA 8 with the CTEQ6L1 PDF set
and AZNLO tune. Higgs boson production with a vector
boson was generated at LO using PYTHIA 8 with
the NNPDF2.3LO PDF. All Higgs boson samples were
normalized using theoretical calculations presented in Ref.[34].
The SM production of three and four top quarks
was generated at LO with MG5_aMC+PYTHIA 8, using
theA14tune together with theNNPDF2.3LOPDF set. The samples were normalized using cross sections computed at NLO[56,57].
The events with a Z or W boson in association with a photon were simulated with up to three partons at LO using
SHERPA 2.1.1 (MEþPS mode) and the CT10 PDF set.
They were normalized to the LO cross section obtained from the generator. The t¯tγ process was generated at LO
with MG5_aMC+PYTHIA 8, using the A14 tune together
with the NNPDF2.3LO PDF set and normalized to the
NLO cross section. Events in thet¯tsample with radiated photons of high transverse momentum were vetoed to avoid overlap with those from thet¯tγ sample.
IV. OBJECT RECONSTRUCTION
Electron candidates [58] are reconstructed from
energy deposits (clusters) in the EM calorimeter that are associated with reconstructed tracks in the ID. Electrons are required to pass the “medium” likelihood identification requirements described in Ref. [58]. In the SS dilepton channel, the“tight”likelihood requirement is used instead. The electrons are also required to have transverse momen-tumpT>7GeV andjηclusterj<2.47, where ηcluster is the pseudorapidity of the calorimeter energy deposit associated with the electron candidate. Candidates in the EM calo-rimeter barrel/end cap transition region 1.37<jηclusterj<
Muon candidates are reconstructed from a fit to track segments in the various layers of the muon spectrometer, matched with tracks identified in the inner detector. Muons are required to have pT>7GeV and jηj<2.5 and to pass the medium identification requirements defined in Ref. [59]. The medium criteria include requirements on the numbers of hits in the ID and MS as well as a compatibility requirement between momentum measure-ments in the ID and MS. They provide a high efficiency and purity of selected muons. Electron candidates sharing a track with a muon candidate are removed.
To reduce the background due to nonprompt leptons from hadron decays, photon conversions or jets misidenti-fied as leptons (labeled as “fake leptons” throughout this paper), electron and muon candidates are required to be isolated. In the OS dilepton and the tetralepton channels, as well as in those trilepton regions that target the t¯tZ process, the total sum of the track transverse momenta in a surrounding cone of sizeΔRη≡
ffiffiffiffiffiffiffiffiffiffiffiffiffiffiffiffiffiffiffiffiffiffiffiffiffiffiffiffiffiffi
ðΔηÞ2þ ðΔϕÞ2
p
¼
minð10GeV=pT; re;μÞ, excluding the track of the candi-date, is required to be less than 6% of the candidate pT, where re¼0.2 andrμ¼0.3. In addition, the sum of the cluster transverse energies in the calorimeter within a cone of size ΔRη¼0.2around any electron candidate, exclud-ing energy deposits of the candidate itself, is required to be less than 6% of the candidatepT.
In the SS dilepton channel and those trilepton regions targeting the t¯tW process, where the fake-lepton back-ground is particularly important, tighter isolation require-ments are imposed on candidate leptons. A multivariate discriminant is built to distinguish prompt leptons from leptons arising from heavy-hadron decays inside jets [1]. The discriminant uses information from charged-particle tracks in a cone around the lepton candidate. Jets are reconstructed from these tracks to obtain a track jet, and the discriminant is constructed from information such as the angular distance between the lepton and the track jet, the number of tracks in the track jet and the ratio of the lepton candidatepTto the track-jetpT. The rejection factor obtained for leptons from b-hadron decays is about 20, while the prompt-lepton efficiency is about 85% (80%) for pT∼20GeV and reaches a plateau of ∼98% (96%) for muons (electrons) at high pT. Simulated events are cor-rected to account for differences in the prompt-lepton tagging discriminant between data and simulation.
Another important background in the SS dilepton channel arises from electrons with misidentified charge. To suppress this background, another multivariate dis-criminant is used, which takes as inputs various track and cluster properties of the electron candidates [1]. The discriminant provides a 95% efficiency for electrons with correct charge reconstruction while achieving a rejection factor of ∼17 for electrons with misidentified charge that pass the tight likelihood identification requirement. Correction factors are applied to selected electrons to match
the efficiency of the discriminant in simulation to that measured in data.
For both the electrons and muons, the longitudinal impact parameter of the associated track relative to the primary vertex,4z0, is required to satisfyjz0sinθj<0.5mm. The significance of the transverse impact parameter d0 is required to satisfy jd0j=σðd0Þ<5 for electrons and
jd0j=σðd0Þ<3 for muons, whereσðd0Þis the uncertainty ind0.
Jets are reconstructed using the anti-ktalgorithm[60,61] with radius parameter R¼0.4, starting from topological energy clusters in the calorimeters [62]. The effect of pileup on jet energies is accounted for by a jet-area-based correction [63] and the energy resolution of the jets is improved by using global sequential corrections[64]. Jets are calibrated to the hadronic energy scale using energy-and pseudorapidity-dependent calibration factors derived from data. Jets are accepted if they fulfill the requirements pT>25GeV and jηj<2.5. To reduce the contribution from jets associated with pileup, jets with pT<60GeV andjηj<2.4are required to satisfy pileup rejection criteria (JVT), based on a multivariate combination of track-based variables[65].
Jets are tagged as likely to containb-hadrons (b-tagged) with a multivariate discriminant making use of the long lifetime, large decay multiplicity, hard fragmentation and high mass ofb-hadrons[66]. For the working point used in this analysis, the average efficiency for correctly tagging a b-jet is approximately 77%, as determined in simulatedt¯t events. In simulation, the tagging algorithm gives a rejection factor of 134 against light-quark and gluon jets, and 6.2 against charm-quark jets. Theb-tagging efficiency and mistagging rates in simulation are corrected to repro-duce those in data[66].
The missing transverse momentum pmiss
T , with magni-tude Emiss
T , is a measure of the transverse momentum
imbalance due to particles escaping detection. It is com-puted[67]as the negative sum of the transverse momenta of all electrons, muons and jets and an additional soft term. The soft term is constructed from all tracks that are associated with the primary vertex but not with any lepton or jet. In this way, the EmissT is adjusted for the best calibration of the jets and the other identified objects, while maintaining pileup independence in the soft term[67,68].
To prevent double-counting of electron energy deposits as jets, the closest jet withinΔRy ¼0.2of a reconstructed electron is removed, whereΔRy≡
ffiffiffiffiffiffiffiffiffiffiffiffiffiffiffiffiffiffiffiffiffiffiffiffiffiffiffiffiffiffi
ðΔyÞ2þ ðΔϕÞ2 p
andy is the rapidity of the electron. If the nearest jet surviving the above criterion is within ΔRy ¼0.4 of an electron, the
4A primary vertex candidate is defined as a vertex with at least
electron is discarded to ensure that selected electrons are sufficiently separated from nearby jet activity. To reduce the background from muons originating from heavy-flavor particle decays inside jets, muons are removed if they are separated from the nearest jet byΔRy<0.4. However, if this jet has fewer than three associated tracks, the muon is kept and the jet is removed instead; this ensures that high-energy muons undergoing significant high-energy loss in the calorimeter are retained.
V. EVENT SELECTION AND BACKGROUND ESTIMATION
TableIlists the analysis channels and the targeted decay modes of the t¯tZ and t¯tW processes. Each channel is divided into multiple analysis regions in order to enhance the sensitivity to the signal. Simultaneous fits to the signal regions and dedicated control regions are performed to extract the cross sections for t¯tZandt¯tW production.
Only events collected using electron or single-muon triggers are accepted. Events are required to have at least one reconstructed primary vertex. In all regions considered, at least one reconstructed lepton with pT>
27GeV is required to match (ΔRη<0.15) a lepton with the same flavor reconstructed by the trigger algorithm. Four channels are defined: same-sign dilepton, opposite-sign dilepton, trilepton and tetralepton.
The shapes of background distributions containing prompt leptons are modeled by simulation. The normal-izations for the WZ and ZZ processes, as well as the production of aZ boson in association with heavy-flavor (HF) jets, are taken from data control regions as defined in this section and which are included in the fit discussed in Sec. VII. The yields in these data control regions are extrapolated to the signal regions using simulation. Systematic uncertainties in the extrapolation are taken into account in the overall uncertainty in the background estimate.
The contribution from events containing an electron with misidentified charge (referred to as “charge-flip” in the following) is estimated from data. The charge-flip proba-bility is extracted in events containing a pair of electrons with mll close to the Z boson mass. It is parametrized
in pT and η and is found to range from around 0.01% to 2%, increasing withpTandη, for electrons passing the identification and isolation criteria applied in the SS dilepton channel. The probability is extracted by maximiz-ing a likelihood which relates the number of events in which the two electrons have the same charge to the total number of observed events. The background contribution from events other than charge-flip electrons in the same-sign region is estimated from a sideband of the mll distribution and subtracted before performing the like-lihood fit.
The charge-flip background contribution in any SS dilepton region is estimated by constructing a control region with identical requirements, but without any require-ment on the lepton charge, and applying the appropriate charge-flip probabilities.
Background sources involving one or more fake leptons are modeled using data events from dedicated regions. For the SS dilepton (2l-SS) and trilepton channels the fake-lepton background is estimated using the matrix method [69]. The matrix method makes use of events with the same selection as the region of interest, but for which the electron identification criteria are relaxed to the“loose”likelihood requirement of Ref.[58], and neither electrons nor muons are required to be isolated. These leptons are referred to as loose leptons, whereas leptons satisfying the full set of identification and isolation criteria of Sec.IVare referred to as tight leptons. The fake-lepton background in any region of interest is obtained from the aforementioned events using efficiencies for prompt and fake leptons to satisfy the tight criteria.
[image:5.612.313.560.625.716.2] [image:5.612.51.298.629.715.2]The lepton efficiencies are extracted in control regions with a likelihood fit, by using the model of the matrix method, and assuming that the number of events with two fake leptons is negligible. The control regions are defined in dilepton events, separately for events with exactly one b-tagged jet and ≥2b-tagged jets. The prompt lepton efficiencies are measured in inclusive OSSF events, while fake-lepton efficiencies are measured in events with same-sign leptons. Both the prompt and fake-lepton efficiencies are parametrized as a function of the lepton pT. The measurement of fake-lepton efficiencies is performed after subtracting the estimated contribution from charge-flip events. Contributions from processes with two prompt
TABLE I. List of t¯tW and t¯tZ decay modes and analysis channels targeting them. The symbolsbandνdenote a bottom quark or antiquark and neutrino or antineutrino, respectively, with charge conjugation implied.
Process t¯tdecay Boson decay Channel t¯tW ðlνbÞðqqb¯ Þ lν SS dilepton
ðlνbÞðl∓νbÞ lν Trilepton
t¯tZ ðqqb¯ Þðqqb¯ Þ lþl− OS dilepton
ðlνbÞðqqb¯ Þ lþl− Trilepton ðlνbÞðl∓νbÞ lþl− Tetralepton
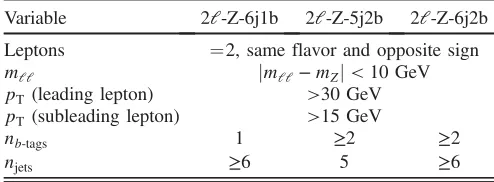
TABLE II. Summary of the event selection requirements in the OS dilepton signal regions.
Variable 2l-Z-6j1b 2l-Z-5j2b 2l-Z-6j2b
Leptons ¼2, same flavor and opposite sign
mll jmll−mZj<10GeV
pT (leading lepton) >30GeV pT (subleading lepton) >15GeV
nb-tags 1 ≥2 ≥2
same-sign leptons or one real lepton and a photon con-version (arising mainly fromt¯tγ production) are estimated from simulation and are also subtracted. The prompt and fake-lepton efficiencies are extracted separately for the regions targeting t¯tZ and those targetingt¯tW, due to the
different lepton isolation requirements applied in the two sets of regions.
In the tetralepton channel, the matrix method is not used due to the small number of events in data with four selected leptons. Instead, the contribution from
1
− −0.8 −0.6 −0.4 −0.2 0 0.2 0.4 0.6 0.8 BDT output
0 10 20 30 40 50
Events / 0.1
ATLAS ATLAS
-1
= 13 TeV, 36.1 fb s = 13 TeV, 36.1 fb-1 s
-Z-6j1b-CR
μ
e -Z-6j1b-CRμ
e
Data tt
Other Uncertainty
(a)
1
− −0.8 −0.6 −0.4 −0.2 0 0.2 0.4 0.6 0.8 BDT output
0 20 40 60 80 100 120 140 160
Events / 0.1
ATLAS ATLAS
-1
= 13 TeV, 36.1 fb s = 13 TeV, 36.1 fb-1 s
-Z-5j2b-CR
μ
e -Z-5j2b-CRμ
e
Data tt
Other Uncertainty
(b)
1
− −0.8 −0.6 −0.4 −0.2 0 0.2 0.4 0.6 0.8 BDT output
0 10 20 30 40 50 60 70 80
Events / 0.1
ATLAS ATLAS
-1
= 13 TeV, 36.1 fb s = 13 TeV, 36.1 fb-1
s
-Z-6j2b-CR
μ
e -Z-6j2b-CRμ e
Data tt
Other Uncertainty
[image:6.612.55.559.42.465.2](c)
FIG. 1. The BDT distributions for thet¯tcontrol regions (a)2l-Z-6j1b, (b)2l-Z-5j2b, (c)2l-Z-6j2b. The shaded band represents the total uncertainty. The “Other” background contains SM processes with small cross sections producing two opposite-sign prompt leptons, including thet¯tZprocess, whose contribution is negligible.
TABLE III. Summary of the event selection requirements in the SS dilepton signal regions.
Requirement 2l-SS(p,m)-1b 2e-SS(p,m)-2b eμ-SS(p,m)-2b 2μ-SS(p,m)-2b
nb-tags =1 ≥2 ≥2 ≥2
Emiss
T >40GeV >40GeV >40GeV >20GeV
HT >240 GeV
pT (leading lepton) >27GeV
pT (subleading lepton) >27GeV
njets ≥4 ≥4 ≥4 ≥2
[image:6.612.90.524.612.715.2]backgrounds containing fake leptons is estimated from simulation and corrected with scale factors determined in control regions. The contributions from events containing a photon conversion (denoted by γþX) in the SS dilepton and trilepton channels are estimated from simulation and scaled with these correction factors, obtained separately for lepton type and origin.
A. Opposite-sign dilepton analysis
The OS dilepton analysis targets thet¯tZprocess, where both top quarks decay hadronically and theZboson decays to a pair of leptons (electrons or muons). Events are required to have exactly two OSSF leptons. Events with additional isolated leptons are rejected. The invariant mass of the lepton pair is required to be in the Z boson mass window,jmll−mZj<10GeV. The leading (subleading) lepton is required to have a transverse momentum of at least 30 (15) GeV.
The OS dilepton analysis is affected by large back-grounds fromZþjets ort¯tproduction, both characterized by the presence of two leptons. In order to improve the signal-to-background ratio and constrain these back-grounds from data, three separate analysis regions are considered, depending on the number of jets (njets) and number ofb-tagged jets (nb-tags):2l-Z-5j2b,2l-Z-6j1b and
2l-Z-6j2b. The signal region requirements are summarized in Table II. In signal region 2l-Z-5j2b, exactly five jets are required, of which at least two must beb-tagged. In2l -Z-6j1b (2l-Z-6j2b), at least six jets are required with exactly one (at least two) beingb-tagged jets.
In order to separate signal from background, boosted decision trees (BDTs) are used. The BDTs are constructed
and trained separately for each region against all the contributing backgrounds, using as input 15, 14 and 17 variables for2l-Z-6j1b,2l-Z-5j2b and2l-Z-6j2b, respec-tively. Fourteen of the variables are common to the three regions. The details of the variables used are given in TableXIin the Appendix. In all three regions, the variables with the largest discriminative power are found to be
(i) theη of the dilepton system,
(ii) the scalar sum of transverse momenta of all jets divided by the sum of their energies,
(iii) the first Fox-Wolfram momentH1 [70].
Each of the signal regions is further divided into 19 equal-size bins of the BDT distribution. To avoid relying on simulation for the normalization ofZþHF jet production, theZþjets background is constrained by using events with low values of the BDT discriminant. The simulatedZþ jets background is split into three components,Zþ0HF,
Zþ1HF and Zþ2HF, depending on the number of
reconstructed jets which are matched to a generator-level b- or c-hadron (heavy-flavor, or HF jets). The normaliza-tion factors of theZþ1HF and Zþ2HF components of theZþjets background are determined from the fit to data, as described in Sec. VII, while the normalization of the Zþ0HF component is taken from simulation.
A data-driven method is used to estimate the t¯t back-ground in the OS dilepton signal regions. Control regions are defined which are identical to the signal regions, except that the requirement of two leptons with the same flavor and opposite sign is replaced by the requirement of two leptons with different flavors and opposite sign. In this manner, three regions enriched in t¯t background are obtained. The number of t¯t events in each same-flavor dilepton region is estimated from corresponding
20 40 60 80 100 120 140 160 180 200
[GeV]
ll
m 0
20 40 60 80 100 120 140 160
Events / 20 GeV
ATLAS ATLAS
-1
= 13 TeV, 36.1 fb s = 13 TeV, 36.1 fb-1 s
2e-SS-1b-VR (pre-fit) 2e-SS-1b-VR (pre-fit)
Data ttW Other γ+X Charge-flips Fake Leptons Uncertainty
(a)
30 40 50 60 70 80 90 100 110 120 [GeV]
T
Leading lepton p 0
20 40 60 80 100 120 140
Events / 10 GeV
ATLAS ATLAS
-1
= 13 TeV, 36.1 fb s = 13 TeV, 36.1 fb-1 s
2e-SS-1b-VR (pre-fit) 2e-SS-1b-VR (pre-fit)
Data ttW Other γ+X Charge-flips Fake Leptons Uncertainty
[image:7.612.58.557.467.678.2](b)
FIG. 2. Distributions in the 2e-SS-1b-VR validation region: (a) the invariant massmll of the lepton pair and (b) leading lepton
transverse momentumpT. The shaded band represents the total uncertainty. The“Other”background contains SM processes with small
opposite-flavor regions, corrected for non-t¯t backgrounds and differences in contributions from leptonic τ-lepton decays. This procedure is applied to each bin of the distribution under consideration. Figure 1 shows the BDT distributions for the t¯t control regions. Agreement between the data and the expectation is observed.
B. Same-sign dilepton analysis
The SS dilepton signal regions target the t¯tW process. Events are required to have two lepton candidates with the same sign andpT>27GeV. The scalar sum of thepTof selected leptons and jets, HT, is required to be above 240 GeV. Events containing additional loose leptons (with pT>7GeV) are vetoed. Twelve signal regions are defined
in total, categorized by the number ofb-tagged jets (one or
≥2) as well as the charge and the flavor of the selected leptons. The signal regions are denoted by2l-SSp-1b,2l -SSm-1b, 2l-SSp-2b and 2l-SSm-2b, where “p” or “m” indicates the charge of the selected leptons. Considering separate signal regions for positive and negative charges of the leptons increases the sensitivity of the analysis since t¯tW events are preferentially produced with positively
charged W bosons, while the fake-lepton background
and other processes such ast¯tZ and t¯tH are expected to be charge symmetric.
The event selection requirements in the SS dilepton regions are summarized in Table III. The presence of at least four jets and Emiss
T >40GeV is required in all signal regions except2μ-SSp-2band2μ-SSm-2b. In these
100 150 200 250 300 350 400 450 500 550 600
[GeV]
T
H 0
2 4 6 8 10 12 14 16 18
Events / 50 GeV
ATLAS ATLAS
-1 = 13 TeV, 36.1 fb s = 13 TeV, 36.1 fb-1 s
2e-SS-2b-CR (pre-fit) 2e-SS-2b-CR (pre-fit)
Data ttW Other γ+X Charge-flips Fake Leptons Uncertainty
(a)
0 20 40 60 80 100 120
[GeV]
miss T
E 0
20 40 60 80 100 120 140
Events / 20 GeV
ATLAS ATLAS
-1 = 13 TeV, 36.1 fb s = 13 TeV, 36.1 fb-1 s
-SS-1b-CR (pre-fit)
μ
e -SS-1b-CR (pre-fit)μ
e
Data ttW Other γ+X Charge-flips Fake Leptons Uncertainty
(b)
20 30 40 50 60 70 80 90 100 110 120 [GeV]
T
Subleading lepton p 1
10 2 10
3 10
Events / 20 GeV
ATLAS ATLAS
-1 = 13 TeV, 36.1 fb s = 13 TeV, 36.1 fb-1 s
-SS-1b-CR (pre-fit)
μ
2 -SS-1b-CR (pre-fit)μ 2
Data ttW
Other Charge-flips
Fake Leptons Uncertainty
[image:8.612.54.560.241.666.2](c)
FIG. 3. Distributions in fake-lepton control regions: (a) scalar sum of transverse momenta of leptons and jets,HT, in the2e-SS-2b-CR
region, (b) missing transverse momentum,Emiss
T , in theeμ-SS-1b-CR region and (c) subleading lepton transverse momentum,pT, in the
20 40 60 80 100 120 140 160 180 200 [GeV] miss T E 0 5 10 15 20 25 30
Events / 20 GeV
ATLAS ATLAS
-1 = 13 TeV, 36.1 fb s = 13 TeV, 36.1 fb-1 s
-SS (pre-fit)
μ
2 -SS (pre-fit)μ 2
Data ttW
Other Fake Leptons
Uncertainty
(a)
2 3 4 5 6 ≥7
Number of jets 0 10 20 30 40 50 Events ATLAS ATLAS -1 = 13 TeV, 36.1 fb s = 13 TeV, 36.1 fb-1 s
-SS (pre-fit)
μ
2 -SS (pre-fit)μ 2
Data ttW
Other Fake Leptons
Uncertainty
(b)
40 60 80 100 120 140 160 180 200
[GeV] miss T E 0 10 20 30 40 50 60 70
Events / 20 GeV
ATLAS ATLAS
-1 = 13 TeV, 36.1 fb s = 13 TeV, 36.1 fb-1 s
-SS (pre-fit)
μ
e -SS (pre-fit)μ e
Data ttW Other γ+X Charge-flips Fake Leptons Uncertainty
(c)
4 5 6 ≥7
Number of jets 0 20 40 60 80 100 120 140 Events ATLAS ATLAS -1 = 13 TeV, 36.1 fb s = 13 TeV, 36.1 fb-1 s
-SS (pre-fit)
μ
e -SS (pre-fit)μ e
Data ttW Other γ+X Charge-flips Fake Leptons Uncertainty
(d)
40 60 80 100 120 140 160 180 200
[GeV] miss T E 0 5 10 15 20 25 30
Events / 20 GeV
ATLAS ATLAS
-1 = 13 TeV, 36.1 fb s = 13 TeV, 36.1 fb-1 s
2e-SS (pre-fit) 2e-SS (pre-fit)
Data ttW Other γ+X Charge-flips Fake Leptons Uncertainty
(e)
4 5 6 ≥7
Number of jets 0 10 20 30 40 50 Events ATLAS ATLAS -1 = 13 TeV, 36.1 fb s = 13 TeV, 36.1 fb-1 s
2e-SS (pre-fit) 2e-SS (pre-fit)
Data ttW Other γ+X Charge-flips Fake Leptons Uncertainty
[image:9.612.65.551.43.673.2](f)
FIG. 4. Distributions in the2μ-SS,eμ-SS and2e-SS regions of (a),(c),(e) the missing transverse momentumEmiss
T and (b),(d),(f) the jet
regions, the Emiss
T requirement is loosened to EmissT >
20GeV, and at least two jets are required. In the 2eand
2μ signal regions, events containing a pair of leptons whose invariant mass is within 10 GeV of the Z boson mass are vetoed.
The control regions used to measure the fake-lepton efficiencies, as explained at the beginning of this section, are defined to be orthogonal to the SS dilepton signal regions: either the EmissT , HT or jet multiplicity require-ments of the signal regions are not satisfied. The t¯tW signal contribution in the control regions where both leptons satisfy the tight criteria is found to be
[image:10.612.85.524.65.157.2]non-negligible. To enhance the sensitivity of the analysis, the latter regions are also included in the final fit used to measure the t¯tW cross section, as discussed in Sec. VII. These six regions are further split according to the charge of the leptons, and the resulting twelve regions are denoted by 2l-SS(p,m)-ð1;2Þb-CR, following the same notation as for the signal regions defined above. In each control region, both leptons are required to have pT>27GeV, and at least one (two) jets are required in the 1b (2b) regions. In addition, events containing a pair of leptons whose invariant mass is compatible with the Z boson mass are vetoed. The largest contamination
TABLE IV. Summary of event selection requirements in the trilepton signal regions targeting thet¯tZ process.
Variable 3l-Z-1b4j 3l-Z-2b3j 3l-Z-2b4j 3l-noZ-2b4j
Leading lepton pT>27GeV
Other leptons pT>20GeV
Sum of lepton charges 1
Zrequirement (OSSF pair) jmll−mZj<10GeV jmll−mZj>10GeV
njets ≥4 3 ≥4 ≥4
[image:10.612.88.523.199.292.2]nb-tags 1 ≥2 ≥2 ≥2
TABLE V. Summary of event selection requirements in the trilepton signal regions targeting thet¯tW process.
Variable 3lp-noZ-2b2j 3lm-noZ-2b2j 3lp-noZ-1b2j 3lm-noZ-1b2j
All leptons pT>27GeV
Zveto (OSSF pair) jmll−mZj>10GeV
njets 2 or 3
HT >240GeV
Sum of lepton charges þ1 −1 þ1 −1
nb-tags ≥2 ≥2 1 1
50 100 150 200 250
[GeV]
T
Leading lepton p 0
10 20 30 40 50 60 70
Events / 20 GeV
ATLAS ATLAS
-1
= 13 TeV, 36.1 fb s = 13 TeV, 36.1 fb-1
s
3L-WZ-CR (pre-fit) 3L-WZ-CR (pre-fit)
Data ttZ
WZ ZZ
tZ tWZ
Other Fake Leptons Uncertainty
(a)
0 50 100 150 200 250 300 350 400
[GeV]
T
Leading jet p 0
10 20 30 40 50 60 70 80
Events / 40 GeV
ATLAS ATLAS
-1
= 13 TeV, 36.1 fb s = 13 TeV, 36.1 fb-1
s
3L-WZ-CR (pre-fit) 3L-WZ-CR (pre-fit)
Data ttZ
WZ ZZ
tZ tWZ
Other Fake Leptons Uncertainty
(b)
FIG. 5. Distributions of (a) the leading lepton transverse momentumpTand (b) the leading jetpTin the3l-WZ-CR control region
[image:10.612.55.559.472.677.2]from t¯tW is found to be 25%, in the region 2μ -SSp2b-CR.
The dominant background in the 2l-SS signal regions arises from events containing fake leptons. Backgrounds from the production of prompt leptons with correctly identified charge come primarily from t¯tH and WZ production. The charge-flip background is also significant in signal regions with two electrons. In regions with two muons, this background is negligible as the probability of misidentifying the charge of a muon in the relevant pT range is very small. To validate the charge-flip background, a validation region called 2e-SS-1b-VR is constructed similarly to the 2e-SS signal regions, except that the number of jets is required to be between one and three, to ensure orthogonality with the signal regions. The requirement on HT is also removed, exactly one jet is required to be b-tagged, and the invariant mass of the lepton pair is required to be greater than 15 GeV. The distributions ofmlland the leading leptonpTare shown in Fig. 2, demonstrating good modeling of the charge-flip background.
Figure 3 shows the distributions of HT, EmissT and the subleading leptonpT, for the control regions2e-SS-2b-CR, eμ-SS-1b-CR and 2μ-SS-1b-CR. The data and the expectation agree well, demonstrating the validity of the description of the fake-lepton background determined by the matrix method.
To facilitate comparisons of data with the expectation, three regions 2e-SS, eμ-SS and 2μ-SS are formed by combining all the same-sign signal regions corresponding to a given lepton flavor combination. The distributions of Emiss
T and the number of jets for these three regions are shown in Fig. 4.
C. Trilepton analysis
Eight signal regions with exactly three leptons are considered, four of them targeting thet¯tZand four targeting thet¯tWprocess, as defined in TablesIVandV, respectively. The regions are divided into two groups depending on whether or not a pair of OSSF leptons with invariant
mass within 10 GeV of the Z boson mass is present.
The signal regions are further categorized according to jet andb-tagged jet multiplicities.
The four signal regions in the first group are sensitive to t¯tZ. In the3l-Z-1b4j region, at least four jets are required, exactly one of which isb-tagged. In the3l-Z-2b3j region, exactly three jets with at least two b-tagged jets are required. In the 3l-Z-2b4j region, at least four jets are required, of which at least two areb-tagged. In the3l -noZ-2b4j region, targeting events with an off-shell Z or γ, at least four jets are required, of which at least two are b-tagged; no OSSF lepton pair is allowed in the Z boson mass window. The sum of the lepton charges must be1.
The remaining four trilepton signal regions target the t¯tW process. These regions require two or three jets and veto events that contain an OSSF pair of leptons whose invariant mass is within 10 GeV of theZboson mass. In the first two regions,3lp-noZ-2b2j and3lm-noZ-2b2j, at least two jets are required to be b-tagged. In the other two regions,3lp-noZ-1b2j and3lm-noZ-1b2j, exactly one jet is required to beb-tagged. The sum of lepton charges is required to beþ1(−1) in3lp-noZ-2b2j and3lp-noZ-1b2j (3lm-noZ-2b2j and 3lm-noZ-1b2j). In regions 3l p-noZ-1b2j and3lm-noZ-1b2j, HT>240GeV is also required. The signal region definitions for the trilepton channel are
40 60 80 100 120 140 160 180 200
[GeV]
T
Subleading lepton p 0
5 10 15 20 25 30 35 40 45
Events / 25 GeV
ATLAS ATLAS
-1
= 13 TeV, 36.1 fb s = 13 TeV, 36.1 fb-1
s
3Lp-noZ2j (pre-fit) 3Lp-noZ2j (pre-fit)
Data ttW Other γ+X Charge-flips Fake Leptons Uncertainty
(a)
0 20 40 60 80 100 120 140 160 180 200
[GeV]
miss T
E 0
5 10 15 20 25
Events / 20 GeV
ATLAS ATLAS
-1
= 13 TeV, 36.1 fb s = 13 TeV, 36.1 fb-1
s
3Lp-noZ2j (pre-fit) 3Lp-noZ2j (pre-fit)
Data ttW
Other γ+X
Fake Leptons Uncertainty
[image:11.612.58.556.458.665.2](b)
FIG. 6. Distributions of (a) the subleading lepton transverse momentumpTand (b) missing transverse momentumEmissT for events
summarized in Tables IV and V for the signal regions targeting t¯tZandt¯tW, respectively.
The dominant backgrounds in the3l-Z-1b4j,3l-Z-2b3j and3l-Z-2b4j signal regions arise from diboson produc-tion, the production of a single top quark in association
with aZboson (tZandtWZ) andZþjets production with a fake lepton.
A control region is used to determine the normalization of theWZþjets background in data. Exactly three leptons are required, at least one pair of which must be an OSSF
4 5 6 7 8 9
Number of jets 0
10 20 30 40 50
Events
ATLAS ATLAS
-1
= 13 TeV, 36.1 fb s = 13 TeV, 36.1 fb-1 s
3L-Z-2b4j (pre-fit) 3L-Z-2b4j (pre-fit)
Data ttZ
W t
t WZ
ZZ tZ
tWZ Other
Fake Leptons γ+X Uncertainty
(a)
0 50 100 150 200 250 300 350 400 (ll) [GeV]
T
p 0
5 10 15 20 25
Events / 40 GeV
ATLAS ATLAS
-1
= 13 TeV, 36.1 fb s = 13 TeV, 36.1 fb-1 s
3L-Z-2b4j (pre-fit) 3L-Z-2b4j (pre-fit)
Data ttZ W t
t WZ
tZ tWZ
Other Fake Leptons +X
γ Uncertainty
(b)
82 84 86 88 90 92 94 96 98 100
[GeV]
ll
m 0
5 10 15 20 25
Events / 1.33 GeV
ATLAS ATLAS
-1
= 13 TeV, 36.1 fb s = 13 TeV, 36.1 fb-1 s
3L-Z-2b4j (pre-fit) 3L-Z-2b4j (pre-fit)
Data ttZ
WZ tZ
tWZ Fake Leptons +X
γ Uncertainty
[image:12.612.55.557.42.465.2](c)
FIG. 7. Distributions of (a) the number of jets, (b) the transverse momentumpTðllÞand (c) the massmllof the reconstructedZboson
candidate for events in3l-Z-2b4j. The distributions are shown before the fit. The“Other”background contains SM processes with small cross sections producing three prompt leptons. The shaded band represents the total uncertainty. The last bin in each of the distributions includes the overflow.
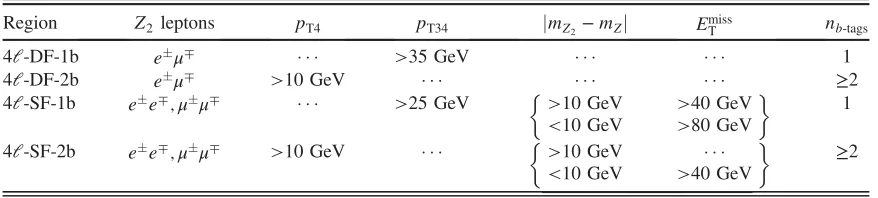
TABLE VI. Definitions of the four signal regions in the tetralepton channel.
Region Z2 leptons pT4 pT34 jmZ2−mZj EmissT nb-tags
4l-DF-1b eμ∓ >35GeV 1
4l-DF-2b eμ∓ >10GeV ≥2
4l-SF-1b ee∓;μμ∓ >25GeV >10GeV >40GeV 1 <10GeV >80GeV
[image:12.612.89.528.618.717.2]pair with an invariant mass within 10 GeV of theZboson mass. There must be exactly three jets, none of which pass theb-tagging requirement. This region is referred to as
3l-WZ-CR and it is included in the fit. Distributions comparing data with SM predictions in 3l-WZ-CR are shown in Fig.5, demonstrating good modeling of theWZ background.
Figure6shows the leading leptonpTandEmissT for events belonging to any of the four trilepton regions targetingt¯tW. Distributions of the number of jets, thepTand mass of the reconstructedZboson candidate in the signal region most sensitive to t¯tZ, 3l-Z-2b4j, are shown in Fig. 7.
D. Tetralepton analysis
The tetralepton channel targets thet¯tZ process for the
case where both W bosons, resulting from top-quark
decays, and the Z boson decay leptonically. Events with two pairs of opposite-sign leptons are selected, and at least one pair must have the same flavor. The OSSF lepton pair with reconstructed invariant mass closest tomZis attributed to theZboson decay and denoted in the following byZ1. The two remaining leptons are used to defineZ2. The signal region definitions for the tetralepton channel are summa-rized in TableVI. Four signal regions are defined according to the relative flavor of the twoZ2leptons, different flavor (DF) or same flavor (SF), and the number ofb-tagged jets: one, or at least two (1b, 2b). The signal regions are thus
4l-DF-1b,4l-DF-2b,4l-SF-1b and 4l-SF-2b. In the same-flavor regions, requirements on Emiss
T are
applied to suppress the ZZ background. In the 4l-SF-1b signal region, the Emiss
T is required to be greater than 80 GeV (40 GeV) for events with jmZ2−mZj<10GeV (jmZ2−mZj>10GeV). In the 4l-SF-2b signal region,
a requirement of Emiss
T >40GeV is applied for events withjmZ2−mZj<10GeV.
To suppress events with fake leptons in the 1-b-tag multiplicity regions, additional requirements on the scalar sum of the transverse momenta of the third and fourth leptons (pT34) are imposed. In the4l-SF-1b and4l-DF-1b regions, events are required to satisfypT34>25GeV and pT34>35GeV, respectively, while in the other regions all leptons are required to satisfypT>10GeV.
A control region used to determine the ZZ normaliza-tion, referred to as4l-ZZ-CR, is included in the fit and is defined to have exactly four reconstructed leptons, aZ2pair with OSSF leptons, the value of bothmZ1 andmZ2 within
10 GeV of the mass of theZboson, and20GeV< EmissT <
40GeV. The leading leptonpTand the jet multiplicity in this control region are shown in Fig.8, and good agreement is seen between data and prediction.
The contribution from backgrounds containing fake leptons is estimated from simulation and corrected with scale factors determined in two control regions: one region enriched in t¯t events and one region enriched in Zþjets events. The scale factors are extracted and applied sepa-rately for electron and muon fake-lepton candidates, and for leptons arising from heavy-flavor hadrons and other sources. Therefore, a total of four scale factors are determined. The scale factors are applied to all MC simulation events with fewer than four prompt leptons according to the number, flavor and origin of the fake leptons. It is verified that the scale factors for different generators used in the simulation are consistent with each other.
Figure9 compares the data with the expected distribu-tions for all four signal regions combined, showing good agreement between data and expectation.
40 60 80 100 120 140 160 180 200 220 [GeV]
T
Leading lepton p 0
20 40 60 80 100
Events / 30 GeV
ATLAS ATLAS
-1
= 13 TeV, 36.1 fb s
4L-ZZ-CR (pre-fit) 4L-ZZ-CR (pre-fit)
Data ZZ
Fake Leptons Other
Uncertainty
(a)
0 1 ≥2
Number of jets 0
20 40 60 80 100 120
Events
ATLAS ATLAS
-1
= 13 TeV, 36.1 fb s = 13 TeV, 36.1 fb-1
s
4L-ZZ-CR (pre-fit) 4L-ZZ-CR (pre-fit)
Data ZZ
Fake Leptons Other
Uncertainty
(b)
FIG. 8. Distribution of (a) the leading lepton transverse momentumpTand (b) jet multiplicity in the4l-ZZ-CR control region. The
[image:13.612.61.555.471.676.2]VI. SYSTEMATIC UNCERTAINTIES
The signal and background yields in each signal and control region may be affected by several sources of systematic uncertainty. These are implemented as nuisance parameters in the fit, explained in Sec.VII, are constrained by Gaussian probability density functions and are described in the following subsections.
A. Luminosity
The uncertainty in the integrated luminosity of the dataset is 2.1%. It is derived, following a methodology similar to that detailed in Ref.[23], and using the LUCID-2 detector for the baseline luminosity measurements [24],
from a calibration of the luminosity scale usingx-y beam-separation scans. This systematic uncertainty affects all processes modeled using Monte Carlo simulations, apart fromZþ1HF,Zþ2HF, WZandZZ, whose normaliza-tions are taken from data control regions.
B. Uncertainties associated with reconstructed objects
Uncertainties associated with the lepton selection arise from the trigger, reconstruction, identification and isolation efficiencies, and lepton momentum scale and resolution [59,71–73].
Uncertainties associated with the jet selection arise from the jet energy scale (JES), the JVT requirement and the jet
1 2 3 4 ≥5
Number of jets 0
5 10 15 20 25 30 35
Events
ATLAS ATLAS
-1
= 13 TeV, 36.1 fb s = 13 TeV, 36.1 fb-1 s
4L-comb (pre-fit) 4L-comb (pre-fit)
Data ttZ Other ZZ
tWZ Fake Leptons Uncertainty
(a)
70 75 80 85 90 95 100 105 110
[GeV]
1 Z
m 0
10 20 30 40 50
Events / 8 GeV
ATLAS ATLAS
-1
= 13 TeV, 36.1 fb s = 13 TeV, 36.1 fb-1 s
4L-comb (pre-fit) 4L-comb (pre-fit)
Data ttZ Other ZZ
tWZ Fake Leptons Uncertainty
(b)
0 0.5 1 1.5 2 2.5
)
1
(leptons from Z
η Δ
0 5 10 15 20 25 30
Events / 0.5
ATLAS ATLAS
-1
= 13 TeV, 36.1 fb s = 13 TeV, 36.1 fb-1
s
4L-comb (pre-fit) 4L-comb (pre-fit)
Data ttZ Other ZZ
tWZ Fake Leptons Uncertainty
(c)
0 0.5 1 1.5 2 2.5 3
)
2
(leptons from Z
φ Δ
0 5 10 15 20 25
Events / 0.5 rad
ATLAS ATLAS
-1
= 13 TeV, 36.1 fb s = 13 TeV, 36.1 fb-1
s
4L-comb (pre-fit) 4L-comb (pre-fit)
Data ttZ Other ZZ
tWZ Fake Leptons Uncertainty
[image:14.612.54.558.40.470.2](d)
energy resolution (JER). The JES and its uncertainty are derived by combining information from test-beam data, collision data and simulation[64]. The uncertainties in the JER and JVT have a significant effect at low jetpT.
The efficiency of the flavor-tagging algorithm is mea-sured for each jet flavor using control samples in data and in simulation. From these measurements, correction factors are derived to correct the tagging rates in the simulation. In the case ofb-jets, correction factors and their uncertainties are estimated from data using dileptonict¯t events[66]. In the case ofc-jets, they are derived using jets fromWboson decays in t¯t events [74]. In the case of light-flavor jets, correction factors are derived using dijet events [75]. Sources of uncertainty affecting the b- and c-tagging efficiencies are considered as a function of jetpT, including bin-to-bin correlations [76]. The uncertainty in the effi-ciency for tagging light-flavor jets depends on the jetpT and on η. These systematic uncertainties are taken as uncorrelated between b-jets, c-jets, and light-flavor jets. An additional uncertainty is assigned to account for the extrapolation of theb-tagging efficiency measurement from the pT region used to determine the correction factors to regions with higher transverse momentum.
The treatment of the uncertainties associated with reconstructed objects is common to all analysis channels, and thus these are considered as fully correlated among different analysis regions.
C. Uncertainties in the signal modeling
Four sources of systematic uncertainties in the theoreti-cal predictions of thet¯tZandt¯tWprocesses are considered. These signal modeling uncertainties are treated as uncorre-lated between the two processes, and correuncorre-lated among channels. Taking instead the uncertainties as correlated between the two processes has a negligible impact on the results. Acceptance effects due to the choice of scale and
PDF in the nominal MG5_aMC+PYTHIA 8 (A14 tune)
sample are considered. The renormalization and factoriza-tion scalesμR¼μFare varied simultaneously by factors 2.0 and 0.5. In addition, the effects of a set of variations in the tune parameters (A14 eigentune variations), sensitive to initial- and final-state radiation, multiple parton interactions and color reconnection, are evaluated [36]. Studies per-formed at particle level show that the largest impact comes from variations in initial-state radiation [77]. The system-atic uncertainty due to the choice of generator for thet¯tZ andt¯tWacceptance is estimated by comparing the nominal sample with one generated with SHERPAv2.2. The SHERPA sample uses the LO matrix element with up to one (two) additional parton(s) included in the matrix element calcu-lation for t¯tZ (t¯tW) and merged with the SHERPA parton
shower [43] using the ME+PS@LO prescription. The
NNPDF3.0NLO PDF set is used in conjunction with a
dedicated parton-shower tune developed by the SHERPA authors.
D. Uncertainties in the background modeling
TheZþjets process is, together witht¯tproduction, the dominant background in the OS dilepton channel. Its normalization is extracted from data as described in Sec.VA, but the shape of the BDT distribution is obtained from simulation. To assess the systematic uncertainty in the shape, the renormalization, factorization and resummation scales used in the MC generation are varied by a factor of two with respect to the nominal values.
The normalization and shape of the t¯t background in the OS dilepton channel is obtained using the data-driven method detailed in Sec. VA. A systematic uncertainty arises from the factor used to obtaint¯tbackground yields in the same-flavor signal regions from corresponding opposite-flavor dilepton control regions. The uncertainty is due to the finite size of the samples of simulated events used, and the difference between the values of the factor obtained with the nominal POWHEG-BOX+PYTHIA8 sample and an alternative sample generated using MG5_aMC+PYTHIA 8. The total uncertainty in the factor is found to be 3%.
In the trilepton regions sensitive tot¯tZ, the normalization of theWZbackground is treated as a free parameter in the fit used to extract thet¯tZandt¯tWsignals. The uncertainty in the extrapolation of theWZ background estimate from the control region to signal regions with specific jet and b-tag multiplicities is evaluated by comparing predictions obtained by varying the renormalization, factorization and resummation scales used in MC generation. The uncertainties vary from 30% to 50%, depending on the signal region.
The normalization of theZZbackground is treated as a free parameter in the fit. An additional uncertainty arises from the extrapolation from the4l-ZZ-CR control region to the signal regions. It is assessed by varying the renormalization, factorization and resummation scales used in MC generation, and found to be in the range 20%–40%. The uncertainty in the t¯tH background is evaluated by varying the factorization and renormalization scales up and down by a factor of two with respect to the nominal values. It is found to be around 10%.
An overall normalization uncertainty of 30% is assigned to the tZ background, motivated by the measurements of this process presented in Refs. [78,79]. An additional uncertainty affecting the distribution of this background as a function of jet andb-tagged jet multiplicities is evaluated by varying the factorization and renormalization scales, as
well as the amount of radiation in the Perugia2012
parton-shower tune.
For other prompt-lepton backgrounds, uncertainties of 20% are assigned to the normalizations of the WH and ZH processes, based on calculations from Ref. [34]. An uncertainty of 50% is considered for triboson and same-sign WW processes.
A 10% uncertainty is applied to the charge-flip back-ground, resulting from uncertainties in the charge-flip rates extracted from a control sample as described in Sec.V.
A 30% uncertainty is assigned to the contribution from events with two prompt leptons or one prompt lepton and a photon conversion in the control regions used to measure the fake-lepton efficiency. In the SS dilepton channel regions and trilepton regions targeting t¯tW, there are 22 nuisance parameters corresponding to the statistical uncer-tainty in the measurement of the fake-lepton efficiencies. One nuisance parameter is used for eachpTbin used in the
measurement of the fake-lepton efficiencies. For fake-lepton efficiencies in events with one (at least two)b-tagged jet(s), seven (four) bins are used, and there is one nuisance parameter for each of the two lepton flavors. In the trilepton signal regions targetingt¯tZ, where the fake-lepton background is less important, a simplified description of the fake-lepton uncertainties is used, with one nuisance parameter for each of the two lepton flavors. These nuisance parameters correspond to the maximum of the up and down shifts of the fake-lepton efficiencies resulting from statistical uncertainties and the prompt lepton background subtraction in the control regions used to measure the fake-lepton efficiency. The uncertainties in the fake-lepton background in thet¯tZand t¯tW analysis regions are considered to be uncorrelated, due to the different lepton selection requirements used in the two sets of regions.
1
− −0.8 −0.6 −0.4 −0.2 0 0.2 0.4 0.6 0.8 BDT output
0 100 200 300 400 500
Events / 0.1
ATLAS ATLAS
-1
= 13 TeV, 36.1 fb s = 13 TeV, 36.1 fb-1
s
2L-Z-6j1b (post-fit) 2L-Z-6j1b (post-fit)
Data ttZ t
t Z + 2 HF
Z + 1 HF Z + 0 HF Other Uncertainty
(a)
1
− −0.8 −0.6 −0.4 −0.2 0 0.2 0.4 0.6 0.8 BDT output
0 50 100 150 200 250 300 350 400 450
Events / 0.1
ATLAS ATLAS
-1
= 13 TeV, 36.1 fb s = 13 TeV, 36.1 fb-1
s
2L-Z-5j2b (post-fit) 2L-Z-5j2b (post-fit)
Data ttZ t
t Z + 2 HF
Z + 1 HF Z + 0 HF Other Uncertainty
(b)
1
− −0.8 −0.6 −0.4 −0.2 0 0.2 0.4 0.6 0.8 BDT output
0 20 40 60 80 100 120 140 160 180 200
Events / 0.1
ATLAS ATLAS
-1
= 13 TeV, 36.1 fb s = 13 TeV, 36.1 fb-1
s
2L-Z-6j2b (post-fit) 2L-Z-6j2b (post-fit)
Data ttZ t
t Z + 2 HF
Z + 1 HF Z + 0 HF Other Uncertainty
[image:16.612.63.558.263.675.2](c)
Uncertainties in scale factors applied to the fake-lepton background are taken into account in the fake-lepton background yield in the tetralepton channel and the t¯tγ background contribution in the trilepton and2l-SS chan-nels. These uncertainties are associated with reconstructed objects and the limited sizes of control regions in which the scale factors are obtained. The scale factors have uncertainties between 10% and 50%, depending on the fake-lepton flavor and source. The 2l-SS and trilepton fake-lepton systematic uncertainties from the matrix method are assumed to be uncorrelated with the systematic uncertainties in the fake-lepton scale factors.
VII. RESULTS
The signal strengthsμt¯tZandμt¯tW, defined as the ratios of the measured values of the inclusive production cross sections to the corresponding SM predictions discussed in Sec. III, are extracted simultaneously using a binned maximum-likelihood fit to the numbers of events in the dilepton, trilepton and tetralepton signal and control regions. In the OS dilepton channel signal regions 2l -Z-6j1b,2l-Z-5j2b and 2l-Z-6j2b, the BDT output distribu-tion is fitted. In the SS dilepton channel, the twelve signal regions2l-SSp-1b,2l-SSm-1b,2l-SSp-2band2l
-SSm-2b are fitted together with the twelve control regions
2l-SSp-1b-CR, 2l-SSm-1b-CR, 2l-SSp-2b-CR and
2l-SSm-2b-CR defined in Sec. V. The contribution from thet¯tW signal in the SS dilepton control regions is taken into account in the fit. The dependence of the fake-lepton background in these regions on thet¯tWsignal strength is also taken into account. In the trilepton channel, the eight signal regions described in Sec.Vare included in the fit, as is the3l-WZ-CR control region. Finally, in the tetralepton
channel, the four signal regions4l-DF-1b,4l-DF-2b,4l -SF-1b and4l-SF-2b and the control region4l-ZZ-CR are included in the fit.
The fit is based on the profile-likelihood technique, where systematic uncertainties are included in the fit as nuisance parameters constrained by Gaussian functions. None of the uncertainty parameters are found to be significantly constrained or pulled in the fit. The calculation of confidence intervals and hypothesis testing is performed using a modified frequentist method as implemented in RooStats[80,81].
Figure 10shows the BDT output distribution in signal regions2l-Z-6j1b,2l-Z-5j2b and2l-Z-6j2b after perform-ing the fit. Figures11and 12summarize the comparison between data and the post-fit signal and background yields for regions sensitive tot¯tZ andt¯tW production, together with the relevant control regions. In all cases, good agreement between observed values and the expectation is seen. The normalization corrections for theWZandZZ backgrounds with respect to the predictions are obtained from the fits as described in Sec. V and found to be compatible with unity:0.910.10for theWZbackground and 1.110.17 for the ZZ background. The
normaliza-tions of the Zþ1HF and Zþ2HF backgrounds are
mainly constrained in the low BDT output bins of the OS dilepton channel signal regions, where the signal contamination is low. Their values are found to be1.19
0.25 and1.090.13, respectively.
In addition to the combined fit described above, fits in individual channels are performed. Thet¯tZsignal strength is extracted through fits to the opposite-sign dilepton regions alone, to the trilepton channel regions alone and to the tetralepton channel signal regions alone. The t¯tW signal strength is extracted using the four trilepton signal
3L-Z-1b4j 3L-Z-2b4j 3L-Z-2b3j 3L-noZ-2b4j 3L-WZ-CR
0.5 1 1.5
Data / Pred.
10 2 10
3 10
Events
ATLAS ATLAS
(post-fit)
-1 = 13 TeV, 36.1 fb s
(post-fit)
-1 = 13 TeV, 36.1 fb s
(post-fit)
-1 = 13 TeV, 36.1 fb s
Data ttZ
W t
t WZ
ZZ tZ
tWZ Other
Fake Leptons γ+X Uncertainty
(a)
4L-SF-1b 4L-SF-2b 4L-DF-1b 4L-DF-2b 4L-ZZ-CR
0.5 1 1.5
Data / Pred.
1 10 2 10
3 10
Events
ATLAS ATLAS
(post-fit)
-1 = 13 TeV, 36.1 fb s
(post-fit)
-1 = 13 TeV, 36.1 fb s
(post-fit)
-1 = 13 TeV, 36.1 fb s
Data ttZ
ZZ tWZ
Other Fake Leptons Uncertainty
[image:17.612.58.555.472.664.2](b)
regions targetingt¯tW and the same-sign dilepton regions considered in the combined fit. The measured values of the signal strengthsμt¯tZ andμt¯tW are reported in TableVII for each channel separately and for the combined fit. Agreement is observed for the measured values between all the different fit configurations.
The measured signal strengths from the combined fit and their uncertainties are converted to inclusive cross-section measurements using the signal simulation described in Sec.IIIand the central values of the theoretical predictions. The results are: σt¯tZ¼0.950.08stat0.10syst pb¼
0.950.13pb and σt¯tW¼0.870.13stat0.14syst pb¼
0.870.19pb. Figure 13 shows a comparison of the fit results with theoretical predictions, σtht¯tZ ¼0.88þ−00..1109 pb and σtht¯tW¼0.60þ−00..0708 pb, demonstrating good agreement between the measured and predicted cross sections.
For thet¯tZprocess, both the observed and the expected significances are found to be much larger than five standard deviations. For thet¯tW process, an excess of events over the expected background-only hypothesis is found with an
ee-SSp-1b-CR ee-SSm-1b-CR
-SSp-1b-CR
μ
e -SSm-1b-CRμe
-SSp-1b-CR
μμ -SSm-1b-CR
μμ ee-SSp-2b-CR ee-SSm-2b-CR
-SSp-2b-CR
μ
e -SSm-2b-CRμe
-SSp-2b-CR
μμ -SSm-2b-CR
μμ -SSp-2b-SRμμ -SSm-2b-SRμμ -SSp-2b-SRμe -SSm-2b-SRμ
e ee-SSp-2b-SR ee-SSm-2b-SR 3Lp-noZ-2b2j 3Lm-noZ-2b2j
-SSp-1b-SR
μμ -SSm-1b-SR
μμ -SSp-1b-SRμe -SSm-1b-SRμ
e ee-SSp-1b-SR ee-SSm-1b-SR 3Lp-noZ-1b2j 3Lm-noZ-1b2j 0.5
1 1.5
Data / Pred.
1 10 2 10
3 10
Events
ATLAS ATLAS
(post-fit)
-1
= 13 TeV, 36.1 fb s
(post-fit)
-1
= 13 TeV, 36.1 fb s
(post-fit)
-1
= 13 TeV, 36.1 fb s
Data ttW
Z t
t WZ
Other ttH
Charge-flips γ+X
[image:18.612.131.482.43.320.2]Fake Leptons Uncertainty
[image:18.612.324.552.443.653.2]FIG. 12. Event yields in data compared with the results of the fit that extractsσt¯tZandσt¯tWsimultaneously in the regions targeting the t¯tWprocess. The“Other”background summarizes all small SM backgrounds described in Sec.III. The shaded band represents the total uncertainty.
TABLE VII. Measured signal strengths of t¯tZ and t¯tW for different fit configurations and the combined fit. The uncertain-ties include statistical and systematic components.
Fit configuration μt¯tZ μt¯tW
Combined 1.080.14 1.440.32
2l-OS 0.730.28
3lt¯tZ 1.080.18
2l-SS and3lt¯tW 1.410.33
4l 1.210.29
0.4 0.6 0.8 1 1.2 1.4 1.6
W cross section [pb] t
t 0.6
0.8 1 1.2 1.4 1.6
Z cross section [pb]tt
Best fit
68% CL
95% CL
NLO prediction
ATLAS
-1
= 13 TeV, 36.1 fb s
[image:18.612.51.300.637.716.2]