Int. J. Electrochem. Sci., 14 (2019) 5305 – 5316, doi: 10.20964/2019.06.15
International Journal of
ELECTROCHEMICAL
SCIENCE
www.electrochemsci.org
In Situ Synthesis and Electrochemical Properties of Fe/Li
2O as a
High-Capacity Cathode Prelithiation Additive for Lithium Ion
Batteries
Jusheng Zheng, Kui Liang*, Kaiyue Shi, Yechao Qiu
College of Materials Science and Engineering, Hunan University, Changsha, 410082, China
*E-mail: liangkui363@163.com
Received: 6 February 2019 / Accepted: 11 March 2019 / Published: 10 May 2019
The irreversible capacity loss in the first cycle significantly reduces the specific capacity of lithium ion batteries. Cathode prelithiation is a common method to alleviate this problem. Here, Fe/Li2O were
successfully prepared by in situ solid phase reaction method. Fe/Li2O as a cathode prelithiation additive
has a high prelithiation specific capacity of 447.3 mAh g-1 during charging, and the first charge capacity
of LiNi0.6Co0.2Mn0.2O2 with 7.5% Fe/Li2O additive could be enhanced by 9.1% and its cycling stability
was improved from 86.9% to 90.2% after 70 cycles. The cathode prelithiation additive remarkably enhanced the content of active lithium during the initial delithiation process, contributing the formation of solid electrolyte interphase on the anode surface and better cycling stability. This easy-operating cathode prelithiation method could obtain evident effect of prelithiation and had good compatibility with existing lithium ion batteries.
Keywords: Irreversible capacity loss; Fe/Li2O; In situ synthesis; Cathode prelithiation additive;
Lithium ion battery
1. INTRODUCTION
At present, lithium ion batteries are widely used in a variety of hybrid electric vehicles, grid-scale energy storage and portable electronic devices [1-5]. Commercial lithium ion batteries usually consist of two electrodes: a layered lithium transition metal oxide cathode (such as LiCoO2 and
LiNi0.6Co0.2Mn0.2O2) and a graphite anode. The irreversible capacity loss of lithium ion batteries during
prelithiation additives have gained great attention and been extensively investigated in recent decades. Anode prelithiation additives commonly include stabilized lithium metal power and lithium silicide [11– 16,23], and cathode prelithiation additives mainly include rich compounds and lithium-containing composites, such as Li3N [17,18], Li6CoO4 [19], Li5FeO4 [20-23], Metal/LiF [24] and
Metal/Li2O [25].
According to previous studies on cathode prelithiation additives, they generally possess the following characteristics. Firstly, cathode prelithiation additives have a high theoretical prelithiation capacity reaching 400 mAh g-1 or more. Secondly, the prelithiation additives release most of active
lithium ions below the maximum potential during cathode charging, but active lithium ions almost cannot be embedded back into the cathode under the minimum potential during cathode discharging. Thirdly, such prelithiation additives have prominent compatibility with the active materials, common solvents and suitable binders during the preparation processes of the existing lithium ion batteries [25]. Wenquan Lu et al. claimed that the LiNi0.5Co0.2Mn0.3O2/SiO full cell with 9.1% Li5FeO4 additive was
22% higher reversible capacity than that of the pristine LiNi0.5Co0.2Mn0.3O2 electrode and its cycling
performance was improved from 90.94% to 98.92% after 50 cycles [23]. Yi Cui et al. reported that the reversible capacity of the LiFePO4/graphite full cell with 4.8% Co/Li2O additive could be improved by
11% [25]. They claimed that the compensation effect of the active lithium is obvious, but several disadvantages exist for preparing these cathode prelithiation additives, such as the high cost of raw materials, the harshness of preparation condition and the longer sintering time.
There have been many reports about lithium-containing composites being used as cathode pre-lithiation additives, such as Metal/Li2O, Metal/LiF. The transition metal or Li2O particles in Metal/Li2O
composites must be guaranteed to be nanoscales, in order to have a prelithiated effect on electrodes. This means that the preparation of the desirable Metal/Li2O particles is quite crucial. However, according to
previous studies, it is difficult to prepare the desirable lithium-containing composites because residual reactants and intermediate phases may exist in the composite particles prepared by conversion reaction of transition metal oxides with lithium metal [24,25].
Here, Fe/Li2O were successfully prepared by in situ solid phase reaction method. The accessible
raw materials and the controllable preparation conditions contribute to the formation of desirable composite particles and sufficiently exhibit the superiority of our method. We find that the Fe/Li2O are
used as cathode prelithiation additive which have excellent compatibility with the active materials, common solvents and suitable binders during the preparation processes of the existing lithium ion batteries, and the addition of the additive to LiNi0.6Co0.2Mn0.2O2 electrode has a good prelithiated effect.
In addition, the use of this additive is not accompanied by the evolution of undesired gas in the initial deintercalation process, thus will not bring about potential safety hazard.
2. EXPERIMENTAL SECTION
2.1 Preparation of Li2CO3/C composites as precursor
Li2CO3 (Aladdin Biochemical Technology Co., Ltd., Shanghai, China) was mixed with carbon
generated mixture was loaded into 100 ml Teflon vessel containing an appropriate amount of deionized water to form the solid-liquid mixture which was then sonicated for 20 min for the purpose of forming the suspension solution, and the suspension solution was heated at 160 °C for 6 h to obtain the Li2CO3/C
composites.
2.2 Preparation of Fe/Li2O by in situ calcination
Fe/Li2O were prepared by in situ solid phase reaction in the vacuum tube furnace. The prepared
Li2CO3/C composites and FeC2O4·2H2O (Aladdin Biochemical Technology Co., Ltd., Shanghai, China)
were further mixed according to the molar ratio of lithium to iron of 3:1 and sufficiently ground. The ground mixture was then compacted and placed in the ceramics tube, and the ceramics tube was evacuated to a vacuum of about 19 Pa and heated at 850 °C for 3.5 h to obtain the Fe/Li2O.
2.3 Electrode preparation
The preparation of the LiNi0.6Co0.2Mn0.2O2 (NCM622, Changyuan Lico Co., Ltd., Hunan,
China)-Fe/Li2O cathode was implemented in an argon-filled glove box in the light of following
procedures. Fe/Li2O firstly blended with NCM622 at a weight ratio of 3:37 for 20 min to form
NCM622-Fe/Li2O which then mixed with Acetylene black and polyvinylidene fluoride (PVDF) binder in the
weight ratio of NCM622-Fe/Li2O: acetylene black: PVDF=8:1:1 in an appropriate amount of
N-methylpyrrolidone (NMP) to form a homogenous slurry. The slurry was coated on a pre-cleaned aluminum foil, and dried in a vacuum oven at 80 °C for 12 h. The cathode electrodes were stored in an argon-filled glove box before assembled into coin cells. Pristine Fe/Li2O and pristine NCM622 cathode
electrodes were prepared by the same preparation procedures as above.
2.4 Characterization
The composition and crystal structure of the Fe/Li2O sample was identified by Powder X-ray
diffraction (XRD; D8 Discover 2500, Bruker Co., Germany) with a Cu-Kα radiation. Field emission scanning electron microscopy (FE-SEM; SU8820, Hitachi Co., Japan) and transmission electron microscope (TEM; FEI Tecnai G2 F20 S-TWIX) were used to observe the morphologies of the Fe/Li2O
and NCM622-Fe/Li2O samples. X-ray photoelectron spectroscopy (XPS; K-Alpha 1063, Thermo Fisher
Scientific, United Kingdom) was performed to investigate the bonding characterization of the products converting from the pristine Fe/Li2O at the different cut-off voltage states during initial charging process.
2.5 Electrochemical measurement
The electrochemical test of the NCM622-Fe/Li2O, pristine Fe/Li2O and pristine NCM622
electrolyte. NCM622-Fe/Li2O, pristine Fe/Li2O and pristine NCM622 were used as the cathode
electrodes, respectively. Lithium metal was used as the anode electrode, and the electrolyte was 1M LiPF6 dissolved in ethylene carbonate (EC), dimethyl carbonate (DMC) and ethylene methyl carbonate
(EMC) at a volume ratio of 1:1:1. All coin-type cells were assembled in an argon-filled glove box. Cycling stability and the reversible capacity characteristics were carried out on a battery testing system (Neware CT3008, China) by recording the constant current charge-discharge curves in the voltage range of 2.7-4.3 V. The pristine Fe/Li2O was performed under a small current of 1/400 C for 10 h at the initial
phase of the first charging process in order to prevent a rapid increase of potential, and then continued to be charged and discharged between 2.7 and 4.3 V at 1/40 C (1C=798 mAh g-1) at room temperature for the sake of obtaining their first cycling curve. The electrochemical charge-discharge curves of the NCM622-Fe/Li2O and pristine NCM622 were firstly tested at a current density of 1/20 C (1C=170 mAh
g-1) for two cycles, and then the cycling stabilities were implemented at a current density of 1/5 C for 70 cycles. The cyclic voltammetry (CV) was tested on electrochemical workstation (CHI604E, China) and its curve was collected in the voltage range of 3.0-4.5 V (vs. Li/Li+) at a scan rate of 0.1 mV s-1.
[image:4.596.167.426.396.620.2]3. RESULTS AND DISCUSSION
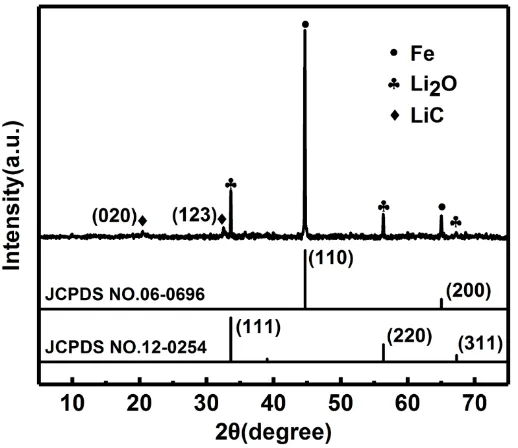
Figure 1. XRD pattern of the Fe/Li2O sample.
Fig. 1 shows that the X-ray diffraction (XRD) pattern of the Fe/Li2O sample. Diffraction peaks
can be well indexed to Fe (JCPDS No.06-0696) with body-centered-cubic (Im-3m) and Li2O (JCPDS
No.12-0254) with face-centered cubic structure (Fm-3m). It indicates that FeC2O4·2H2O and Li2CO3
were converted into Fe and Li2O by the carbothermic reduction method. The sharp diffraction peaks of
amount of LiC impurity (JCPDS No.14-0649) can be detected in the Fe/Li2O sample due to the side
reaction between a small amount of Li2O product and C. These reactions can be represented as follows:
3Li2CO3+2FeC2O4∙2H2O+5C 850℃
→ 2Fe+3Li2O+10CO↑+2CO2↑+4H2O↑ (1)
Li2O+3C850℃→ 2LiC+CO↑ (2)
SEM images of the Fe/Li2O and NCM622-Fe/Li2O samples are shown in Fig. 2. Fig. 2(a and b)
show that the Fe/Li2O powder is composed of the micro-sized secondary particles agglomerated from
the primary Fe/Li2O particles, and primary Fe/Li2O particles with spherical characteristics can contribute
to improving mutual contact of the composite particles. In Fig. 2(c and d), the NCM622-Fe/Li2O sample
composed of the spheroidal NCM622 particles and micro-sized secondary Fe/Li2O particles which are
[image:5.596.90.508.295.667.2]filled in the interstices among the spheroidal NCM622 particles.
Figure 2. SEM images of the specimens: (a), (b) Fe/Li2O; (c), (d) NCM622-Fe/Li2O.
To better observe the microstructure of the primary Fe/Li2O particles, TEM images of the
Fe/Li2O sample are shown in Fig. 3. Numerous spheroidal nanosized Fe/Li2O particles with the size of
nanoclusters dispersed in the carbon matrix. The nanocrystal regions with the darkest contrast can be related to metallic iron, while the nanoclusters with slight bright background can be referred to Li2O in
the carbon matrix, because the former (Fe) is more visible than lower atomic number element (Li) which has weak scattering of light constituent element in the bright field image during TEM image formation [26,27]. HRTEM images analysis of the dark nanoregions in the Fe/Li2O sample are shown in Fig. 3(c
and d). Lattice fringes with spacings of 0.2 and 0.27 nm of the nanoparticle can be clearly observed (Fig. 3(d)), corresponding to the (110) crystal planes of metallic iron and the (111) crystal planes of Li2O,
respectively. The results indicate that in situ formed Fe and Li2O nanoparticles are dispersed in the
composites, in consistent with the XRD result (Fig. 1). The nanosized Fe/Li2O composites ensure
intimate contact between the metallic iron and Li2O nanoparticles, hence significantly shorten the
diffusion path for both of lithium ions and electrons when such composites are used as the cathode material for lithium ion batteries [27].
Figure 3. (a), (b) the TEM images of the Fe/Li2O sample; (c), (d) HRTEM images of the dark
nanoregions in the Fe/Li2O sample.
The first charge-discharge curve of pristine Fe/Li2O between 2.7 V and 4.3 V at 1/40 C is shown
[image:6.596.86.513.287.666.2]
and its first discharge specific capacity is only 6.9 mAh g-1. The delithiation process of the Fe/Li2O is
almost completely irreversible during the first discharge, meaning that Fe/Li2O can be used as a cathode
prelithiation additive within this voltage range. Fig. 4(b) displays the first charge-discharge curves of the pristine NCM622 and NCM622-Fe/Li2O between 2.7 V and 4.3 V at 1/20 C rate, respectively. The
NCM622-Fe/Li2O delivers the first charge capacity of 231.4 mAh g-1, improving by 9.1% compared to
that of the pristine NCM622. The improvement of the charge capacity of the NCM622-Fe/Li2O can be
attributed to the capacity released by active lithium from 7.5% Fe/Li2O additive. The shape of the first
charge-discharge curves of the two samples are similar, indicating that a small amount of the Fe/Li2O
can be well compatible with the active materials of NCM622 cathode. A summary of the results of first cycle performances of different samples are provided in Table 1. First discharge capacity of the NCM622-Fe/Li2O is 173.7 mAh g-1 (based on the weight of NCM622 and Fe/Li2O), and the conversion
of NCM622-Fe/Li2O into the expected NCM622 shows a first discharge capacity of 187.2 mAh g-1 and
its coulombic efficiency is improved from 85.5% to 87.5% (based on the weight of NCM622 alone). The results indicate that Fe/Li2O prelithiation additive can contribute to improving the coulombic
efficiency of NCM622. Fig. 4(c) exhibits the charge-discharge curves of the NCM622-Fe/Li2O at 1/20
C rate for the initial three cycles. The NCM622-Fe/Li2O delivers a first charge capacity of 231.4 mAh
g-1 and the coulombic efficiency of 75.1% for the initial cycle, indicating a large irreversible capacity loss. The large irreversible capacity loss is mainly attributable to two factors. One is that the transition metal (TM) ions which have similar size to lithium ion in NCM622 active material migrate into vacancies of lithium and prevent active lithium ions from returning to original position, resulting in Li/TM cations mixing during the lithiation process [28-30]. Another is that active lithium ions of Fe/Li2O
prelithiation additive are hardly embedded back into NCM622-Fe/Li2O cathode during discharging. The
discharge capacity slowly increases for the initial three cycles and reaches 176.3 mAh g-1 in the third cycle. Due to the Fe/Li2O additive is able to significantly increase the content of active lithium during
the initial delithiation process, conducing to form stable passivated film on the anode surface and achieve stable discharge capacity in these cycles [16,25]. Fig. 4(d) shows the cyclic performance of the NCM622-Fe/Li2O and NCM622 between 2.7 V and 4.3 V at 1/5 C rate for 70 cycles. The
NCM622-Fe/Li2O delivers a first discharge specific capacity of 153.7 mAh g-1, which is slightly less than that
(163.6 mAh g-1) of NCM622, but the ratio of capacity retention is improved from 86.9% to 90.2% after 70 cycles. Because the Fe/Li2O additive releases almost all active lithium ions to compensate for the
lithium loss due to the formation of solid electrolyte interphase on the anode surface during the first charge, thereby acquiring better cycling stability [16,25]. Both of the NCM622 electrodes with and without the Fe/Li2O additive show high discharge capacity and stable cycling performance, suggesting
Figure 4. (a), (b) First discharge/charge curve of pristine Fe/Li2O at 1/40 C (1 C=798 mAh g-1),
NCM622-Fe/Li2O and pristine NCM622 at 1/20 C (1 C=170 mAh g-1). (c) 1st, 2nd and 3rd
discharge/charge curves of NCM622-Fe/Li2O at 1/20 C. (d) cycling performances of
[image:8.596.100.496.77.394.2]NCM622-Fe/Li2O and pristine NCM622 at 1/5 C.
Table 1. Summary of 1st cycle performances of different samples.
sample 1st charge
(mAh g-1) 1
st discharge
(mAh g-1) efficiency(%) Coulombic
pristine NCM622 212.1 181.4 85.5%
pristine Fe/Li2O 447.3 6.9 /
NCM622-Fe/Li2O 231.4 173.7 75.1%
NCM622 expected 213.9 187.2 87.5%
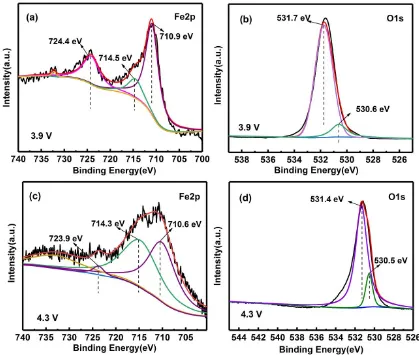
In order to better confirm the conversion products of Fe/Li2O during the initial delithiation
process. Fig. 5 Shows the XPS spectra of the pristine Fe/Li2O electrode surface under the cut-off voltage
states of 3.9 V and 4.3 V during the first constant-current charging. The Fe 2p and O 1s spectra of the electrode surface at charged to 3.9 V state are shown in Fig. 5(a and b). The Fe 2p spectrum (Fig. 5(a)) shows that the binding energies of Fe 2p3/2 and Fe 2p1/2 peaks are located at 710.9 eV and 724.4 eV, respectively. This is feature of Fe2+ and Fe3+ in Fe3O4 [31-33]. The O 1s spectrum exhibits two peaks
(Fig. 5(b)). Peak at 530.6 eV corresponds to crystal lattice oxygen bonded with iron in Fe3O4 [31,33,34],
and peak at 531.7 eV is owed to adsorbed -OH on the surface of the Fe/Li2O electrode [34]. The Fe 2p
[image:8.596.91.503.508.596.2]
shows that the dominant Fe 2p3/2 peak is located at 710.6 eV and the Fe 2p1/2 feature is situated in 723.9 eV, corresponding to the Fe3+-O bonds [32,35,36]. As shown in Fig. 5(d), O 1s spectrum displays
two peaks. Peak at 530.5 eV is well accordance with crystal lattice oxygen bonded with Fe3+ in Fe2O3
[36], and peak at 531.4 eV is attributed to adsorbed -OH on the surface of the Fe/Li2O electrode, which
is roughly in accordance with the reported result [36-38]. In addition, the Fig. 5(a and d) also clearly demonstrate that the binding energies of Fe 2p3/2 are obtained at 714.5 eV and 714.3 eV, respectively, corresponding to the Fe3+-F bonds, consistent with previous reports [39,40]. The existence of FeF3 is
mainly ascribed to the side reaction of Fe2O3 and HF, and HF is formed as the consequence of hydrolysis
[image:9.596.87.506.247.602.2]of LiPF6-based electrolyte [41,42].
Figure 5. XPS spectra of the pristine Fe/Li2O electrode surface at the different cut-off voltage states
during the first constant current charging: (a) Fe 2p and (b) O 1s of 3.9 V, Fe 2p (c) and O 1s (d) of 4.3 V.
To better exhibit the initial electrochemical delithiation-lithiation process of the pristine Fe/Li2O.
The cyclic voltammogram (CV) curve of the pristine Fe/Li2O for the first cycle at a scan rate of 0.1 mV
s-1 between 3.0 and 4.5 V (vs Li/Li+) at room temperature is shown in Fig. 6. Two distinct anodic peaks
further to Fe3O4 (Fe2+ and Fe3+) of intermediate valence, which is in accordance with the results of the
binding energies of Fe 2p3/2 and Fe 2p1/2appeared in the Fe 2p spectrum (Fig. 5(a)) and corresponds to the first two charge plateaus in Fig. 4(a). The second sharp peak stems from the thorough electrochemical oxidation reaction of Fe2+ or Fe3O4 (Fe2+ and Fe3+) to Fe3+, and corresponding to the
[image:10.596.162.430.192.413.2]third charge plateau in Fig. 4(a) and agreeing well with the result of the binding energies of Fe 2p3/2 and Fe 2p1/2 which are characterized by Fe3+ in the Fe 2p spectrum (Fig. 5(c)).
Figure 6. CV curve for the first cycle of the pristine Fe/Li2O at a scan rate of 0.1 mV s-1.
The delithiation process of the pristine Fe/Li2O can be divided roughly into two steps as follows:
2Fe+2Li2O→2FeO+4Li++4e- (1)
2FeO+Li2O→Fe2O3+2Li++2e- (2)
The electrochemical reaction mechanism of the pristine Fe/Li2O can be expressed as
2Fe+3Li2O→Fe2O3+6Li++6e-. In addition, there is no appearance of reduction peak in the CV curve,
indicating that the Fe/Li2O almost not participate in the embedded reaction of active lithium, and which
further explains that the first discharge capacity of Fe/Li2O is only reaching 6.9 mAh g-1 (Fig. 4(a)). This
means that Fe/Li2O can be used as a cathode prelithiation additive in the voltage range of 3.0 V-4.5 V.
4. CONCLUSIONS
In this paper, Fe/Li2O were successfully prepared by in situ solid phase reaction method. Fe/Li2O
can be used as a cathode prelithiation additive with a high prelithiation specific capacity of 447.3 mAh g-1 during charging, and the first charge capacity of LiNi0.6Co0.2Mn0.2O2 with 7.5% Fe/Li2O additive
delithiation process, contributing to form solid electrolyte interphase on the anode surface and better cycling stability.
Here we provide a simple, economical synthesis method to obtain the high-capacity cathode prelithiation additive for lithium ion batteries.
References
1. J.-M. Tarascon and M. Armand, Nature, 414 (2001) 359-367. 2. M. S. Whittingham, Chem. Rev., 104 (2004) 4271-4301.
3. K. Kang, Y. S. Meng, J. Breger, C. P. Grey and G. Ceder, Science, 311(2006) 977-980. 4. M. Armand and J.-M. Tarascon, Nature, 451 (2008) 652-657 (2008).
5. J. B. Goodenough and K.-S. Park, J. Am. Chem. Soc., 135 (2013) 1167-1176. 6. P. Verma, P. Maire and P. Novák, Electrochim. Acta, 55 (2010) 6332-6341.
7. K. Zaghib, G. Nadeau and K. Kinoshita, J. Electrochem. Soc., 147 (2000) 2110-2115. 8. D. Aurbach, Y. Ein-Eli, B. Markovsky, A. Zaban, S. Luski, Y. Carmeli and H. Yamin,
J.Electrochem. Soc., 142 (1995) 2882-2890.
9. Y. Matsumura, S. Wang and J. Mondori, J. Electrochem. Soc., 142 (1995) 2914-2918. 10.K. Xu, Chem. Rev., 104 (2004) 4303-4417.
11.M. W. Forney, M. J. Ganter, J. W. Staub, R. D. Ridgley and B. J. Landi, Nano Lett., 13 (2013) 4158-4163.
12.L. Ma, J. Self, M. Nie, S. Glazier, D. Y. Wang, Y.-S. Lin and J. R. Dahn, J. Power Sources, 299 (2015) 130-138.
13.J. Zhao, Z. Lu, N. Liu, H.-W. Lee, M. T. McDowell and Y. Cui, Nat. Commun., 5 (2014) 5088. 14.J. Zhao, Z. Lu, H. Wang, W. Liu, H.-W. Lee, K. Yan, D. Zhuo, D. Lin, N. Liu and Y. Cui, J. Am.
Chem. Soc.,137 (2015) 8372-8375.
15.I. W. Seong, K. T. Kim and W. Y. Yoon, J. Power Sources, 189 (2009) 511-514.
16.Z. Wang, Y. Fu, Z. Zhang, S. Yuan, K. Amine, V. Battaglia and G. Liu, J. Power Sources, 260 (2014) 57-61.
17.K. Park, B.-C. Yu and J. B. Goodenough, Adv. Energy Mater., 6 (2016) 1502534.
18.Y. Sun, Y. Li, J. Sun, Y. Li, A. Pei and Y. Cui, Energy Storage Materials, 6 (2017) 119-124. 19.M. Noh and J. Cho, J. Electrochem. Soc., 159 (2012) A1329-A1334.
20.C. S. Johnson, S.-H. Kang, J. T. Vaughey, S. V. Pol, M. Balasubramanian and M. M. Thackeray, Chem. Mater., 22 (2010) 1263-1270.
21.T. Okumura, M. Shikano and H. Kobayashi, J. Mater. Chem. A, 2 (2014) 11847-11856.
22.X. Su, C. Lin, X. Wang, V. A. Maroni, Y. Ren, C. S. Johnson and W. Lu, J. Power Sources, 324 (2016) 150-157.
23.L. Zhang, W. M. Dose, A. D. Vu and C. S. Johnson and W. Lu, J. Power Sources, 400 (2018) 549-555.
24.Y. Sun, H.-W. Lee, G. Zheng, Z. W. Seh, J. Sun, Y. Li and Y. Cui, Nano Lett., 16 (2016) 1497-1501. 25.Y. Sun, H.-W. Lee, Z. W. Seh, N. Liu, J. Sun, Y. Li and Y. Cui, Nat. Energy, 1 (2016) 15008.
26.K. Rui, Z. Wen, Y. Lu, J. Jin and C. Shen, Adv. Energy Mater., 5 (2015) 1401716.
27.X. Fan, Y. Zhu, C. Luo, T. Gao, L. Suo, S.-C. Liou, K. Xu and C. Wang, J. Power Sources, 307 (2016) 435-442.
28.S.-K. Jung, H. Gwon, J. Hong, K.-Y. Park, D.-H. Seo, H. Kim, J. Hyun, W. Yang and K. Kang, Adv. Energy Mater., 4 (2014) 1300787.
30.N. Y. Kim, T. Yim, J. H. Song, J.-S. Yu and Z. Lee, J. Power Sources, 307 (2016) 641-648. 31.J. F. Anderson, M. Kuhn and U. Diebold, Surf. Sci. Spectra, 4 (1996) 266-272.
32.N. S. McIntyre and D. G. Zetaruk, Anal. Chem., 49 (1977) 1521-1529.
33.J. Luo, J. Liu, Z. Zeng, C. F. Ng, L. Ma, H. Zhang, J. Lin, Z. Shen and H. J. Fan, Nano Lett., 13 (2013) 6136-6143.
34.X. Hu, M. Ma, M. Zeng, Y. Sun, L. Chen, Y. Xue, T. Zhang, X. Ai, R. G. Mendes, M. H. Rummeli and L. Fu, ACS Appl. Mater. Interfaces, 6 (2014) 22527-22533.
35.J. Wang, H. Zhou, J. Nanda and P. V. Braun, Chem. Mater., 27 (2015) 2803-2811.
36.D. Barreca, G. A. Battiston, D. Berto, R. Gerbasi and E. Tondello, Surf. Sci. Spectra, 8 (2001) 240-245.
37.J. F. Moulder, W. F. Stickle, P. E. Sobol and K. D. Bomben, Handbook of X-ray photoelectron spectroscopy (Ed: J. Chastain), Perkin-Elmer, Eden Prairie, MN 1992.
38.G. Bhargava, I. Gouzman, C. M. Chun, T. A. Ramanarayanan and S. L. Bernasek, Appl. Surf. Sci., 253 (2007) 4322-4329.
39.A. P. Grosvenor, B. A. Kobe, M. C. Biesinger and N. S. McIntyre, Surf. Interface Anal., 36 (2004) 1564-1574.
40.L. Li, V. Breedveld and D. W. Hess, ACS Appl. Mater. Interfaces, 4 (2012) 4549-4556.
41.D. Aurbach, A. Zaban, A. Schechter, Y. Ein-Eli, E. Zinigrad and B. Markovsky, J. Electrochem. Soc., 142 (1995) 2873-2882.