Int. J. Electrochem. Sci., 13 (2018) 8551 – 8560, doi: 10.20964/2018.09.59
International Journal of
ELECTROCHEMICAL
SCIENCE
www.electrochemsci.orgPreparation of Au@Ir/C as sensor for Methimazole Detection
Si Chen1, Jing Liu1, Mao-Jian Shi1, Ai-Xia Ling1, Mei Lv1, Yue Zeng1, Qing-Qing Li1, Tang Qin1, Fan-Dong Kong1,2,*
1
School of Pharmacy, Jining Medical University, Jining 272000, China 2
School of Chemical Engineering and Technology, Harbin Institute of Technology, Harbin 150001, China
*
E-mail: jykfd@126.com
Received: 18 May 2018 / Accepted: 10 July 2018 / Published: 5 August 2018
Au@Ir/C nanocomposite as an electroactive material for methimazole detection has been synthesized via polyol reduction method. Physical tests demonstrate that ultrafine nanoparticles of Au@Ir composite (2-4 nm) are evenly dispersed on carbon. This structure helps enhance its activity and stability. Electrochemical tests prove that Au@Ir/C has high response sensitivity to methimazole and well supports precise methimazole determination. Within a concentration range from 0.001 to 5.0 mM, methimazole concentration (c) and peak current (iP) possesses a linear correlation, and the linear regression equation is expressed as: iP=5.4775c+9.2488 (R=0.9987, P < 0.0001). Also, chronoamperometry result proves the high stability of Au@Ir/C on methimazole measurement, suggesting a superior reliability for this method.
Keywords: Methimazole; Au@Ir/C composite; Electrochemical sensor; Concentration determination
1. INTRODUCTION
Methimazole is the first choice for the treatment of hyperthyroidism for its effective inhibition on the synthesis of hormones and its significant efficacy [1-3]. In the preparation, pharmacokinetic study, and the development of methimazole dosage, methimazole concentration determination is the key technology which is concerned with the quality and the level of the drugs [4-6]. Currently, the detection methods towards methimazole are mainly spectrophotometry [7-11] and high performance liquid chromatography [12-16]. These methods have shown many disadvantages, such as tedious process, long-time test cycle, low experimental efficiency, and poor data reliability. Thus, it is necessary to establish a high-efficiency and reliable methimazole detection method to meet the needs of the drug development.
response and high sensitivity. It can act as a substitute for traditional detection method. Li’s groups [17,18] studied the preparation method of cobalt phthalocyanine-modified film electrodes and the electrochemical behavior of a methimazole on these electrodes. And an approach to methimazole determination using cyclic voltammetry technique was established. Wang’s group [19] prepared a heme-modified carbon paste electrode, which was successfully used to measure the concentration of methimazole and showed good selectivity and anti-jamming effect. They obtained the linear correlation between peak current and methimazole concentration. In these researches, electrochemical sensors displayed many successes on drug detection, but its disadvantages in practical operation are not neglected, for example, the preparation processes of the modified electrodes are tedious, and the modification material is often unstable, resulting in short working lifetime.
In this work, an Au@Ir/C composite is prepared and used as the electroactive material for methimazole detection. In order to enhance the response activity of electroactive material, a special structure of Au @ Ir/C core-shell is designed, in which Ir nanoparticles is firstly loaded on Vulcan XC-72, and then Au atoms are gradually grown on the surface of Ir nanoparticles so as to make Au fully exposed. Electrochemical technique is applied and allowed to establish a linear correlation between methimazole concentration and peak current. The expected results as initially designed have been achieved. The advantages of this method lies in: 1) high reactive response and sensitivity; 2) high stability and long lifetime; 3) simplification of processing of samples and high efficiency.
2. EXPERIMENTAL
2.1. Instruments and reagents
The main instruments used in this experiment: Microcomputer microwave chemical reactor (MCR-3, Shanghai, China); Electrochemical workstation (CHI760E, Shanghai, China). And the main reagents: Vulcan XC 72, 5 wt% Nafion solution (Dupond, USA); Chloroauric acid, Chloroiridic acid and Methimazole (Shanghai Chemical Reagent Corp., China).
2.2. Experimental method
2.2.1. Material preparation and characterization
The core-shell structured Au@Ir/C composite was prepared via microwave-assisted polyol processes (MAPP) [20]. It underwent two steps: 1) to load Ir nanoparticle on Vulcan XC-72; 2) to grow Au on Ir so as to make Au sufficiently exposed.
Au@Ir/C composite was synthesized with the same method as above except that Ir/C composite substitutes for Vulcan XC-72 support and H2AuCl4 substitutes for H2IrCl6 precursor. The components of Au@Ir/C were 5 wt% Ir, 15 wt% Au, and 80 wt% C.
For material characterization, transmission electron microscopy (TEM) images were taken on Tecnai 20U-TWIN (Netherlands) with a spatial resolution of 0.19 nm and an operating voltage of 136 KeV. X-ray diffraction (XRD) patterns were recorded using a D/max-rB X-ray diffractometer (Japan) with a Cu K radiation source and an operating voltage of 45 kV.
2.2.2. Electrode modification
Glassy carbon electrode (GCE) with a surface area of 0.07065 cm2 was treated with 0.05 m alumina. The ink of Au@Ir/C (2 mg mL-1) was prepared by mixing Au@Ir/C with ethanol in an ultrasonic bath for 30 min. Eight microliters (4 μL each time, 2 times) of the ink was loaded on the GCE and dried in N2 flow. And then 3 L of dilute Nafion solution was covered on the surface to form a Nafion film [21].
2.2.3. Electrochemical measurements on methimazole
The electrochemical measurements were carried out in a standard three-electrode electrochemical cell controlled by CHI760E electrochemical analysis instrument. RDE loaded with Au@Ir/C serves as the working electrode, Pt foil (1 cm2) as the counter electrode, and the saturated calomel electrode (SCE) as the reference electrode [21].
Meanwhile, prepare a series of methimazole solution with concentrations of 5.0, 2.0, 1.0, 0.1, 0.01, 0.001 mM with Phosphate buffer solution (PBS). The dissolved O2 in the solution was removed by bubbling N2 for 20 min before each test. For cyclic voltammetry determination, the CV curves were recorded in the potential range of -0.38-1.0 V at a scan rate of 20 mV s-1, For determination of electrochemical response to methimazole, i-t curves were recorded under the potential of 0.56 V at intervals of 600 s. For stability test, i-t curves were recorded with a period of 7200 s. Besides, the potential used in this work was converted to the standard hydrogen potential.
3. RESULTS AND DISCUSSION
3.1. Characterization of Au@Ir/C composite
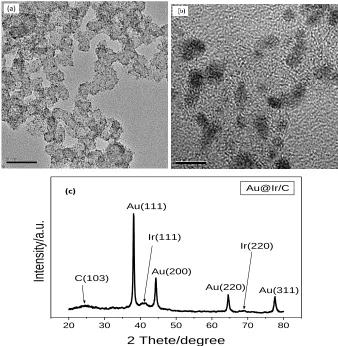
pattern of Au@Ir/C composite. The main diffraction peaks at 38.2 o, 44.4o, 64.6o, and 77.5o (2θ) in this pattern are generated by Au metal [22], and the weak diffraction peaks by trace Ir metal [23] also appear. Besides, the peak located at about 24.5o (2θ) is attributed to the carbon material [24]. According to the relevant papers, these results are consistent with their analyses and further confirm the existence of each component in the Au@Ir/C composite.
20 30 40 50 60 70 80
(c)
Au(311) Au(220)
Au(200) Au(111)
C(103)
Ir(220) Ir(111)
In
te
ns
ity
/a
.u
.
2 Thete/degree
[image:4.596.128.466.182.528.2]Au@Ir/C
Figure 1. The TEM images and the XRD pattern of Au@Ir/C composite.
3.2. Electrochemical response to methimazole
solution, these polarization peaks must be generated by methimazole sample [25,26]. By comparison the second pair of redox peaks (O2/R2) have sharper and more distinguishable images with no interference. So the oxidation peak (O2) is selected as response peak to determine the methimazole concentration.
-0.4 -0.2 0.0 0.2 0.4 0.6 0.8 1.0 1.2 -6
-4 -2 0 2 4 6 8 10
R
2
O2
R1
O1
b
a
I / m
A
E / V
methimazole/PBS PBS
Figure 2. The CV polarization curves of Au@Ir/C composite in PBS (a) and methimazole/PBS solution (b) (25oC, scan rate=20 mV s-1).
N H N
S
CH3
N N
CH3
SH
N N
CH3
S + H+ N
H N
CH3
S O
e
e -conformation change
H2O
+ H+
Step 1
Step 2
Figure 3. The oxidation mechanism of methimazole
[image:5.596.147.452.162.402.2] [image:5.596.171.422.465.645.2]
electro-oxidation of methimazole was proposed. Here we assume that the reaction process undergoes two-step mechanism (as shown in Fiure 3). At the initial state, there are two kinds of conformations with interconversion. The first-step reaction, corresponding to the O1/R1 peaks, involves the dehydrogen process on the sulfydryl group. The second-step reaction, corresponding to the O2/R2 peaks, undergoes the further oxidation of the sulfur atom.
3.3. Methimazole concentration determination and ip-c correlation
In order to establish the correlation between the peak current (ip) and the concentration of methimazole (c), a series of methimazole solution with different concentration is prepared and subjected to CV tests on Au@Ir/C active material. The test results are shown in Figure 4. It can be seen from Figure 4 that with the increase of methimazole concentration (c), the peak current (ip) values at peak O2 are gradually increased, indicating a sensitive polarization current response correlation to concentration variation. The peak currents at peak O2 for every curve are obtained and the data are listed in table 1. With these data the plot of peak current (ip) versus methimazole concentration (c) is drawn and shown in Figure 5. All the data points in Figure 5 are fitted to a straight line, which suggests that within the concentration range from 0.001 to 5.0 mM, methimazole concentration and peak current possesses a linear correlation and the detection limit is 4.6×10⁻⁴ mM. The linear regression equation is expressed as: iP=5.4775c+9.2488 (R=0.9987, P < 0.0001).
-0.4 -0.2 0.0 0.2 0.4 0.6 0.8 1.0 1.2 -30
-20 -10 0 10 20 30 40
C
u
rr
e
n
t / m
A
m
g
-1
Potential / V
5.0 mM 2.0 mM 1.0 mM 0.1 mM 0.01 mM 0.001 mM
Figure 4. Cyclic voltammetry of a series of methimazole solution (25oC, scan rate=20 mV s-1).
[image:6.596.164.426.421.623.2][image:7.596.115.470.159.450.2]
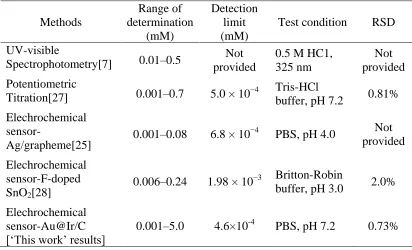
accuracy (lower test limit). The elechrochemical sensor-Au@Ir/C used in the present study also shows a superior test range among the listed methods, which is beneficial to the practical applications in drug detection.
Table 1. The correlation between concentration of methimazole and peak current
c/ mM 5.0 2.0 1.0 0.1 0.01 0.001
ip/mA 36.25 21.31 14.39 10.26 9.032 8.679
0 1 2 3 4 5
5 10 15 20 25 30 35 40
i P
/ mA
c / mM
Linear correlation between iP and c
Figure 5. The correlation between the concentration of methimazole and the peak current.
Table 2. Comparison with the related methods of methimazole determination
Methods
Range of determination
(mM)
Detection limit (mM)
Test condition RSD UV-visible
Spectrophotometry[7] 0.01–0.5
Not provided
0.5 M HC1, 325 nm
Not provided Potentiometric
Titration[27] 0.001–0.7 5.0 × 10⁻⁴ Tris-HCl buffer, pH 7.2 0.81% Elechrochemical
sensor-Ag/grapheme[25] 0.001–0.08 6.8 × 10 −4
PBS, pH 4.0 Not provided Elechrochemical
sensor-F-doped SnO2[28]
0.006–0.24 1.98 × 10⁻³ Britton-Robin
buffer, pH 3.0 2.0% Elechrochemical
sensor-Au@Ir/C [‘This work’ results]
[image:7.596.92.504.520.770.2]
3.4. Sensitivity to methimazole concentration
In order to investigate the sensitivity of Au@Ir/C active material to methimazole concentration, amperometric (i-t) technique is employed to detect the methimazole concentration alternation. Figure 6a displays sensitivity response curve which is obtained under the potential of 0.56 V in 200 ml 1.0×10⁻⁴ mM methimazole initial solution along with 0.20 ml addition of 0.01 M concentrated methimazole solution at intervals of 600 s. As comparison the amperometric curve of PBS solution is also provided (Figure 6b) [29,30]. It is obvious that the i-t curve of PBS solution shows little current response and nearly no interference to methimazole. As to methimazole curve, a step jump of polarization curves is observed and an addition of 0.01 mM methimazole brings about a sharp increase in the current value, and then followed by a gradual degradation in current intensity. The statistical data for dependence of response current on methimazole concentration alternation is shown in table 3, where it clearly confirm that each change in methimazole concentration leads to a considerablealternation in average current. It can be concluded that the active material of Au@Ir/C has a high sensitivity to the change of methimazole concentration and supports precise methimazole determination.
0 1000 2000 3000 4000 5000
0.00 0.05 0.10 0.15 0.20 0.25
> 0.0001 mM initial methimazole solution, > a addition of 0.01 mM each time
a
b
C
ur
re
nt
/
m
A
Time / s
methimazole H2O
[image:8.596.180.417.354.527.2]Figure 6. The amperometric (i-t) polarization curve of methimazole solution (25oC, potential=0.56V). Table 3. The dependence of response current on methimazole concentration alternation.
No.
Addition of concentration
(mM)
Detection concentration
(mM)
Average current
(mA)
Alternation of average current
(mA)
1 ― 0.0001 0.0163 ―
2 0.01 0.0101 0.0305 0.0142
3 0.01 0.0201 0.0505 0.0200
4 0.01 0.0301 0.0630 0.0125
5 0.01 0.0401 0.0834 0.0204
6 0.01 0.0501 0.0958 0.0124
7 0.01 0.0601 0.110 0.0142
[image:8.596.119.477.592.755.2]
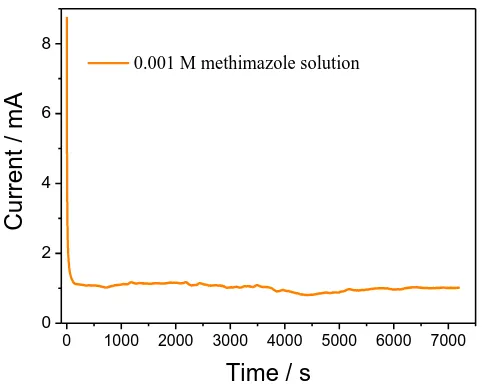
3.5. Stability test
0 1000 2000 3000 4000 5000 6000 7000
0 2 4 6 8
C
ur
re
nt
/ m
A
Time / s
0.001 M methimazole solution
Figure 7. Stability test (i-t) for methimazole solution (25oC, potential=0.56V).
Stability is an important factor in electrochemical measurement that is associated withthe long-term performance of a detection device [26,31]. For this purpose, stability measurement on methimazole was conducted under constant potential (0.56 V) for 2 h, and the result is shown in Figure 7. In this figure, a sharp degradation of the current appears at initial stage, which is resulted from the pulse current. And then it exhibits an approximately flat platform of the i-t curve along with the time, although there is a slight fluctuation in the process. It is suggested that this method possesses a high stability for the determination of methimazole, and the experimental data has a high reliability.
4. CONCLUSIONS
Au@Ir/C nanocomposite as an electroactive material for methimazole detection has been synthesized via polyol reduction method. It is revealed that ultrafine nanoparticles of Au@Ir composite (2-4 nm) are evenly dispersed on carbon. This structure helps enhance its activity and stability. Electrochemical tests prove that the active material of Au@Ir/C has high response sensitivity to methimazole and well supports precise methimazole determination. Within the concentration range from 0.001 to 5.0 mM, methimazole concentration and peak current possesses a linear correlation, and the linear regression equation is expressed as: iP=5.4775c+9.2488 (R=0.9987, P < 0.0001). Also, chronoamperometry (i-t) result has proved the high stability of Au@Ir/C on methimazole measurement, suggesting a superior reliability for this method.
ACKNOWLEDGEMENTS
[image:9.596.177.418.105.299.2]
References
1. X. Wu, H. Liu, X.X. Zhu, J. Shen, Y.Q. Shi, Z.M. Liu, M.J. Gu and Z.M. Song, Environ. Toxicol. Phar., 36 (2013) 1109.
2. H. Nakamura, J.Y. Noh, K. Itoh, S. Fukata, A. Miyauchi and N. Hamada, J. Clin. Endocr. Metab., 6 (2007) 2157.
3. W.C. Chen, Z.X. Zhu and C.H. Wang, Int. J. Gerontol., 4 (2009) 248. 4. S. Gorog, J. Pharmaceut. Biomed., 48 (2008) 247.
5. R. Bate, R. Tren, L. Mooney, K. Hess, B. Mitra, B. Debroy and A. Attaran, Plos One, 4 (2009) 6003.
6. R. Theurillat, J. Joneli, U. Wanzenried, J. Schiess, M. Hurni, T. Weber, P. Sendi and W. Thormann, J. Sep. Sci., 39 (2016) 2626.
7. C.S. Pedreñom, I. Alberom, S. García and V. Ródenas, Anal. Chim. Acta, 308 (1995) 457. 8. A. Economou, P.D Tzanavaras, M. Notou and D. GThemelis, Anal. Chim. Acta, 505 (2004) 129. 9. M.G. Bardicy, Y.S. Saharty and M.S. Tawakkol, Spectrosc. Lett., 9 (2006) 1079.
10.C.H. Dong, Y. Zhang, L. Guo and Q.M. Li, J. Anal. Chem., 65 (2010) 707. 11.M. Skowron and W. Ciesielski, J. Anal. Chem., 66 (2011) 714.
12.G.G. Skellern, B.I. Knight and J.B. Stenlake, J. Chromatogr. A, 124 (1976) 405. 13.K. Kuśmierek and E. Bald, Talanta, 71 (2007) 2121.
14.R. Zakrzewski, J. Chromatogr. B, 869 (2008) 67.
15.L. Hollosi, A. Kettrup and K.W. Schramm, J. Pharmaceut. Biomed., 36 (2004) 921.
16.H. Ebrahimzadeh, A.A. Asgharinezhad, L. Adlnasab and N. Shekari, J. Sep. Sci., 35 (2012) 2040. 17.P. Norouzi, V.K. Gupta, B. Larijani, M.R. Ganjali and F. Faridbod, Talanta, 127 (2014) 94. 18.H. Li, H.L. Pei and W. Liu. J. Phar. Anal. (China), 11 (2007) 1756.
19.Y.Z. Wang, Acad. J. Anal. (China), 9 (2009) 1018.
20.Z.Q. Xu, A.X. Ling, J. Liu, X.G. Quan, H.Y. Wang and F.D. Kong, Catal. Commun., 69 (2015) 114.
21.F.D. Kong, J. Liu, A.X. Ling, Z.Q. Xu, M.J. Shi and H.Y. Wang, Catal. Commun., 90 (2017) 19. 22.K.C. Shen, C. Jia, B.X. Cao, H. Xu, J. Wang, L.C. Zhang, K.B. Kim and W.M. Wang, Electrochim.
Acta, 256 (2017) 129.
23.E.S. Vikulova, D.B. Kalnyi, Y.V. Shubin, V.V. Kokovkin, N.B. Morozova, A. Hassan and T.V. Basova, Appl. Surf. Sci., 425 (2017) 1052.
24.B.B. Huang, P. Lu, F. Yang, Y.H. Liu and Z.L. Xie, J. Energy Chem., 26 (2017) 712.
25.K.M. AlAqad, A.M. Abulkibash, O.S.A. Hamouz and T.A. Saleh, Chem. Data Collect., 11 (2017) 168.
26.A. Kutluay and M. Aslanoglu, Sensor. Actuat. B-Chem., 171 (2012) 1216. 27.M. Aslanoglu and N. Peker, J. Pharmaceut. Biomed., 33 (2013) 1143.
28.L. Molero, M. Faundez, M. Angelica, R. Del Rio and F. Armijo, Electrochim. Acta, 88 (2013) 871. 29.M.F. Pan, G.Z. Yang, L.J. Kong, Y.K. Yang and S. Wang, Sensor. Actuat. B-Chem., 207 (2015) 588. 30.P.S. Dorraji and F. Jalali, Bioelectrochemistry, 101 (2015) 66.
31.K.N. Ghasem, K. Zeynab and D. Parisa, J. Iran. Chem. Soc., 15 (2018) 905.