A Conceptual Framework for an Integrated
Spatial Environmental Impact Assessment
based on GIS
Birgit Kruse
A Thesis Submitted in Partial Fulfilment of the
Masters of Applied Sciences (MAppSc) Program
School of Geography and Environmental Studies
University of Tasmania
July 2004
STATEMENT OF AUTHENTICITY
This thesis contains no material, which has been accepted for the award of any other higher degree or graduate diploma in any tertiary institution and, to the best of my knowledge and belief, the thesis contains no copy or paraphrase of material previously published or written by other persons, except when due reference is made in the text.
Birgit Kruse
University of Tasmania
ABSTRACT
ACKNOWLEDGEMENTS
Many people have contributed to this thesis. Firstly, I want to thank Lester Franks Survey and Geographic for financial and technical support and Malcolm Lester for ideas leading to selection of the research subject area. Nick Davies and John McCullum have also contributed with technical help and advice. Ian Woodward from Pitt and Sherry provided helpful comments on the case study.
At the Department of Geography and Environmental Science, I would like to thank Jon Osborn. This project would not have been realised without his support throughout the year leading to the thesis study. I also thank my supervisor Werner
Hennecke for proof reading and lots of good critical comments. Lorne Kriwoken's and Elaine Stratford's comments on strategic aspects were also very helpful and challenging. I would like to thank Richard Mount for inspiring ideas and Kevin Leeson for insights in vegetation mapping. Gary Davidson and Lee Evans from CODES provided useful insights in hydrology modelling. I am also grateful to the Library staff at Utas, especially Debra Ploughman for reading parts of the thesis and her encouragement. Sincere thanks to Eoin Breen's dedication in organising student support and get-togethers.
Outside Utas, Daniel Ray (DPIVVE), Darryl Cook (DPIWE) and Ron McLean (ACMER), who gave me constructive ideas and contacts at an early stage, of which I am very grateful. I would also like to include John Pemperton and Grun Wojciech for their generous donation of time.
I thank my family and friends, who supported this project from the distance. I am also grateful to my friends in Tasmania who made difficult times enjoyable.
TABLE OF CONTENTS
PART A CONCEPTUAL FRAMEWORK
1
CHAPTER 1 INTRODUCTION
1.1 Background 1
1.2 Scope and significance of the current study 3
1.3 Aims and objectives 3
1.4 Limitations 4
1.5 Outline 4
• CHAPTER 2 THE USE OF GIS AND EIA 5
2.1 Introduction 5
2.2 GIS — A tool for spatial analysis 5 2.3 EIA - An instrument for sustainable development 11
2.3.1 EIA Principles and Methods 11
2.3.2 EIA in Australia 14
2.3.3 Environmental Management System 19
2.4 Conclusions 20
CHAPTER 3 THE USE OF GIS FOR EIA IN MINING 22
3.1 Introduction 22
3.2 Best practice in Mining • 22
3.3 Mining regulations in Tasmania 24
3.4 Environmental impacts of mining 25
3.4.1 Landform and landscape 26
3.4.2 Rocks and soils 26
3.4.3 Hydrology 27
3.4.4 Flora and fauna 28
3.4.5 Socio-economic and cultural impacts 29
3.4.6 Acid Mine Drainage 29
3.4.7 Mining Impacts in Tasmania 30
3.5 The Use of GIS for EIA in Mining 34
3.6 Conclusions 41
PART B: CASE STUDY
42
CHAPTER 4 INTRODUCTION 43
4.1 Background to the case study and outline 43
4.2 The Savage River Mine 43
4.3 The EIA Process 46
TABLE OF CONTENTS
4.3.3 The EIA process 46
4.3.4 Spatial Data Requirements by DELM 47
4.3.5 The Savage River Rehabilitation Program 48
4.4 Discussion 49
4.5 Conclusions 50
CHAPTER 5 GIS FOR SCREENING AND SCOPING 52
5.1 Introduction 52
5.2 Data requirements and collection 52
5.3 Data storage 55
5.4 GIS for the Scoping Stage .. 56
5.4.1 Location 56
5.4.2 Mining history 56
5.4.3 Proposed development 57
5.4.4 Current environmental situation 59
5.4.5 Current socio-economic situation 61
5.5 Public consultation 63
5.5.1 Spatial information in the development proposal 63
5.5.2 Presentation types 63
5.5.3 Collection of key issues for in-depth analysis 64 5.6 Categorisation of key issues for in depth analysis using GIS 65
5.7 Summary 68
CHAPTER 6 GIS FOR KEY IMPACTS ASSESSMENT 69
6.1 Introduction 69
6.2 Data requirements 69
6.3 Landform and landscape 71
6.3.1 Impacts on landform and landscape 71
6.3.2 GIS analysis 72
6.3.3 Discussion 77
6.3.4 Summary 78
6.4 Pollution and contamination 78
6.4.1 Impacts on water and soils 78
6.4.2 GIS analysis 79
6.4.3 Discussion 84
6.4.4 Summary 84
6.5 Ecosystems 85
6.5.1 Impacts on ecosystems 85
•
6.5.2 GIS analysis 85
6.5.3 Discussion 91
6.5.4 Summary 92
6.6 Socio-economic and cultural situation 93
6.6.1 Impacts on the socio-economic and cultural situation 93
TABLE OF CONTENTS
6.6.3 Summary 99
6.7 Cumulative and interrelated impacts 99 6.8 Documentation of data and processes 100
6.9 Presentation of the DPEMP 101
6.10 Summary and Conclusions 102
CHAPTER 7 INTEGRATION 104
7.1 - An integrated spatial environmental management system (ISEMS) 104
7.2 From DPEMP to ISEMS 106
7.2.1 Converting categories into subsystems 106
7.2.2 Data storage and handling 107
7.2.3 GIS Functions and links 107
7.2.4 Documentation and Publication 109 7.3 Integration into the Tasmanian Planning System 111 7.4 Integration of the ISEIA in the existing EIA process in Tasmania 113 7.5 Recommendations for the EIA approval process in Tasmania 116
CHAPTER 8 CONCLUSIONS AND FURTHER RESEARCH 117
LIST OF FIGURES
Figures
FIGURE 1-1: MINERAL PRODUCTION IN AUSTRALIA 1
FIGURE 1-2: MINERAL PRODUCTION FOR SELECTED MINERALS IN AUSTRALIA 1
FIGURE 1-3: ENVIRONMENT PROTECTION EXPENDITURE IN AUSTRALIA 1996-97 AND
2000-01 2
FIGURE 2-1: RASTER AND VECTOR OVERLAY IN GIS 7
FIGURE 2-2: PROCEDURE FOR QUALITATIVE AND QUANTITATIVE SPATIAL ANALYSIS 8
FIGURE 2-3: TAXONOMY OF MODELS USED FOR ENVIRONMENTAL MODELLING IN GIS 10
FIGURE 2-4: THE EIA PROCESS IN TASMANIA 17
FIGURE 2-5: EMS AND ITS MOST IMPORTANT COMPONENTS DEVELOPED BY ISO 20 FIGURE 3-1: MINES AND MINERAL PROCESSING IN TASMANIA 31
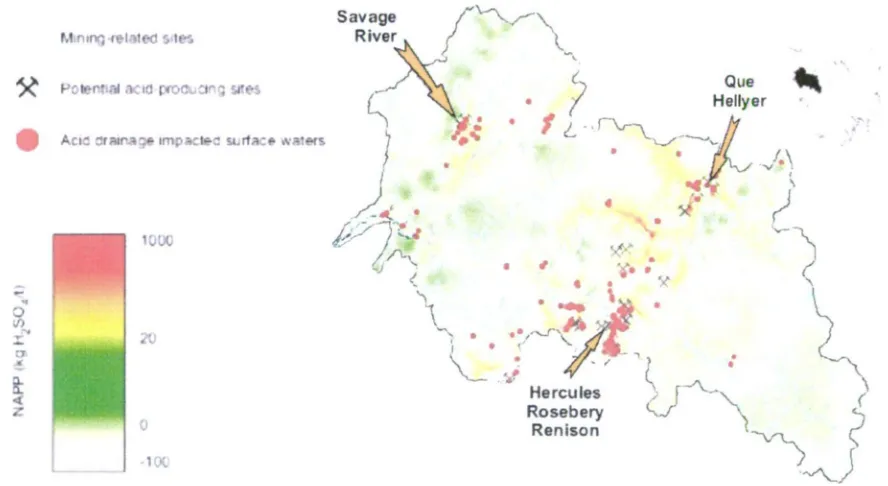
FIGURE 3-2: EXTRACT OF ACID MINE DRAINAGE MAP 34
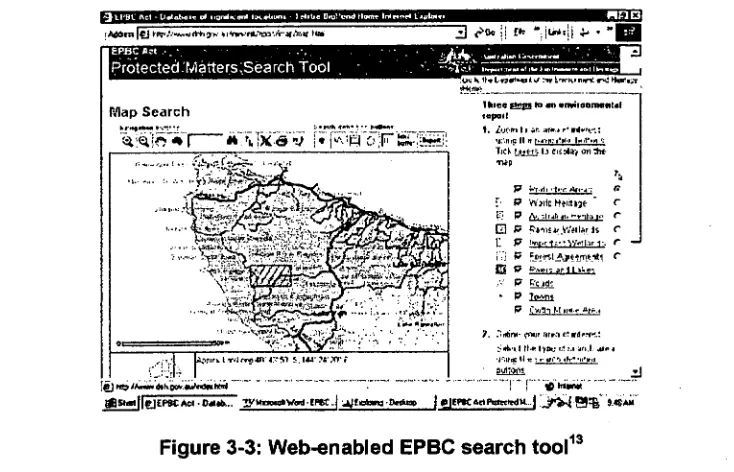
FIGURE 3-3: WEB-ENABLED EPBC SEARCH TOOL 39
FIGURE 4-1: TOPOGRAPHIC MAPS AND PROPOSED MINING LEASE BOUNDARY 45
FIGURE 4-2: REMEDIATION AT SAVAGE RIVER UNDER THE SRRP PROGRAM 48
FIGURE 4-3: GIS TOOLS FOR USE IN EIA FROM SIMPLE TO SOPHISTICATED 50 FIGURE 5-1: EXISTING MINE STRUCTURES AT SAVAGE RIVER 58
FIGURE 5-2: LANDSAT 7 IMAGE 59
FIGURE 5-3: EXAMPLE FOR A QUERY OF THE TASVEG DATABASE 61
FIGURE 5-4: EXAMPLE FOR A QUERY IN THE GT SPOT DATABASE 61
FIGURE 5-5: CATEGORIES FOR GIS ANALYSIS 68
FIGURE 6-1: LASER SCAN IMAGE OF THE CEMENT MINE IN RAILTON 72
FIGURE 6-2: GIS PROCESS FOR LANDFORM OF SAVAGE RIVER 74
FIGURE 6-3: VISIBILITY STUDY ON THE LANDSCAPE 75
FIGURE 6-4:EXAMPLE FOR A SEEN AREA ANALYSIS 76
FIGURE 6-5: GIS PROCESS FOR LANDSCAPE AT SAVAGE RIVER 77
FIGURE 6-6: GIS PROCESS FOR CONTAMINATION MODELLING AND SPATIAL SIMULATION AT
SAVAGE RIVER 81
FIGURE 6-7: DRAFT MAP FOR WATER MONITORING STATIONS AT SAVAGE RIVER 83
FIGURE 6-8: UNION OF TWO GIS LAYERS AND A QUERY 87 FIGURE 6-9: DRAFT MAP FOR A FLORA AND FAUNA IMPACT ASSESSMENT PLAN 89
FIGURE 6-10: GIS PROCESS FOR ASSESSMENT OF ECOSYSTEMS 92 FIGURE 6-11: DISPLAY EXAMPLE FOR A GIS MAP IN SIA 97
FIGURE 6-12: EXAMPLE FOR PROCESS DOCUMENTATION IN GIS 101 FIGURE 4-4: THE GIS-BAsED EIA PROCESS FOR SAVAGE RIVER 105
FIGURE 7-1: SIMPLIFIED EXAMPLE FOR AN ENVIRONMENTAL MONITORING SYSTEM 108
LIST OF FIGURES
FIGURE 7-3: PHOTO PRESENTATION OF REHABILITATION 110
FIGURE 7-4 WEB-ENABLED GIS FOR WATER MONITORING 110
FIGURE 7-5: MAP SHEET 19 OF THE WARATAH-VVYNYARD PLANNING SCHEME 2000 111
FIGURE 7-6: ONLINE PLANNING SCHEME 112
FIGURE 7-7: INTEGRATION OF THE ISEIA INTO THE EXISTING APPROVAL PROCESS 115
FIGURE 8-1: GIS LAYERS FOR LANDSCAPE CHARACTER ASSESSMENT 121
FIGURE 8-2: VARYING INFORMATION CONTENT IN DIFFERENT MAP SCALES 122
TABLES
TABLE 3-1: DIFFERENT CATEGORISATION OF COMPONENTS OF THE
ENVIRONMENT 38
TABLE 7-1: POSSIBLE SPATIAL QUESTIONS ABOUT LOCATIONS 56
TABLE 7-2: POSSIBLE SPATIAL QUESTIONS ABOUT THE MINING OPERATION 57
TABLE 7-3: POSSIBLE SPATIAL QUESTIONS ABOUT THE PROPOSED MINING
EXTENSION 58
TABLE 7-4: POSSIBLE SPATIAL QUESTIONS ABOUT ENVIRONMENTAL ISSUES 60
TABLE 7-5: POSSIBLE SPATIAL QUESTIONS FOR ECONOMIC AND CULTURAL
ASPECTS 62
TABLE 7-6: CATEGORISATION OF THE ENVIRONMENT IN THREE DIFFERENT EMPs
AT SAVAGE RIVER 65
TABLE 8-1: SOCIO-ECONOMIC IMPACTS 93
TABLE 8-2: GIS LAYERS FOR SOCIO-ECONOMIC AND CULTURAL IMPACTS 96
TABLE 8-4: LEVELS OF ACCURACY 53
TABLE 8-5: RECOMMENDED DATASETS, SCALES AND SOURCES FOR THE SCOPING
STAGE IN EIA 54
LIST OF ACRONYMS
ABM Australian Bulk Minerals ABS Australian Bureau of Statistics AMD Acid Mine Drainage
ARD Acid Rock Drainage ALS Airborne Laser Scanning
ASDD Australian Spatial Data Directory ASDI Australian Spatial Data Index
BPEM Best Practice Environmental Management
DELM Department for Environment and Land Management (now DPI WE) DEM Digital Elevation Model
DEMP Development proposal and Environmental Management Plan DIER Department for Industry, Energy and Resources
DPI WE Department for Primary Industries, Water and Environment EIA Environmental Impact Assessment
EIS Environmental Impact Statement EMP Environmental Management Plan
EMPCA Envirolmental Management and Pollution Control Act 1994 EMS Environmental Management System
EPBC Environmental Protection and Biodiversity Conservation Act 1999 EP(IP) Environment Protection and Impact of Proposals Act 1974 EPN Environmental Protection Notice
ERP Environmental Rehabilitation Plan GIS Geographical Information Systems
ISO International Organisation for Standardisation The LIST Land Information System Tasmania
LUPAA Land Use and Planning Approvals Act 1993 MRT Mineral Resources Tasmania
RAP Recommended Area for Protection
RMPS Resource Management and Planning System 1993 RPDC Resource Planning and Development Commission SPPA State Policies and Projects Act 1993
SRRP Savage River Rehabilitation Program RUSLE Revised Universal Soil Loss Equation
SECIS Social, Economic and Cultural Impact Statement SIA Social Impact Assessment
A
r7
Oil
Oil/NG Fe
Au Fe Fe Pb/ln Cu/Au/Bi Oil/NG — Pb/Zn Cu
Cu/Ag/Pb/In Cool
Cu/Ag/Pb/Zn Coal Sn Ni Mn NG Diamonds
Au Cu/Pb/Zn
Ni Oil/NG
Cool Oil/NG
Sn Sb Cu/Pb/Zn Coal Ag/Pb/ln Coal
Au Coal
Au Sn Cu/Ph/in
W o
Ag/Pb/ln
Ti/in
Oil/HG Ni Coal
Ti/Ir NG Au
Ni
BC Brown cool Cu Copper HG Natural gun W Tungsten Al Bauxite Sn Tin
U Uranium Ti/Zr Titanium & Zircon Fe Iron ore Si Bismuth Ag Silver Mn Manganese Au Gold Sb Antimony Pb Lead
In Zinc Hi Nickel
BC Al
Cool Ti/Zr
Bauxite
0 Copper
o Iron ore tj Uranium
r) Total value ($rn) 150,000
cs' 100,000 rD
°
" 50,000
-n -r-1_, -n -n , -n
1995-96 1996-97 1997-98 1998-99 999- 2000
Year
CHAPTER 1 — INTRODUCTION
CHAPTER 1 INTRODUCTION
1.1 Background
[image:13.557.69.484.225.737.2]Mining and mineral processing are important sectors of the Australian economy. Australia has some of the biggest mineral mines in the world (ABS 2003b). Mineral production is widespread throughout the country (see Figure 1-1). Among the minerals, iron ore has had the highest production rate for the last years (Figure 1-2).
Figure 1-1: Mineral production in Australia (Aplin 2002)
160
140
120
100
80
40,
60
40
20 -
ez.) - .0.4)
nC \
■Cb ' v
e,
N.% •c• co°
ee,
Breakdown for 2000-01
0 Coal mining
• Oil and gas extraction 0 Metal ore
mining
CI Other mining
CHAPTER 1 — INTRODUCTION
[image:14.559.57.451.308.564.2]Early in the history of mining, mining activities were criticised for their effects on the environment (Turner 2003). In Europe environmental pollution from mining can be traced back more than 1000 years (LFU 1997). A well-known notorious example in Tasmania is the Mount LyeII mine near Queenstown on the West Coast, where mining began in 1896 (Harries 1997). Here, early extraction and processing of minerals has resulted in a denuded landscape, water and soils pollution and stream siltation (SDAC 1996). It was not until the 1970's, that the environment was considered in mining operations (ACE 1972). Today, a large amount of capital is invested into environmental management (see Figure 1-3). Most of the expenditure takes place in rehabilitation and solid waste management. This is especially the case for iron ore mines. The high costs in iron ore mining can be explained by the handling and treatment of large amounts of waste rock (stripping ratio) and rehabilitation of vast areas of open cut mines (Ripley, Redmann et al. 1996; Harries 1997).
Figure 1-3: Environment protection expenditure in Australia 1996-97 and 2000-01 (ABS 2003)
CHAPTER 1 - INTRODUCTION
Drainage (AMD), which is a concern for mines around the world, is the topic of
current research (AusIMM 2003). According to Harries (1997), AUS $ 900 million
were spent in Australia for management of mines with potential for acid production
over a period of 15 years (between 1982 and 1997). In 2001, a Tasmanian wide
survey of AMD for abandoned mine sites was undertaken (Gurung 2001). This
survey revealed that 215 abandoned mines produce or have the potential to produce
AMD in this state. The study was not only significant from a hydrochemical
perspective of assessing AMD but also for spatial analysis and visualisation, as a
Geographical Information System (GIS) was used for spatial modelling of AMD.
1.2 Scope and significance of the current study
Although very sophisticated GIS programs have been developed to determine the
location and size of ore bodies, for example through 3D geological modelling', no
fully-fledged GIS application appears to have been developed to date to provide an
integrated tool for EIA and environmental management in Australia. One possible
reason is the environmental uniqueness of each mine, wIlich makes it difficult to
develop general tools for EIA analysis. Another reason is the absence of a
comprehensive understanding of interrelated environmental impacts caused by
mining. A third reason is the availability of spatial data. The objective of the present
study is to develop a conceptual framework, in which GIS is the core instrument for
EIA in mining. This can then be used to develop an integrated assessment tool.
1.3 Aims and objectives
The aim of this study is to develop a theoretical framework for an integrated spatial
EIA, which can be extended to an EMS. In order to develop such a planning tool, a
comprehensive knowledge of environmental processes involved in mining as well as
technical aspects of GIS capacity and solutions must be combined. The abandoned
iron-ore mine at Savage River has been chosen as a case study for a theoretical
framework for a GIS-based EIA. This mine is an example, where EIA needs to
consider environmental impacts of abandoned mine areas, a situation that may
become more relevant in the future with more difficult to access mineral deposits and
the growing capacity to extract lower grades of ore. At the same time, this makes an
integrated and co-operative approach more important.
CHAPTER 1 - INTRODUCTION
The main hypothesis for this study is that the use of GIS improves environmental impact assessment and management in mining by expanding the existing concept of an environmental management system into an "integrated spatial environmental management systems" (ISEMS). A second hypothesis is that the use of GIS enhances communication between the mining operator, governmental agencies and the wider public. This is especially useful, as environmental communication now forms part of an environmental management system (ISO 14063).
1.4 Limitations
The case study focuses on the Savage River mine, which has specific environmental aspects and issues. Although based on data from an existing development proposal and environmental management plan (DPEMP) 1996 and additional sources, the process in this study is largely hypothetical (see Chapter 5 for details). As the project involves many environmental and socio-economic aspects, which would need a team of environmental experts, these different aspects can only discussed broadly and the focus is on GIS methods. Due to the limited available data, a conceptual GIS has been developed rather than a data-based case study. No site inspections and data collections were undertaken, because of the restricted time frame. The literature review revealed that little research has been done on the use of GIS for EIA in mining. Therefore the framework is kept broad and selected examples are given for each EIA component. For illustration purposes maps from other areas have been included. ArcGIS 8.3 was used for display maps.
1.5 Outline
CHAPTER 2 - THE USE OF GS AND EIA
CHAPTER 2 THE USE OF GIS AND EIA
2.1 Introduction
GIS has become a known tool for spatial analysis, while EIA has become a
well-established instrument for sustainable development (Burrough and McDonnell 1998;
Harvey 1998). This chapter gives an overview of the uses of GIS for spatial analysis
and environmental modelling and EIA methods and use in Australia and Tasmania.
The application of GIS as a tool for EIA in mining is discussed in Chapter 3.
2.2 GIS — A tool for spatial analysis
GIS can be broadly defined as a system of "computer based tools to capture,
manipulate, process, and display spatial or geo-referenced data" (Fedra 1993, p.35).
Burrough and McDonnell (1998) group common GIS definitions into three categories:
toolbox-based, database oriented and organisation-based definitions. For this study
the early organisation-based definition by Cowen (1988) is considered to be the most
appropriate in the context of EIA:
"A decision support system involving the integration of spatially referenced data
in a problem solving environment." (Cowen, 1988 in Burrough and McDonnell,
1998)
This definition emphasises the decision support aspect, which can be seen as the
main function of GIS in environmental management in this study. A comprehensive
history of GIS is given by Longley, Goodchild, Maguire and Rhind (1999) describing
the origin of GIS in digital computing, automated map making, landscape architecture
and planning, urban and demographic sciences as well as remote sensing. They
explain that the merging of mapping techniques and GIS was a technically easy task,
as existing storage and manipulation techniques in different fields were similar. It was
more difficult to bring raster and vector data models together because of competition
between underlying concepts. It is argued that raster data processes are more
"reliable, repeatable and justifiable" (Parker 2003) while vector data operations allow
more transparency (DeMers 2000). However this depends on the type of analysis.
For example, in hydrological modelling the use of a digital elevation model (raster
format) is common (Hutchinson and Gallant 1999). It also allows for integration of
CHAPTER 2 - THE USE OF GIS AND EIA
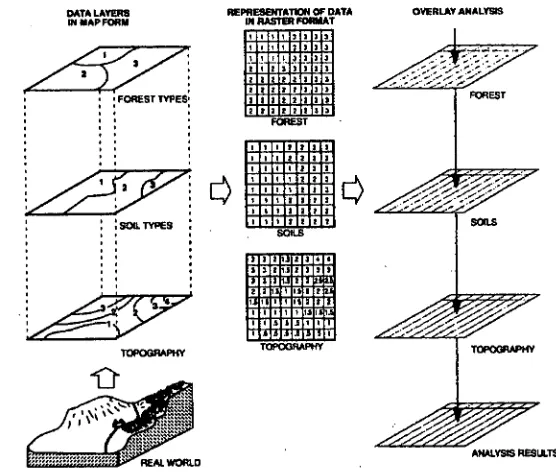
and Loveland 1999). In landscape character assessment the overlay of digitised information in vector format may be favoured. No single method alone is best. The combination of both is common. For use of satellite data or scanned maps and overlay of vector data, both need to be used. It may be necessary to convert raster to vector and vice versa. This procedure however leads to a loss of quality.
GIS combines established disciplines such as remote sensing, surveying and cartography (Goodchild 1993). A history of these disciplines and state of the art applications are given by Konecny (2003). More detailed information on photogrammetrical methods and integration into GIS can be found in Wolf (2000). A good overview of remote sensing methods and applications is given by Lillesand and Kiefer (2000). Burrough (1998) describes the history of GIS from the natural resource management perspective and Goodchild et al (1993, 1996) the relevance of GIS in environmental modelling. The overlay technique, common in GIS, goes back to McHarg's ground breaking planning technique in "Design with nature" (McHarg 1969), where manual overlays were performed using transparencies to determine environmentally sensitive planning solutions.
In general a GIS consists of four elements: hardware, software, personnel and spatial data (Chou, 1996). The functions can be categorised into: entry, storage, manipulation, analysis, and presentation. Advantages of GIS as compared to the use of paper maps are the capabilities for easier and faster updates and the efficiency in data storage and processing; the storage of multiple attributes for a feature and their relationships (Chou 1997 Goodchild, 1993).
The fundamental characteristic in GIS is its capacity to perform spatial analysis (Chou 1997). Skidmore (2002) argues that the analytical capacity of GIS is the reason for its increasing use in decision-making, planning and environmental management. Technically, spatial analysis may be split into "single layer" and "multiple layer" operations; although most spatial analyses require both. Single layer operations include manipulation, selection and classification; whilst multiple layer operation encompass: overlay, proximity and correlation (Chou 1997).
REPRESENTATION OF DATA IN RASTER FORMAT
1
11
1
10
11
111
INIE111111111 131100131EIBEI rinrrnrrnnn
Emanation
FOVEST
onannan onniumn nnorman imminno
IMEMEMEI 01:111110E1E1 ICIEMEIBEID
SOILS
uunazionio uumuunau
UUUEUIL1111 EILECIECLIEEr IELLICILILUILUM UULIMEEIEtE ILIMICIEHMUU ISLILILIUULIO TOPOGRAPHY
OVERLAY ANALYSIS
FOREST
ANALYSIS RESULTS DATA LAYERS
IN NAP FORM
FOREST TYPES
SOIL TYPES
TOPOGRAPHY TOPOGRAPHY
[image:19.557.107.385.66.302.2]CHAPTER 2 - THE USE OF GIS AND EIA
Figure 2-1: Raster and vector overlay in GIS (Aronoff 1989, p. 167)
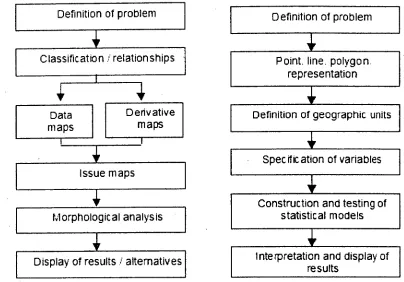
Interpretation and display of results
Construction and testing of statistical models Specification of variables Definition of geographic units
Definition of problem
Point. line, polygon representation
CHAPTER 2 - THE USE OF GS AND EIA
Definition of problem
Classification I relationships
4
Derivative maps Data
maps
Issue maps
Morphological analysis
V
[image:20.557.43.447.61.343.2]Display of results / alternatives
Figure 2-2: Procedure for qualitative (left) and quantitative spatial analysis (right) 2
In its approximately forty years of existence, GIS has changed significantly in technology and application. While in the 1970s and 1980s, the use of GIS was limited to an exclusive expert community, its main application being in science. The technology has since been developed as a readily available, user-friendly desktop GIS with an extensive range of applications (Goodchild and Longley 1999). A product overview in GIM (02/2004) shows that many GIS packages include advanced visualisation functions (3D visualisations, animations, collaborative visualisation), interactive tools (queries, dynamic links, real time maps) GPS links and web-enabled output. A vision for the use of GIS is to provide access to spatial data for display and analysis and this to be possible from everywhere in the world, at any time using stationary computers or mobile devices (Batty 1999). Various data sources (e.g. aerial photos, satellite imagery and airborne laser scanning) are becoming more accurate, higher in resolution and affordable. They replace more and more traditional time and cost-effective surveying methods. Nevertheless, issues of accuracy and scale (i.e. mixing data of varying accuracy), projection and resolution require careful consideration. At the same time traditional thematic cartography should not be overlooked (Caquard 2003).
2
CHAPTER 2 - THE USE OF GS AND EA
GIS for environmental modelling
One of the most sophisticated uses of GIS for environmental management and planning is environmental modelling. Environmental models are an abstraction or simplification of reality. They allow prediction of future environmental conditions and thus can assist in sustainable development (Skidmore 2002). Large numbers of theories for environmental modelling as well as applications have been developed in GIS. Aspinall and Pearson (1996) have investigated the use of GIS for ecological modelling and Larsen (1999) for monitoring and assessment of sedimentation and water flow. Specific applications have also been developed for soil-landscape modelling (Gessler, Moore et al. 1996; Scull, Franklin et al. 2003) hydrological modelling (Moore 1996; Muller, Cochonneau et al. 2003) and atmospheric modelling (Lee and PieIke 1996). Various hydrological models have been developed including a dynamic hydrological model (UPHASE"), which is linked to a GIS (Gumbricht 2000).
Environmental modelling tools in standard GIS programs to be used in EIA are limited (Openshaw and Alvalides, 1999, Fischer, 1999). One possible reason is seen in the separate development of the essential components of GIS such as data collection methods and environmental models, which in consequence has led to similar products and processes that have not necessarily been compatible (Burrough
1997). Another reason is the gap between GIS and environmental sciences. It is not only a matter of technically linking environmental models with GIS, but as Goodchild (1993) points out, it is also important to understand intrinsic differences in logic and concepts. He argues that GIS models and environmental models do often not match because GIS is representation-oriented using finite elements, whereas environmental modelling can be very abstract and uses mainly continuous elements. Busby (2002) argues that the abundance of data and complexity of environmental models are often beyond the understanding of decision-makers. As Goodchild (1993) points out, GIS tools need to work together in an intelligent way and be easy to use and flexible.
The opinion about whether GIS should aim to fully integrate spatial modelling tools is divided. Some argue that spatial modelling should be outside GIS (Birkin 1996), while others promote modelling within GIS (Aspinall and Pearson 2000). Openshaw and Alvanides (1999) suggests 10 criteria for GIS in order to match with environmental
CHAPTER 2 - THE USE OF GIS AND EiA
Deterministic models are further divided into empirical, process and knowledge-based models. In this taxonomy a model may be part of a combination of approaches. Knowing the logic and the method behind a model may help in understanding its best use and to find similar models (Skidmore, 2002).
LOGIC
ME
T
HO
D
Deductive Inductive
Deterministic Empirical Regression
(USLE), Threshold, Rules
Knowledge- based
Expert system Bayesian expert system, Fuzzy system
Process- based
Hydrological model, Ecological
models
[image:22.559.65.439.160.475.2]Stochastic Monte Carlo Neural networks
Figure 2-3: Taxonomy of models used for environmental modelling in GIS3
One solution to bridge the gap of environmental modelling in GIS is the use of loosely coupled models (Yeh 1999). Complex models such as hydrological modelling are difficult to integrate fully into GIS as they require a large amount of data and are specific in use and conditions (Feng 2000; Gumbricht 2000). For this reason it is argued that hydrological modelling is not likely to become a standard function in GIS (Wegener 2000). In order to provide a stronger linkage, a modular and transparent approach in modelling is necessary (Gumbricht 2000). At the same time, modelling programs such as Matlab4 increase the number of spatial analysis tools and thus break into the traditional GIS domain. On the other hand, the full incorporation of environmental models into GIS would bring GIS closer to the goal of being an expert
3
after Skidmore, 2002
CHAPTER 2 - THE USE OF GS AND EA
system, which would be of great benefit for those decision makers in EIA, who are
not GIS experts.
2.3 EIA - An instrument for sustainable development
Environmental impact assessment (EIA) has been used as an instrument for
sustainable development (Glasson, Therivel et al. 1994). EIA has gained wide
recognition through the "Rio declaration of environment and development", where it
has been adopted as one of the key principles (United Nations 1992; Harvey 1998)
EIA can be defined as:
"The process of identifying, evaluating and mitigating the biophysical, social
and other relevant effects of development proposals prior to major decisions
being taken and commitments made." (IAIA 1999)
EIA was first incorporated into legislation in the US National and Environmental
Policy Act 1969 (Harvey 1998). Since then it has been introduced into environmental
legislation throughout the world, although with many variations (Harvey 1998). An
international overview can be found in Wathern (1992). General theory on EIA in
English has been well documented for the USA and Europe in particular England
(Glasson, Therivel et al. 1994; Morris and Therivel 1996). EIA was introduced in
Australia in 1974 with the Environmental Protection (Impact of Proposals) Act
(Harvey 1998). A number of different EIA types have been developed since then.
Among them are the social impact assessment (SIA), health impact assessment
(HIS) and strategic environmental assessment (SEA).
2.3.1 EIA Principles and Methods
According to the basic principles outlined by IAIA (1999), an EIA should among
others be:
o Purposive (i.e. informative)
o Rigorous
o Efficient
o Adaptive
o Interdisciplinary
o Credible and transparent
o Participative
CHAPTER 2 - THE USE OF GIS AND EA
The goal of purposive aspects in EIA (i.e. contributing towards protecting the environment and community) and efficiency (i.e. involve minimum financial cost and time) are demanded by environmental legislation and company policies. Less considered are aspects such as interdisciplinary assessment, transparency and public participation. These however can also greatly influence the ultimate goal of environmental protection and efficiency of project development. They are especially necessary to be considered when using more complex processes. At the practical level the EIA should consist of the following steps:
o Screening
o Scoping and baseline studies o Examination of alternatives o Impact analysis
o Mitigation and impact management o Evaluation of significance
o Preparation of environmental impact statement (EIS) or report o Review of the report
o Decision making o Follow up
(Beanlands 1992; International Association for Impact Assessment (IAIA) 1999)
A vital part of an EIA process is the decision about the methods and techniques to be used. Common methods in EIA include:
o Checklists o Matrices
o System diagrams o Map overlays
o Simulation modelling (Bisset 1992; Harvey 1998)
CHAPTER 2 - THE USE OF GIS AND EA
It can however be time-consuming and is limited to ecological impacts that can be expressed by energy flows (Bisset, 1992).
The most common GIS function used in EIA is the map overlay. The overlay ' technique has been criticised as being too simple and subjective. At the same time it is very useful because it is easy to perform and rerun, and can be used to show spatial distribution of potential environmental impacts (Harvey 1998). Patila, Annachhatrea & Tripathib (2002) demonstrated in a comparative survey that remote sensing and GIS can be particularly effective in analysing cumulative impacts by showing effects over time and for a large area, e.g. visualise the source and spread of pollutants.
One example for an EIA in Tasmania, where GIS has been used and well documented, is the Tasmanian Natural Gas Project (Hydro Tasmania 2000). Here, GIS played a central role for determining the route and alternatives for a planned gas pipeline across Bass Strait. A wide range of GIS layers were collected and made accessible for various environmental consultancies.
A major challenge in EIA is the prediction of cumulative (i.e. interrelated and additive effects). Interactions can be between impacts of one project or between the proposed and other projects. Therivel and Morris (1996) divide cumulative impacts into:
Additive, aggregate, or "nibbling", i.e. the sum of impacts
ta Synergistic, i.e. impacts interact and create an impact that is greater than the sum of the individual impacts
Neutralising, i.e. impacts counteract each other and reduce the overall impact
An example for cumulative environmental impacts are the effects of different mines on a stream (additive). An example for socio-economic cumulative impacts is the potential for employment opportunities and the attraction of more industry and services into the area (synenergistic). While single impacts can be determined by simple methods such as checklists and matrices, cumulative impacts need more sophisticated methods such as overlays, networks and simulation models (Therivel and Morris 1996). While overlay is standard functions in GIS, environmental modelling for simulation is an ongoing area of development (see Section 2.2).
CHAPTER 2 THE USE OF OS AND EA
significance of impact. Beside technical issues, information management is one of the major challenges.
2.3.2 EIA in Australia
Little research has been published on EIA methods in Australia. Annandale & Taplin (2003) carried out a comparative study in Australia and Canada discussing impediments of EIA. Harvey (1998) compared the EIA process in the different states and Territories in Australia. Padgett & Kriwoken (2001) reviewed the influence of the EPBC Act 1999 on EIA, Morrison-Saunders, Annandale & Cappelluti (2001) conducted a survey on quality criteria of EIA in Western Australia. The use of EIA in mining is examined by Elliott & Williams (2004), Jarvis and Younger (2000) and Kuma, Younger & BoweII (2002). Joao (2002) discussed the effect of scale in EIA. Patila, Annachhatrea & Tripathib (2002) compared a conventional with a GIS-based EIA. Hakley (2000) explored the role of the public in EIA and implications for GIS.
The primary Commonwealth legislation, which triggers the need for an EIA, is the Environmental Protection and Biodiversity Act 1999 (EPBC Act). This legislation replaced several individual acts such as the EP(IP) Act 1974 and enhanced the previous environmental impact assessment procedure by making it more efficient, consistent and transparent (Padgett and Kriwoken 2001). An EIA is triggered if one of the seven matters of national environmental significance is affected. These are the presence of:
o World Heritage properties,
o National Heritage places (from 1 January 2004)
o Ramsar wetlands of international importance,
Listed threatened species and communities,
o Migratory species protected under international agreements,
o Nuclear actions, and the Commonwealth marine environment.
The decision on whether a proposal requires an EIA is made by the Commonwealth Environment Minister (Environment Australia 2004). The EIA process consists of three stages: a referral, the assessment and the approval. If a "Bilateral Agreement"
CHAPTER 2 - THE USE OF GIS AND EA
the States or Territories under an "accredited assessment process" (Environment Australia 2004). Under the Commonwealth, the EIA can take one of the four following forms: preliminary documentation, public environment report, environmental impact statement or public inquiry.
EIA in Tasmania
In Tasmania, State and Territory governments are responsible for the granting and administration of exploration and mining licences. In Tasmania the EIA is integrated into the Resource Management and Planning System 1994 (RMPS). The RMPS represents an integrative planning system with several individual Acts. The overall objectives are:
(a) To promote the sustainable development of natural and physical resources and the maintenance of ecological processes and genetic diversity,
(b) To provide for the fair, orderly and sustainable use and development of air, land and water,
(c) To encourage public involvement in resource management and planning,
(d) To facilitate economic development in accordance with objectives (a), (b), (c) and
(e) To promote the sharing of responsibility for resource management and planning between the different spheres of government, the community and industry in Tasmania (The Law 2004).
CHAPTER 2 - THE USE OF GIS AND EA
Level 2— Use
Planning and Approvals Act/ Environment Management and Pollution Control Act. A Joint Assessment Team comprising the Board and the planning authority may be formed.
1
An environmental effects form may be requited from the
ptojtonent within 28 days.
If further Information is required (DPEMP), formal guidelines may be set (no requirement for public comment).
Assessment documents may be released for public review
for 14-28 data.
Level 3—State Policies and Projects Act
Guidelines are set by the Sustainable Development Advisory Council.' Councils anel government agencies forward comments
on the proposal.
The EIS, EmP, and/or SEC1S May be prepared by the proponent.
The EIS is placed on public review for an unspecified period (28 days In practice). Level 1—Land Use
Planning and Approvals Act
Formal guidelines may be required.
Environmental information may be required (in the development application) by the planning authority.
Public review of
(discretionary) application takes place for
a period of 14 days.
CHAPTER 2 — THE USE OF GS AND EIA
The proposal is initiated.
1
An assessment is triggered by either the planning authority Xlevel 1), the Board of Environmental Management (level 2), or the Governor (level3).
The Sustainable Development Advisory Council prepares a draft IAR.
The 1AR is placed on public exhibition for a minimum of 28 days.
The Sustainable Development Advisory Council responds to the submissions in the final IAR.
The Sustainable Development Advisory Council prepares recommendations in a public assessment report
Within 42 days (or 60 days Within 180 days, in consultation Within 28 days a decision is if there has been government with the planning authority, a made by Governor's order. comment) a decision is made decision is made by the Board for
by the planning authority. Environmental Management.
key SECIS Social, Econoraic &Community Impact Statement
[image:29.557.77.469.51.645.2]DPEMP Development Proposal and Environmental Management Plan
Figure 2-4: The EIA process in Tasmania5
CHAPTER 2 - THE USE OF GIS AND EIA
Each level of impact requires a different assessment document to be prepared by the proponent ranging from: "environmental information" to an "environmental impact statement" (EIS), "environmental management plan" (EMP); and/ or, a "social, economic and cultural impact statement" (SECIS). All three levels differ in length of public review period, decision-making authority and time for decision making. A unique aspect in the assessment process in Tasmania is that the public has the opportunity to comment on a draft made by the planning authority (Board) (Harvey 1998). Principles for the EIA process are outlined in EMPCA, Division 1, Part 5. The most important principles are:
o The EIA is the information base for decision-making
The level of assessment must be appropriate to the significance of the proposed development
o The EIA must be undertaken in accordance with the requirements of the authority assessing the EIA.
o An opportunity for public consultation must be provided during the assessment process
Guidelines for all three levels of proposals are provided in the "Environmental assessment manual" (DELM, 1996). The manual intends to assist planning authorities and addresses mainly level 1 activities, although a wider interest is expected (DELM, 1996).
One important aspect of EMPCA is the use of best practice standards in environmental management. This is defined as "the management of the activity to achieve an ongoing minimization of the activity's environmental harm through cost-effective measures assessed against the current international and national standards applicable to the activity" (EMPCA, 4[1]) and is controlled by the following measures:
(a) strategic planning by the person carrying out, or proposing to carry out, the activity;
(b) administrative systems implemented by the person, including staff training;
(c) public consultation carried out by the person;
(d) product and process design;
CHAPTER 2 - THE USE OF GIS AND EIA
More specific standards for best practice for example in mining have been published by "Environment Australia" (former "Environmental Protection Agency").
Requirements for spatial information in EIA are few. Mining operators are required to provide information in mainly descriptive format. Information is required on: staging of proposed works, disposal of waste and current and proposed land use as well as scientific and cultural information (MRT 1999). DELM developed a guideline for Level 1 development proposals in mining (DELM 1996). Information recommended to be mapped in a scale of 1:25,000 include: areas of proposed mine lease; any residence within 1km; any existing pit workings within the proposed lease not already shown on the map and areas to be disturbed (DELM 1996). In addition, a working map in a scale of 1:100,000 should show information on aspects such as boundary of the mining lease within 100 m of the pit, proposed location and size of the pit, the locations of any rivers or creeks within 100 m of the pit, the locations of overburden heaps, topsoil stockpiles, settling ponds and tailings ponds. Requirements for level 2 and level 3 proposals are outlined in project specific guidelines by the Board of
Environmental Management and the Sustainable Development Advisory Council
(Harvey 1998).
The Exploration Code of Practice 1999 provides guidelines on map format and information content. Map scales should be consistent with standard map scales (1:25,000, 1:50,000, 1:250,000), datum and projection, include base data and a comprehensive legend. The content refers mainly to the display of geophysical properties and geology.
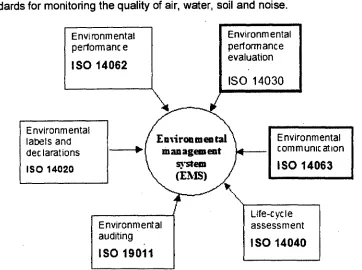
2.3.3 Environmental Management System
Environmental communic anon
I SO 14063
Life-cycle assessment
ISO 14040 -111•1
Environmental auditing
ISO 19011
Environmental labels and dec. larations
ISO 14020
Environmental management
system (EMS)
'CHAPTER 2 - THE, USE OF GS AND EA
performance is properly communicated to internal staff and external stakeholders.
One important aspect of ISO 14063 is improved transparency and documentation of
EIA processes and environmental issues. ISO has also developed more specific
standards for monitoring the quality of air, water, soil and noise.
Environmental perform anc e I SO 14062
Environmental performance evaluation
[image:32.557.63.425.114.384.2]ISO 14030
Figure 2-5: EMS and its most important components developed by ISO°
The establishment of an EMS is likely to be required for a mining permit as was the
case at Savage River (ABM 1996).
2.4 Conclusions
As a synthesis of several disciplines such as remote sensing, surveying and
cartography GIS provides great opportunities for use in EIA. During the last ten
years, GIS has become a user-friendly desktop program with a range of
sophisticated functions. Mobile and Internet GIS expand the use further towards a
multifunctional system. One major advantage of a GIS approach for EIA is that
collected data, for example for water quality, can be used for impacts on flora and
fauna. Thus it allows a more integrated assessment. The most common GIS-function
used in EIA is spatial overlay. Other functions such as networks and 3D modelling
have become standardised in GIS but are less known in EIA. Environmental
6
International Standardisation Organisation (ISO) (2002). ISO and the environment.
CHAPTER 2 - THE USE OF GIS AND EA
CHAPTER THE USE OF GIS FOR EIA IN MINING
CHAPTER 3 THE USE OF GIS FOR EIA IN MINING
3.1 Introduction
Mining operations can affect many aspects of the environment including vegetation, landscape and groundwater. Environmental effects vary depending on the climate and local conditions. In addition the history of the place can influence future impacts. In many cases, the effects of mining last longer than the mining operation and many long-term environmental effects caused by remaining pits, tailings and waste rock dumps are not well understood to date (Sengupta 1992; Harries 1997). At Mount LyeII near Queenstown, where mining has been undertaken for more than hundred years, environmental pollution in the form of acid drainage is an ongoing concern (McQuade, Johnston et al. 1995).
3.2 Best practice in Mining
In recent years management of mining has sought to balance profit against environmental damage. A major global event, which had consequences for planning of natural resources and the primary industries was the UN Conference on the Human Environment in Stockholm in 1972 (UN 1972). Here a new understanding of natural resources and the need for nature conservation was developed. Principle 2 states:
"The natural resources of the earth including the air, water, land, flora, and fauna especially representative samples of natural ecosystems must be safeguarded for the benefit of present and future generations through careful planning or management, as appropriate." (UN 1972).
CHAPTER 3 - THE USE OF GIS FOR EIA IN MINING
Institute of Geoscientists 1991). In response, the mining industry in Australia took a pro-active approach by introducing best practice standards for environmental management systems and the Australian Minerals Industry Code for Environmental
Management 1996 (ABS 2003). This code promotes best practice standards in
mining including the use of an environmental management system (EMS) according to ISO 14000. The Environmental Protection Agency (today Environment Australia)
has published a series of booklets on best practice standards in mine planning and management. These include specific mining related issues such as waste dump design (Environment Australia 1998) and water management (Environment Australia 1999 b). As well they cover issues of EIA (EPA 1995 f), environmental management systems (EPA 1995 e) and community consultation (EPA 1995 g).
Today as a result, the- mining industry in Australia is subject to a range of governmental and self-regulated environmental controls. White (1997) argues that because the mining industry is working within many regulations and constraints today, it can be seen as the most conscious of all land users. The vision for the mineral industry is to achieve "outstanding environmental-, social and economic performance" (Mineral Council of Australia 2000).
Sometimes the term "sustainable mining' as defined in the "Berlin Guidelines" can be found (Environment Australia 2002). As mining resources are not renewable the term seems from a broader holistic perspective as being misleading. "Sustainable mining" in reality can only be used in the context of sustainable use of resources to ensure the availability of resources for the future of the industry and the people (ABS, 2003). In 2002, a study was carried out by the World Business Council for Sustainable Development (IIED 2002). This study was initiated by the Global Mining Initiative (established by worlds leading mining and metal companies) and with support of the International Institute for Environment and Development (a London-based NGO). In addition, several national studies including in Australia were carried out (IIED 2002). The findings of the study in Australia included the need to increase public participation and to develop strategic directions.
CHAPTER 3 - THE USE OF GS FOR EIA IN MINING
3.3 Mining regulations in Tasmania
In Tasmania the idea of sustainable development was adopted in 1993 with the
Resource Management and Planning System as a planning framework and the
Environmental Pollution and Control Act 1994 as the controlling legislation.
Legislation most relevant to the mineral industry in Tasmania is:
o Mineral Resources Act 1993 (Tas.)
o Mining (Strategic Prospectivity Zones) Act 1993 (Tas.)
o Mineral Resources Development Act 1995 (Tas.)
o EPBC Act 1999 (Cwth.)
o Environmental Management and Pollution Control Ad 1994 (Tas.)
o Land Use Planning and Approvals Act 1993 (Tas.)
o State Policies and Projects Act 1993 (Tas.)
o Aboriginal Relics Act 1975 (Cwth.)
o National Parks and Wildlife Act 1970 (Cwth.)
o Threatened Species Protection Act 1995 (Cwth.)
o Historic Cultural Heritage Act 1995 (Tas.)
o Crown Lands Act 1976 (Cwth.)
o Regional Forest Agreement and Land Classification Act 1998 (Tas.)
o Dangerous Goods Act 1976
o Environmental Protection Act 1973
o Pollution of Water by Oil and Noxious Substances Act 1987
o Water Management Act 1999
(Tas. = Tasmania, Cwth. = Commonwealth)
Codes relevant to mining are:
o Mineral Exploration Code of Practice 1999 (4th ed.) (Tasmania)
o Quarry Code of Practice (Tasmania)
o Code for Environmental Management 2000 (Australia)
Mining legislation is generally outside the Resource Management and Resource
System 1994 (RMPS) (The Environmental Defenders Office 1999). The Mineral
Resources Development Act 1995 can for example include areas of private property,
State Forest and some types of reserves for exploration. However permits require
environmental impact assessments and compliance with policies, codes and best
CHAPTER 3 - THE USE OF GIS FOR EA IN MINING
Classification Act 1998, which amended the National Parks and Wildlife Act 1970, the Crown Lands Act 1976, and the Forestry Act 1920, the list of areas for exploration was reviewed in respect to nature conservation (MRT 2000). Regional Forest Agreement and Land Classification Act 1998 has particular relevance to CAR reserves (comprehensive, adequate and representative forest reserve system), which under the new Act are all subject to the Mineral Exploration Code of Practice 1999 (RFA clause 81, MRT 2000). Also, the environmental impact assessment and environmental management conditions as required by the EMPCA 1994, SPPA 1993 and/or the Mineral Resources Development 1995 (RFA clause 81, MRT 2000). CAR reserve areas with high wilderness value are processed under the State legislation to minimise effect of mineral exploration and mining activity. Rehabilitation is required and aims "to achieve world's best practice and to return the site to its wilderness condition" (RFA clause 82, MRT 2000, p.20).
Several standards and guidelines have been developed. Among them are:
o AS2243-10 Chemical storage (ABM 1996)
• AS/ NZS ISO 14000 — Environmental Management Systems
ANZECC/ARMCANZ and ANZECC/NHMRC guidelines for water and soil quality (ACMER, Environment Australia 1999 a; 2004)
3.4 Environmental impacts of mining
Environmental impacts of mining have been classified in different ways. For example, Down and Stocks (1977) group the environmental effects by their impact on man. Law (1984) distinguishes between cultural, geological and biological impacts. The Environment Protection Agency (now Environment Australia) lists 14 environmental issues relevant to mine planning including aspects of the natural environment such as air, water, flora and fauna as well as socio-economic aspects such as noise and visual effects (EPA, 1995 c). Ripley et al (1996) group the environmental effects according to different mining products. Other authors concentrate on environmental problems related to a specific type of mining such as coal mining (Sengupta 1992; Hannan 1995). Most common are categorising the environment in EIA such as:
o Landform and landscape o Rocks and soils
CHAPTER 3 - THE USE OF GIS FOR EA IN MINING
u Socio-economic and cultural impacts
3.4.1 Landform and landscape
Landform and landscape can be seen as different aspects, but are closely related. Landform is the physical shape of an area resulting from factors such as: past land-forming processes geology, climate, hydrology, soil and ecology. Landform plans are often based on engineering solutions (Turner 2003). Landscape, on the other hand, refers to human experience of an area in the form of visual perception, subconscious response and conscious thought and interpretation. For an overview of the history of landscape evaluation see (Yoji 1999).
While landform is commonly addressed in EIA, particularly for risk assessment and safety, landscape aspects, i.e. the character of the area, its natural integrity and cultural history have less priority. This might however change with rising importance of landscape values (RPDC 2003). Goodey (1994) argues that landscape is becoming more important in statuary planning as public interest in landscape continues to rise. In Tasmania landscape values relating to mining have gained significant importance with closures of mines at Queenstown. This mining area is a well-known example of where landscape values have been hotly debated in respect to mining (Sustainable Development Advisory Council (SDAC) 1996; Aplin 2002).
3.4.2 Rocks and soils
CHAPTER 3 - THE USE OF GIS FOR EIA IN MINING
One important impact related to rock and soils is erosion, which occurs predominantly with surface mining. The process involves weathering, solution corrosion, and transportation. Erosion can be split into wind and water erosion effects. Wind erosion causes air pollution (dust) and can be problematic near settlements (Environment Australia 1998), especially in drier climates. Water erosion may be caused by raindrops (splash erosion) or flowing water (gully or sheet erosion). Potential damage by erosion caused by water includes filling lakes and ponds, blocking stream channels, destroying aquatic habitats and carrying pollutants e.g. heavy metals, bacteria and viruses (Law 1984)
Aspects of erosion are critical in designing large pits and waste dumps. The erosion of topsoil is a particular concern, because topsoil contains fertile material and is essential for vegetative growth, and as well because topsoil production can be a very long process, often occurring over many centuries (Law 1984). Restoration of topsoil and re-vegetation is therefore vital in the rehabilitation process. If waste material is moved to a permanent position, slope angles and stabilisation measures need to be considered (Environment Australia 1998).
3.4.3 Hydrology
The extraction and processing of ore can affect water quality (Ripley, Redmann et al. 1996). Prediction of impacts on water requires comprehensive understanding of the interrelated processes of the water cycle including precipitation, surface runoff, infiltration, transpiration and evaporation. Effects on the water cycle include contamination of surface and groundwater through pollutants, and changes of surface flow volume and velocity through transport of sediments (Law 1984; Ripley, Redmann et al. 1996).
CHAPTER 3 - THE USE OF GS FOR EIA IN miNING
3.4.4 Flora and fauna
Mining impacts on nearly all aspects of natural biological life (Law 1984). Prevention and measurement of effects require the understanding of individual as well as overall aspects such energy flow, species diversity, resilience of ecosystems, and plant succession, process and rates (Ripley, Redmann et al. 1996). The scientific discipline, which explains the relationships between living organisms and their environment, is ecology. It can therefore provide the understanding of the joint effects of mining on flora and fauna (Morris, 1996). An ecosystem can be defined as "a dynamic complex of plant, animal and micro-organism communities and their non-living environment interacting as a functional unit" (Convention on Biological Diversity, United Nations Environmental Program 1992). One important assumption in ecology is that all elements in an ecosystem depend on each other and that a change of one has an effect on the others. The goal of ecological management is to maintain a high level of biodiversity (Morris, 1996). Restoration ecology, a relatively recent developed subfield of ecology, seems to provide the most suitable approaches for restoration of biodiversity in areas disturbed by mining. Davies and Slobodkin (2004) define restoration ecology as "the process of restoring one or more valued processes or attributes of a landscape". Restoration is a complex process, because linkages and changes in ecosystems are non-linear and difficult to predict (Anand and Desrochers 2004). As restoration of the original ecosystem is not always possible, decisions on priorities often include social values (Davis and Slobodkin 2004).
The most important legislation for conservation of ecosystems and biodiversity in Australia is the EPBC Act 1999. On a state level this is incorporated by EMPCA (EMPCA 1994, Part 1, 1(a)). Other strategies in Tasmania, which aim to increase biodiversity and are therefore indirectly related to mining impacts are: the Threatened Species Strategy, Tasmania's Nature Conservation Strategy, the Private Forest Reserves Program and the Regional Forest Agreement (RPDC, 2003). The "Freshwater Project" is a state-wide environmental monitoring program undertaken by DPIWE to monitor water quality and biodiversity of Tasmanian streams.
CHAPTER 3 - THE USE OF GIS FOR EIA IN MINING
was used as a threshold level (DPI WE, 2003). Fish species can indicate the health of
an ecosystem, as presence of adequate fish populations usually indicate that animals
of the lower food chain have recovered as well. However, some more sensitive
macro-invertebrate species have not been successfully re-introduced despite having
reached a satisfactory copper threshold level (DPIWE, 2003). The restoration of fish
communities is also an example, where social values need to be considered, as
fishing contributes to recreational values of the region.
3.4.5 Socio-economic and cultural impacts
The effects of mining operations on socio-economic values depend on the scale of
change brought by the development with respect to existing conditions. An additional
mine nearby other well established mines or other industries and associated services
is likely to be integrated into the existing socio-economic structure with less impact,
compared to a new mine in a remote area. The latter will need to establish new
housing and service and result in a socio-economy with high dependency on a single
mine operator. Alternatively this may lead to broader regional effects through
integration with an existing but widespread infrastructure of nearby towns.
Socio-economic impacts are becoming more relevant for EIA in mining. The principles of
the Code of Environmental Management 2000 include aspects of employment,
community values and cultural heritage. By including these aspects in the EIA
significant impacts can be predicted and avoided for the surrounding communities
(Nicholls 2002).
3.4.6 Acid Mine Drainage
The categories above are not sufficient to explain interrelated effects such as acid
mine drainage (AMD). AMD is a complex interaction of physical, hydrological,
geochemical and microbiological processes, which can occur in base metal, coal and
uranium mining (Harries 1997; Wels, Lefebvre et al. 2003). If the ore body contains
high amounts of sulphide minerals, AMD may occur. Acid drainage can be defined as
the oxidisation of sulphidic minerals (pyrite) from exposure to atmospheric conditions
(Environment Australia 1997). This is a common natural weathering process, but is
often accelerated in mining when large volumes of sulphide rich material are broken
up and exposed (Environment Australia 1997). AMD from oxidation of sulphidic mine
wastes is one of the main environmental issues in the mine industry today (Harries