Diagnosis of combustion with water injection using high-speed
visualization and CFDs
H. Tajima1, Koji Takasaki1, L. Goldsworthy2, T. Takaishi3, A. Strøm1 and R. Masuda1 1 Kyushu University, Kasuga-koen 6-1, Kasuga-city, Fukuoka-pref., 816-8580, Japan. E-mail: [email protected]
Telephone: +(81) 92 583 7592 Fax: +(81) 92 583 7593
2
Australian Maritime College, PO BOX 986, Lauceston 7250, Tasmania, Australia.
E-mail: [email protected] Telephone: +(61) 3 63354774
Fax: +(61) 3 63354720
3Mitsubishi Heavy Industries, Ltd., Fukahori-machi, 5-chome, Nagasaki-pref., 851-0392, Japan. E-mail: [email protected]
Telephone: +(81) 95 834 2440 Fax: +(81) 95 834 2445
Abstract. Direct water injection (DWI) was newly introduced as a promising NOx reduction method for
ma-rine diesel engines thanks for its easy installation requiring no major engine modification. Its true potential, however, remains uncertain for lack of both numerical and experimental investigations. In this study, the ef-fect of DWI on decreasing flame temperature was objectively examined by two simulation codes of different combustion models and by flame temperature measurement in a visual engine based on the two-colour method using CMOS type camera. Simulation results were in good agreement with the measurement results in both flame propagation and flame temperature so that NOx reduction of DWI could be clearly explained. Moreover, it was found that DWI could result in more complicated combustion process than expected since preceding water vapour greatly affected the propagation and the air entrainment of the fuel spray.
1. Introduction
The reduction of NOx emission is an urgent matter for marine diesels against tightening regulations. For NOx reduction, water injection into a combustion chamber is often used in medium- and large-sized engines with various forms, such as water-emulsified fuel injection, stratified fuel-water injection (SFWI)[6] and in-dependent water injection. In the former two, water is injected from the same nozzle holes as those of fuel, so that added water lengthens injection period and may worsen combustion especially in after-burning period. On the other hand, the third one, usually called Direct Water Injection (DWI), uses additional water nozzles and it has much higher potential to achieve drastic NOx reduction without losing engine performance thanks to its wider flexibility of water distribution in both time and space aspects.
minimize the space requirements for the installation and the fuel and water spray propagate near co-axially around the cylinder centre. With this DWI configuration, it is reported that NOx value reduces by 50 -60 % injecting water of typically 40 - 70% of injected fuel. These figures are within expectation for emulsified fuel injection or SFWI. Considering that water nozzles generally have shorter lifetime than fuel nozzles and the DWI with a single injector body likely requires higher maintenance cost than the other water injection sys-tems, one can say the true potential of the single-injector type DWI should be examined in detail.
In this study, single-injector type DWI systems were originally built and installed in a constant volume combustion chamber and in a visual test engine to observe its spray propagation and combustion phenomena. Two-colour method was applied to measure the combustion temperature and to estimate the NOx reduction of DWI by the decrement of combustion temperature. Adding to it, numerical simulation by widely used CFD codes; KIVA III and StarCD, were executed to examine the DWI combustion process both quantitatively and qualitatively. Combustion temperature, NOx distribution, NOx emission and indicated mean effective pres-sure were used as the indices. The experimental data also gave solid background to those results.
2 Measurement Apparatus and Experimental Procedures
2.1 Constant volume combustion chamber
A constant volume combustion chamber (CVCC) was used to check the basic behaviour of DWI spray propagation. This chamber has electric furnace heaters inside enabling self-ignition of fuel spray and full ob-servation of spray propagation process. The chamber has cylindrical shape with 150 mm bore and 370 mm length. In place of the one injector with double needles, fuel injector and water injector are separately mounted on the vessel top confronting their tips together. The sprays from each sole nozzle hole are injected down and propagate along the chamber axis in the quiescent air at the condition of 2.5 MPa and 950 K [5].
2.2 Visual test engine
A medium-speed DI diesel engine was used in the visualization test of actual DWI combustion. Its dimen-sions and running conditions are in Table 1 and optical layout is shown in Fig.1. One of the two injectors making so-called “side-injection” configuration was removed to eliminate interference of the combustion process of the opposing spray and to view the spray flames more clearly.
Unlike CVCC, in-cylinder air swirls around the cylinder axis with relatively high intensity of about 3.5 swirl ratio. The number of firing cycles was also limited to less than 10 cycles because spray impingement and smoke adhesion on the piston surface dimmed flame images quickly. CMOS sensor camera (REDLAKE, HG100K) was used for flame visualization and temperature measurement.
Table 1. Dimensions and running conditions of visual engine
Engine type NDT19/35 2-stroke cycle DI diesel, Uni-Flow scavenging Bore×Stroke×Cylinders φ190mm×350mm×1cylinder Compression ratio 12.0
Indicated mean pressure Pmi = 1.35 MPa Charge pressure 0.28 MPa
Circumferential injector location
Reflecting mirror Transparent
piston crown Cylinder head
High-speed camera
Scavenging
air Variable geometry
[image:3.612.114.511.82.326.2]scavenging vanes
Fig. 1. Schematics of visual engine
2.3 DWI nozzles and injection system
Single-injector type DWI systems were designed and constructed for this study. In the CVCC, two injec-tors of a single nozzle hole come in contact with each other at their tips to simulate combined spray trajecto-ries of DWI. Both injectors were electronically controlled to make it easy to synchronize all the data acquisi-tion in one injecacquisi-tion event. Fuel nozzle has φ0.16 mm single hole and hydraulic boost was applied to set fuel injection pressure at 50 MPa. Water spray came out through a φ0.23 mm nozzle hole under 25 MPa of injec-tion pressure.
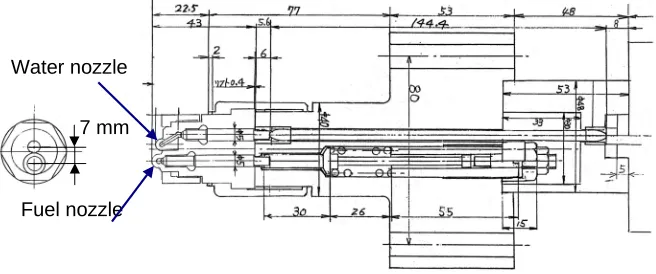
In the visual engine, true single-injector type DWI had to be applied because of space limitation. Fig.2 is a cross-sectional view of the injector body and the injection nozzles for fuel and water. Both nozzles had 4 holes drilled within 40 degrees of conical angle. Hole diameter for water was φ 0.36 mm and the diameter for fuel was φ 0.23 mm. For compatibility with a conventional construction, the fuel injection line was mechani-cally controlled to 100 MPa of injection pressure, whereas water injection line was electronimechani-cally actuated un-der 26 MPa or 14 MPa of injection pressure through logic valves synchronized with engine rotation.
Water nozzle
Fuel nozzle 7 mm
[image:3.612.132.460.549.686.2]3 Analysis and Calculation Procedures
3.1 Temperature measurement by two-color method
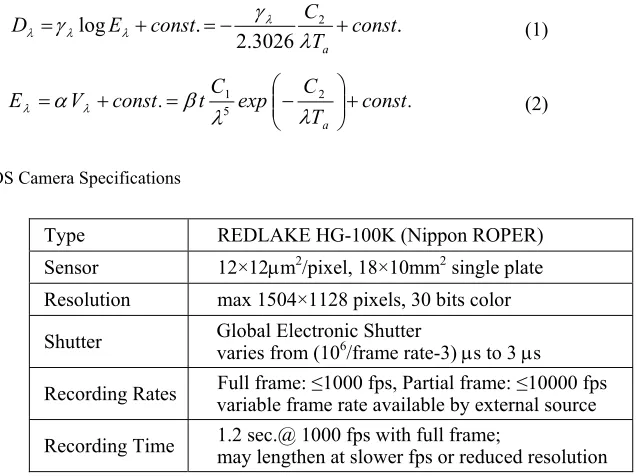
To estimate the NOx reduction effect of DWI system from the short-running visual test, two-colour method was applied to the images taken by the CMOS camera. Since the temperature measurement goes with flame visualization, luminance temperature: Tais normally determined on flame colour information. In case of film camera, Ta is calculated on the following equation (1). This shows the relation between film colour density:
Dλ and exposure value: Eλ at wavelength: λ. γλ is a constant for photosensitivity of the film and C2 stands for the second radiation constant in Plank’s law. In solid-state imagers like a CMOS camera in this study, signal voltage is proportional to the input photon quantity and the relation is represented by equation (2) where C1 and t stand for the first radiation constant and exposure time with two coefficients of α and β. Vλ is a digital value from 0 to 255 in case of 24 bit colour format representing RGB component. It is necessary to introduce an effective wavelength against the RGB system of a spectral sensitivity [4] and it was selected as the stan-dard wavelength for RGB colours in this study after several confirmations. It should be noted that the lower limit of temperature analysis is as high as 1700 K even if the upper limit is set to modest 2500 K because the effective range of Vλ is no more than 2×10² due to dark current of a solid-state imager.
(1) . 3026 . 2 .
log 2 const
T C const E D a + − = + = λ γ γ λ λ λ λ (2) . const T C exp C t . const V E a + − = + = λ λ β α λ
λ 5 2
[image:4.612.137.459.337.575.2]1
Table 2. CMOS Camera Specifications
Type REDLAKE HG-100K (Nippon ROPER)
Sensor 12×12µm2/pixel, 18×10mm2 single plate Resolution max 1504×1128 pixels, 30 bits color Shutter Global Electronic Shutter varies from (106/frame rate-3) µs to 3 µs Recording Rates Full frame: variable frame rate available by external source ≤1000 fps, Partial frame: ≤10000 fps Recording Time 1.2 sec.@ 1000 fps with full frame; may lengthen at slower fps or reduced resolution
3.2 Numerical simulations
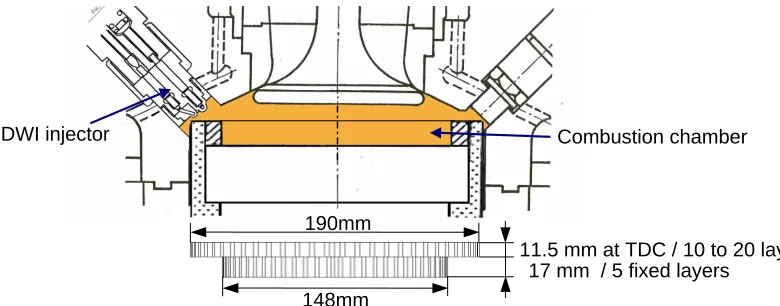
Reitz-Diwakar model [2] was used for spray breakup, with reduced breakup timescales for the water spray to compensate for the lower value of water viscosity compared with fuel. Both simulations assumed fully mixed combustion in any burning computational cell, with the combustion rate determined by the concentration of fuel and air as well as the local turbulent mixing rate. Computational grids used with both codes were rather coarse in favor of short calculation time. Fig. 3 shows combustion chamber configuration of the visual engine and a radial computational grid of 19,800 cells used in the KIVA III simulations. For the StarCD simulations a radial mesh with further refinement in the region of combustion and NO formation was used, resulting in a grid of some 72,000 cells.
DWI injector Combustion chamber
190mm
148mm
[image:5.612.112.502.205.358.2]11.5 mm at TDC / 10 to 20 layers 17 mm / 5 fixed layers
Fig. 3. Computational grid in KIVA III and close-up of combustion chamber
4 Results and discussions
4.1 DWI visualization in CVCC
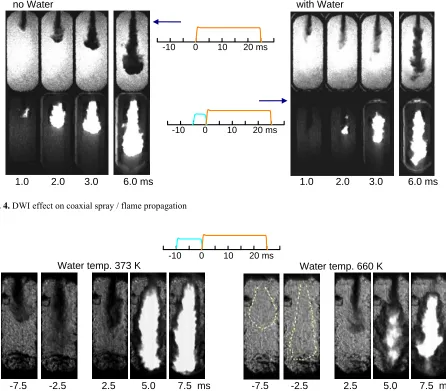
In DWI systems on the market, water injection precedes fuel injection and is expected to form higher spe-cific heat area before the trajectory of fuel injection. However, when the fuel injection immediately follows after water injection, the momentum of water vapour can affect the propagation of fuel spray as well as com-bustion temperature. This effect was examined in Fig.4 using rather small amount of water injection. The up-per images are the ones through back-diffused-laser (BDL) light [6] and the lower were luminous flame cap-tured simultaneously. By BDL techniques, liquid or solid part of the spray can be identified instead of flame existence. As described in the figure, water injection lasted for 5 ms and was followed by the fuel (MDO) in-jection lasting for 25ms, which means water mass was equivalent to 28 % of fuel mass.
no Water with Water
-10 0 10 20 ms -10 0 10 20 ms
[image:6.612.103.530.109.301.2]1.0 2.0 3.0 6.0 ms 1.0 2.0 3.0 6.0 ms
Fig. 4. DWI effect on coaxial spray / flame propagation
-7.5 -2.5 2.5 5.0 7.5 ms
Water temp. 660 K -10 0 10 20 ms
-7.5 -2.5 2.5 5.0 7.5 ms
Water temp. 373 K
Fig. 5. Effect of water spray momentum along fuel spray trajectory
4.2 DWI visualization and temperature measurement in visual engine
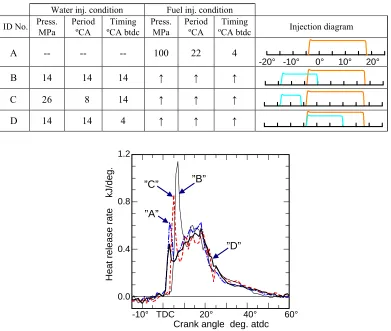
In the engine experiment, water mass fraction was set to 50 % of the injected fuel instead of water pressure. Injection duration was 8 degrees of crank angle (CA) at 14 MPa and 14 degrees CA at 26 MPa respectively. Injection occurred at 14º CA btdc when preceding vapour cloud required. 4º CA btdc of injection timing was also selected to see the effect of simultaneous propagation with fuel. The combination of 14MPa and 14 CA btdc was a reference condition of DWI experiment. Test conditions are summarized and identified in Table 3.
4.2.1 Luminous flame propagation
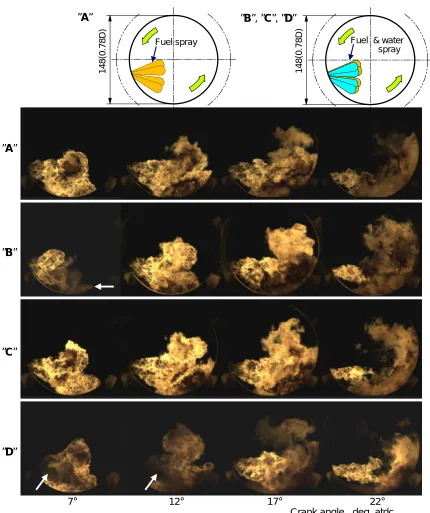
[image:6.612.99.545.110.501.2]condition, so that all images are not reproductions of true flame contrast. Difference from the flame propaga-tions in the CVCC test can be said as impressive and observation results are itemized as follows.
• Sprays injected across the swirl flow are bent down for swirl direction as shown in the A case, whereas the ones injected tangentially to the swirl are accelerated and less bent. So the two groups get together and form merged flame of an asymmetric plume shape.
• Spray penetration does not seem to be enhanced so much with water injection in the existence of swirling flow. Preceding water injection makes the sprays across the swirl flow moving more straight to their injected direction. However, once advancing into the other half of the chamber and becoming near tangential to the swirl, these spray flames bend quickly towards the direction of swirl rotation.
• As in the B case, overlap between the injection end of preceding water and the injection start of fol-lowing fuel cools down the tip of fuel spray too much (see the arrow in the figure), which leads to longer ignition delay and higher premixed combustion peak as also shown in Fig.6.
• Simultaneous water injection of the D case shows no ignition delay thanks to water’s slower spray speed and water spray can be directly fed during fuel injection (see the arrows). All in all, this injec-tion pattern seems to have more potential to reduce combusinjec-tion temperature and NOx emission.
[image:7.612.114.505.349.680.2]• After-burning phase captured in the most right images looks hardly affected by DWI as displayed in Fig.6. Fuel sprays remaining at the injection end are more stretched and can have more air around their tips because the other fuel injected before them has been accelerated by water spray.
Table 3. Tested conditions for no water case and DWI configurations in visual engine
Water inj. condition Fuel inj. condition Press. Period Timing Press. Period Timing
ID No. MPa ºCA ºCA btdc MPa ºCA ºCA btdc Injection diagram
A -- -- -- 100 22 4
B 14 14 14 ↑ ↑ ↑
C 26 8 14 ↑ ↑ ↑
D 14 14 4 ↑ ↑ ↑
-20° -10° 0° 10° 20°
”A”
”B”
”D” ”C”
1.2
0.8
0.4
0.0
-10° TDC 20° 40° 60° Crank angle deg. atdc
Heat release rate kJ/deg.
Fuel & water spray Fuel spray
”B”, ”C”, ”D”
”A”
Φ
148(0.7
8
D)
Φ
148(0.7
8
D)
”A”
”B”
”C”
”D”
Crank angle deg. atdc
[image:8.612.82.512.90.603.2]7° 12° 17° 22°
Fig. 7. Flame propagations of no water case and tested DWI configurations
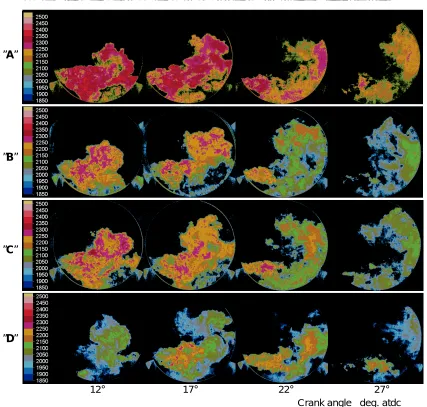
4.2.2 Flame temperature distribution
• Higher temperature area in no water case A covered the base of sprays as well as their tips. Maxi-mum temperature reached to as high as 2400 K, so that NOx could generate briskly during the early combustion phase. This means water supply into the vicinity of spray roots is desirable.
• Flame temperature was clearly dropped by DWI system. For case D, for example, flame temperature reduction was from 250 to 300 K with water having 50 % of the fuel mass.
• In overlapped DWI of case B, hotter area observed around flame front was not as much as no water case and ,as expected, hot spots remained around the spray roots.
• In no overlap case C, hotter area remained around the spray tip and also in middle of the spray body. Maximum temperature on the hottest spot is nearly the same as no water case.
• Simultaneous DWI of case D looked most effective to reduce NOx emission by showing drastic temperature drop especially in the early combustion stage, whereas flame temperature around the spray root slightly rose up again in the after-burning period.
• Newly introduced CMOS camera proved to be useful not only for the flame visualization but also for the temperature measurement on two-colour method. 8-bit colour resolution, however, strictly lim-ited its dynamic range so much that the lower temperature zone in case D was almost missed.
”A”
”B”
”C”
”D”
12° 17° 22° 27°
[image:9.612.99.526.276.683.2]Crank angle deg. atdc
4.3 Simulation results on KIVA III and StarCD
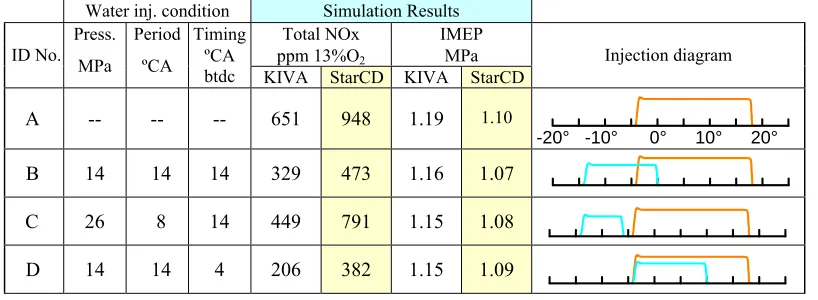
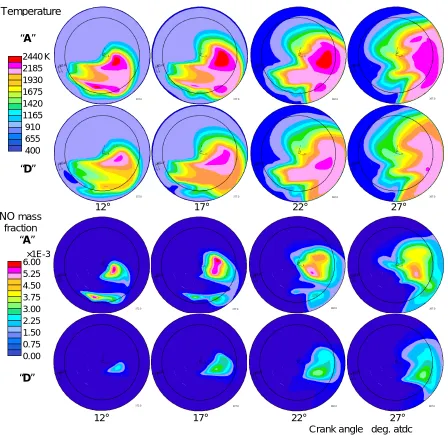
Two well-acknowledged simulation codes, KIVA III and StarCD, were applied to the measurement results objectively. Table 4 is a summary of NO emissions and indicated mean effective pressures (IMEP) predicted by both codes. For its tracking ability of any specific species, the StarCD simulations for case A and D are featured from Fig. 9 to 11 at the horizontal plane 5 mm below the cylinder head. Combustion temperature and NO concentrations in Fig. 9, injected water distributions in Fig.10 and soot formation/consumption rates are in Fig.11. The results can be itemized as follows.
• The trend of NOx reduction with the different DWI configurations, as successfully predicted by both codes, is generally consistent with the measured temperatures. Both codes show that the case of maximum overlap of water and fuel injection, case D, gives the greatest NO reduction. Early water injection with high injection pressure, case B, gives the least NO reduction.
• NO generating area is around the boundary between the high temperature zones and the area of high oxygen concentration.
• The predicted NO values are higher with StarCD than with KIVA III, but their trends in NO reduc-tion with water injecreduc-tion are similar and show a trade-off between engine output and NOx emission. Case D shows the greatest NO reduction for both codes. (68% in KIVA III while 60% in StarCD)
• Simulated temperature values are similar to measurements, around 2400K maximum for case A. The difference between predicted maximum temperature for case A and case D, as predicted by StarCD, decreases uniformly from 250K at 12deg ATDC to 80K at 27deg ATDC, in accord with the meas-ured temperature reductions.
• For case C, the injected water penetrated well ahead of the burning fuel spray, away from the NO formation regions. NO reduction in this case is mainly due to reduction in unburned gas temperature due to water evaporation. For case D, the injected water vapour is located in NO-forming regions, especially early in the combustion.
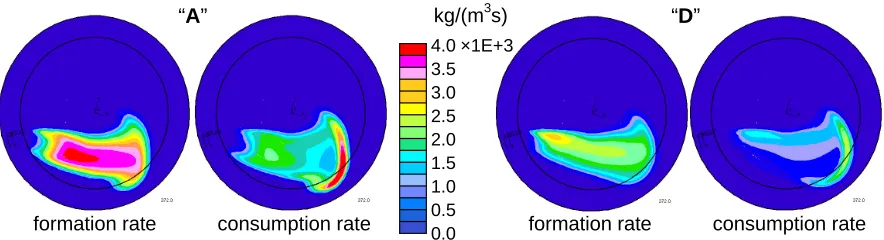
• Water at the periphery of the spray can lead to reduced soot consumption rates due to reduced tem-perature. However, the presence of water in the core of the fuel spray can lead to reduced tempera-ture in the regions of soot formation. Simulations using the Hiroyasu soot model [1] showed net soot reduction with case D (1.81 g/m3) compared with the no water case (2.85 g/m3). This appears to be due to reduced soot production rates early in the combustion process, as shown in Fig. 11.
[image:10.612.105.514.550.700.2]• The predicted heat release rate for case D reached its maximum value of 1.6MW at 12 deg atdc, 4 deg earlier than case A. This may be due to increased air entrainment into the fuel spray, due to the simultaneous presence of the water spray. The greater early heat release rate offsets efficiency losses due to energy absorption by the injected water. In all four cases, total heat release as simulated with StarCD is equivalent to the mass of fuel multiplied by the lower calorific value.
Table 4. Simulation results for engine performance in tested engine conditions
Water inj. condition Simulation Results Press. Period Timing Total NOx IMEP
ppm 13%O2 MPa
ID No. MPa ºCA ºCA
btdc KIVA StarCD KIVA StarCD
Injection diagram
A -- -- -- 651 948 1.19 1.10
B 14 14 14 329 473 1.16 1.07
C 26 8 14 449 791 1.15 1.08
D 14 14 4 206 382 1.15 1.09
“A”
“D”
Temperature
“A”
2440 K 2185 1930 1675 1420 1165 910 655 400
12° 17° 22° 27°
“D”
NO mass fraction
6.00 5.25 4.50 3.75 3.00 2.25 1.50 0.75 0.00
×1E-3
12° 17° 22° 27°
[image:11.612.80.528.91.526.2]Crank angle deg. atdc Fig. 9. Predicted distribution of temperature and NO mass fraction in case A case D (StarCD)
Injected water vapour
:
“D”12° 17° 22° 27°
Crank angle deg. atdc 0.100
0.0875 0.0750 0.0625 0.0500 0.0375 0.0250 0.0125 0.0 mass fraction
[image:11.612.85.531.555.680.2]“A”
4.0 3.5 3.0 2.5 2.0 1.5 1.0 0.5 0.0
“D”
kg/(m3s)
×1E+3
[image:12.612.87.529.91.211.2]formation rate consumption rate formation rate consumption rate
Fig. 11. Predicted soot formation and consumption rates for case A and case D at 12 degrees atdc (StarCD)
Conclusions
Characteristics of the DWI system with double-needle injector were investigated through visualization tests and also through detailed simulations. The following conclusions were derived.
• In quiescent air of CVCC, piloting water injection greatly reduced the drag force on the fuel spray from the ambient gas, so that the spray sharpened its front and lengthened its penetration.
• Simultaneous DWI looked most effective to reduce NOx emission by showing drastic temperature drop in the early combustion stage, whereas flame temperature around the spray root slightly rose up again in the after-burning period.
• CMOS camera proved to be useful not only for the flame visualization but also for the temperature measurement by the two-colour method. 8-bit colour resolution strictly limited its dynamic range.
• NO reduction effect by DWI system was clearly demonstrated by the numerical predictions with two different CFD codes.
• Tendencyof NOx reduction with the different DWI configurations was correctly reproduced numeri-cally. The IMEP prediction showed the trade-off relation between engine output and NOx emission.
• For case C, the injected water penetrated well ahead of the burning fuel spray, away from the NO formation regions. NO reduction in this case is mainly due to reduction in unburned gas temperature due to water evaporation. For case D, the injected water vapour is located in NO-forming regions, especially early in the combustion.
References
[1] Hiroyasu H. and Nishida K (1989) Simplified three-dimensional modelling of mixture formation and combustion in a DI diesel engine. SAE 890269
[2] Reitz RD and Diwakar R (1987) Structure of High-Pressure Fuel Sprays. SAE Paper 870598
[3] Reitz RD and Bracco FV (1986) Mechanism of Breakup of Round Liquid Jets. Encyclopedia of Fluid Mechanics: ch.10, Gulf Publishing Company, Houston
[4] Shiozaki T, Nakajima H, Yokota H and Miyashita A (1998) The visualization and its analysis of combustion flame in a DI diesel engine. SAE Technical Paper Series 980141 pp25-38.
[5] Takasaki K, Tajima H, Nakashima M and Ishida H (2002) Visual Study on Combustion of Trouble-making Bunker Fuel. Bulletin of MESJ, Vol.30, No.1, pp.2-9