Growth of the southern elephant seal
Mirounga leonina
(Linnaeus 1758) at Macquarie Island.
by
Cameron Marc Bell
B .V. Sc. (Hons)
University of Melbourne
A thesis submitted in fulfilment of the
requirements for the degree of Master of Science,
University of Tasmania
Declaratio n
I hereby declare that this thesis contains no material which has been accepted for the
award of any degree or diploma in any university or institution, and that to the b est
of my knowledge, this thesis contains material solely by the author except where
due acknowledgement has been made.
Authority of access
This thesis may b e made available for loan and limited copying in accordance with
the Copyright Act 1968.
Cameron M. Bell
Abstract
Body growth was an essential component of early biological research undertaken to
develop sustainable harvesting methods of the southern elephant seal (Mirounga leonina Linnaeus 1 758). Since slaughter ceased in most areas earlier this century, a substantial decline in numbers of elephant seals has been recognised at several of the
main breeding sites, stimulating interest in life-history attributes which may help
provide an explanation for these declines. Growth of elephant seals from the
Macquarie Island population was investigated to quantify the current growth pattern
and to compare with the stable population at South Georgia, where elephant seals
were known to be larger, grow faster, and breed earlier.
A method was developed to indirectly measure body mass using photogrammetry.
Predictive models were developed using photographic images alone, but when
compared with models based on measured morphological characteristics, the best
predictor of body mass was a combination of body length and girth squared.
Growth during the first foraging trip was described and found to reflect the
hindrances of early life at sea. Growth was hypothesised to comprise primarily of
adjustment to body composition, rather than increase in net body size. Both sexes
may exploit similar marine resources during the first foraging trip, as no significant
difference in body growth was found. Interspecific comparison suggested that
southern elephant seals grow considerably more than northern elephant seals (M
angustirostris) during this period, and that this may be related to prey abundance and distribution.
A cross-sectional growth study was undertaken for females up to 15 years of age.
Dental cementum layers were counted to estimate the age of some animals, which
proved to b e a relatively accurate and useful technique. The snout-tail length of
adult Macquarie Island cows has increased significantly since the 1 950s and 1 960s,
and is now similar to that of the current South Georgia population. The temporal
changes at in snout-tail length at Macquarie Island are consistent with either a
population equilibration process or long-term environmental change reducing
population density. These findings provide little supporting evidence for a particular
cause of the Macquarie Island population decline, but the most likely scenario is that
several factors are implicated, these having resulted in changes in marine resource
availability.
Body growth of s outhern elephant seals is determined by many factors, but prey
abundance and distribution are fundamental influences on all growth stages. Other
factors which m ay play a role include harem disturbances, behaviour of weaners,
disease, juvenile body size and stored energy reserves.
Acknowledgements
My two supervisors, Mark Hindell and Harry Burton must firstly be thanked for
their time, encouragement and advice. Harry presented me with the opportunity to
visit Macquarie Island, and after an afternoon's introduction to working with
southern elephant seals, returned to Australia on the Icebird and left me to my own
devices. He provided much support, encouragement and laughs by phone and Email
whilst undertaking field work, and then discussion and thoughts whilst writing up.
Mark helped develop the research project and I am most grateful for him taking me
on as a postgraduate student. His encouragement, ideas, endless statistical
assistance, editorial advice and house were much appreciated. The Hindell family
dog, Otto, also provided much entertainment during the final writing stages whilst
his family was away.
Field work during the winter of 1 994 would have b een impossible without the
dedication and support of Joan Russell (station leader). We shared a common love
of elephant seals, and this was our incentive on those cold windy days. Computer
whiz Al Rooke, radio technician Dale Main and dieso John Toms were a big help
also. Rupe Woo d ' s anaesthetic advice was invaluable for the field work. All the
other 1 994 wintering ANARE expeditioners are thanked for their assistance, support
and companionship.
The 1 994/95 summer fieldwork was an intensive, busy time, but was made
enjoyable by the companionship of newly formed friends Paul "Tussock" Davis,
Mary-Anne Lea, Sam Thalman and Christo Baars, as well as our trusty red tractor,
"The Son ofFergus". Mary-Anne also helped with the teeth preparation, spending
many hours in the cold dungeon of the Antarctic Division, sectioning teeth. Late
nights on the computer in the biolab were also made possible by Aretha Franklin
CDs. Thanks also to Clive McMahon and other 1 994/95 ANARE expeditioners for
their assistance.
Other Australian Antarctic Division personnel were instrumental in this study. Brett
Gogoll's time, CAD skills and Emails, combined with Attila Vrana' s technical skills
enabled the photogrammetry study to be undertaken. John van den Hoff helped get
equipment organis ed for the field work. Dave Slip' s useful conversations stimulated
thought for the thesis. The Antarctic Division's logistic support was much
appreciated, as without which, this study could not have been undertaken.
Debbie Bramich (Australian Nature Conservation Agency) provided much
appreciated advice on processing extracted seal teeth. The Department of Anatomy
(University of Tasmania) made available teeth sectioning equipment and I am
grateful for Rod T eague's interest and assistance with this. Department of Zoology
(University of Tasmania) staff were most helpful in providing equipment and
advice. Mike Castellini, Dan Crocker, and three anonymous reviewers must be
acknowledged for their comments on submitted manuscripts. B arrie Wells, my
current employer, is to be thanked for being as flexible as he was with time off for
writing and lab work, and also for the opportunity to continue work with seals. The
Tasmanian Parks and Wildlife Service (Department of Environment and Land
Management) is thanked for permission to work on Macquarie Island and southern
elephant seals.
My family kept in contact regularly with faxes whilst I was away and for this, I am
most grateful. Their mail (including my brother' s music tapes) at the end of winter
was much looked forward to and appreciated.
My wife Jenny, who if it hadn't been for our respective studies on Macquarie Island
I would not have met, is credited for her encouragement and editorial assistance,
which made getting the final draft together possible. This is a favour I will hopefully
have to return soon after the arrival our child, whose in utero activity currently resembles a fighting bull elephant seal.
Last but not least, the southern elephant seals of Macquarie Island, which despite
their smell, noises, bad habits and at times violent behaviour, are wonderful animals
to work with and beautiful animals just to sit and ponder.
Table of contents
Declaration
Authority of access 11
Abstract 111
Acknowledgments v
Table of contents viii
List of figures Xll
List of tables XIV
CHAPTER ONE : INTROD UCTION. 1
1.1 The genus. 3
1.2 Distribution of southern elephant seals. 4
1.3 Status of southern elephant seals. 4
1.4 L ife-time growth of southern elephant seals and life history. 6
1.5 Growth studies of southern elephant seals. 10
1.6 Why study growth? 12
1.7 Aims and structure of the study. 14
CHAPTER TWO : INDIRECT AND DIRECT METHODS OF ESTIMATING MORPHOLOGICAL CHARACTERISTICS.
2.1 Introduction. 2.2 Methods.
2.2.1 Photographic measurement. 2.2.2 Field measurements.
2.2.3 Calculations. 2.2.4 Data analysis. 2.3 Results.
2.3.1 Class non-specific. 2.3.2 Post-lactation cows.
2.3 .3 Yearlings. 32 2.3 .4 Comparison of morphological characteristics and
photographic measurements. 32
2.4 Discussion. 33
2.4.1 Photographic variables only. 33
2.4.2 Morphometric variables only. 34
2.4.3 Photographic and morphometric variables combined. 36
2.4.4 Comparison with other studies. 36
2.4.5 Recommendations. 38
2.5 Summary. 40
CHAPTER THREE: GROWTH DURING THE FIRST FORAGING TRIP. 41
3.1 Introduction. 41
3.2 Methods. 44
3.3 Results. 45
3.3.1 Growth and time at sea. 45
3.3.2 Effect of birth and departure mass. 52
3.3.3 Haul-out pattern. 52
3.4 D iscussion. 54
3 .4.1 Growth and body composition. 55
3 .4.2 Short-term effects of first year body size. 56 3 .4.3 Development of sexual dimorphism. 59 3 .4.4 Haul-out pattern during first year of life. 60 3 .4. 5 Other determinants of growth. 61
3 .4. 6 Interspecific comparison. 61
3.5 S ummary. 64
CHAPTER FOUR: LIFE-TIME GROWTH AND IMPLICATIONS FOR POPULATION DYNAMICS.
4.1 Introduction.
65
65
4.2 Methods. 68
4.2. 1 General field work. 68
4.2.2 Age determination. 69
4.2 . 3 . Data. 7 1
4.2.4 Growth analysis. 72
4.3 Results. 73
4. 3 . 1 Age determination. 73
4. 3 . 2 Growth of females. 75
4.3 .2. 1 Macquarie Island, 1 994 to 1 99 5 . 7 5 4.3 .2.2 Macquarie Island, 1 95 1 to 1 965. 75 4. 3 .2.3 South Georgia, 1 948 to 1 95 1 . 75 4.3 .2.4 Macquarie Island, temporal changes. 80 4.3 .2.5 Previous interpopulation differences. 80 4.3 .2.6 Current interpopulation differences. 80
4.3 .3 Growth of males. 83
4.4 D iscussion. 83
4.4. 1 Age determination. 83
4.4.2 Adult body size. 89
4.4.2. 1 Suitability of Gompertz growth models. 89 4.4.2.2 Adult size of southern elephant seals. 90
4.4.3 Growth rate. 93
4.4.4 Age at first breeding for females. 94
4.4.5 The population decline. 95
4. 5 Summary. 1 00
CHAPTER F IVE: GENERAL DISCUSSION. 1 0 1
5 . 1 Measurement of growth. 1 04
5 . 2 Foetal growth. 1 06
5 . 3 Postnatal, preweaning growth. 1 07
5 . 3 . 1 Maternal influences : mothering ability and energy 1 07 reserves.
5 . 3 .2 Milk production. 108
5. 3 . 3 Harem disturbance. 1 1 0
5 . 3 .4 Disease. 1 1 1
5 . 4 Postweaning fast. 1 1 2
5 . 5 First foraging trip. 1 1 2
5 . 6 Adult growth. 1 14
5 . 6 . 1 Influence of juvenile growth. 1 14
5 . 6. 2 Prey abundance, energy density and distribution. 1 14
5 .6 . 3 Disease. 1 1 5
5 .7 Population ecology. 1 1 6
5 . 7. 1 Interpopulation differences in body size. 1 1 6 5 . 7 . 2 Explanation of the population decline. 1 1 8
5 . 8 Further research. 1 1 8
References 1 2 1
Appendix 1 . Calculation o f a section volume for estimation of body volume. 13 9
Appendix 2. Microscope slide preparation. 140
List of Figures
Figure 1 . 1 . The distribution of southern elephant seals, showing breeding and
moulting sites (from Bryden 1 993). 5
Figure 1 .2. Straight-line body length growth curves for the southern elephant
seal at Macquarie Island ( 1 950s and 1 960s) and South Georgia ( 1 948-5 1 ) (from
Laws 1 984). 1 1
Figure 1 .3. Map of Macquarie Island (after Selkirk et al. 1 990). 1 6 Figure 2.1. Diagrammatic representation of height measurements (HI to H6)
made from the side view.
Figure 2.2. The relationship between body mass and snout-tail length/girth for
model 6 .
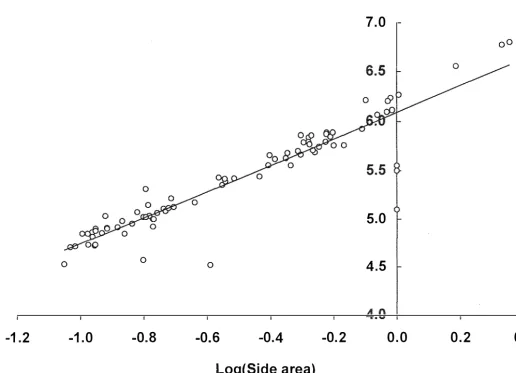
Figure 2.3. The relationship between body mass and side area for model 4.
Figure 3.1. Logistic curve fitted to illustrate the relationship between return mass
and age at haul-out after the first foraging trip for both sexes.
Figure 3.2. Change in body mass during the first 1 2 months of life for males and
females.
Figure 3.3 Linear relationship of mean daily growth rate and estimated departure
23
30
31
47
48
mass for female animals only. 50
Figure 3.4. Histogram showing estimated duration of the first foraging trip. 5 1
Figure 3.5. Comparison of growth of southern (this study) and northern elephant
seals (Thorson and Le Boeuf 1 994). 62
Figu re 4. 1 . Gompertz growth curve and data for the 1 994-95 Macquarie Island
female elephant seal population (post-one year of age). 76
Figure 4.2. Gompertz growth curve and data for the 1 95 1 -65 Macquarie Island
population (post-one year of age). 78
Figure 4.3. Gompertz growth curve and data for the 1 948-5 1 South Georgia
female elephant seal population (post-one year of age). 79
Figure 4.4. Predicted Gompertz growth curves and 95% confidence intervals . 8 1
Figure 4.5. Linear growth model for males between 1 2 and 48 months of age. 84
Figure 5.1. Factors potentially affecting growth of southern elephant seals. 1 02
Figure 5.2. Simplified relationship of predators and prey in the Antarctic marine
ecosystem (from Bryden 1 993). 1 03
List of Tables
Table 2.1. Variables, abbreviations and units used in models.
Table 2.2. Models for mass estimation derived from a combination
of yearlings, post-lactation cows and other animals.
Table 2.3. Models for mass estimation for post-lactation cows.
Table 2.4. Models for mass estimation for yearlings.
Table 2.5. Comparison of r values for power models for the present study
(utilising all ages and classes), Haley et al. ( 1 99 1) and Modig ( 1 995).
Table 3. 1 . Comparison of growth parameters for animals returning early (2-4
months post-departure); mid (5-7 months post-departure) or late (8- 1 1 months
post-departure) from their first foraging trip.
Table 4. 1 . Age structure for subj ects (a) that were aged using teeth and (b) used
for growth models (known and estimated ages).
Table 4.2. Snout-tail lengths recorded for female age classes, and those predicted
using the Gompertz model for the 1 994-95 Macquarie Island population
Table 4.3. Gompertz growth model parameters, associated standard errors, and
95% confidence interval range for asymptotic length of adult females.
Table 4.4. Estimated snout-tail length of 4 year old males, calculated using a
linear model.
Table 4.5. Effect of correcting for underestimation of age and using known-age
animals only on female Gompertz model parameters.
Table 4.6. Comparison of asymptotic snout-tail lengths between South Georgia
and Macquarie Island adult females.
XlV 2 1
27
28
29
3 7
5 3
74
77
82
85
88
CHAPTER ONE
INTRODUCTION.
The southern elephant seal (lvfirounga leonina Linnaeus 1 7 5 8), is the largest pinniped and one of the most sexually dimorphic of all mammals (King 1 983; Le
Boeuf and Laws 1 994). Capable of diving to over 1 500 m depth and for up to 120
minutes, they dive longer and deeper than other pinnipeds (Hind ell et al. 1 99 1 a; McConnell and F edak 1 996). Travelling over 2000 km to reach foraging grounds,
southern elephant seals have been estimated to travel up to 1 30 km per day,
spending 10 months of every year at sea (Hindell et al. 1 99 1 b; McConnell et al.
1 992; Fedak et al. 1 994). Whilst at sea, they spend 90% of their time submerged,
with only minutes at the surface between dives (Hindell et al. 1 99 1 a; McConnell and Fedak 1 996). Such biological characteristics allow southern elephant seals to
have a maj or impact o n prey species in the Southern Ocean, with estimates of
approximately 5 . 6 million tonnes of squid and 1 . 8 million tonnes of fish being
consumed per annum by the total population (McCann 1 98 5). The predominantly
oceanic existence of southern elephant seals however, makes scientific studies
difficult to undertake.
Breeding from S eptember and November on subantarctic islands, females spend
approximately 4 weeks ashore giving birth and lactating; males may remain ashore
for up to 8 weeks (Ling and Bryden 1 98 1 ). Females and males then spend a further
3 to 4 and 8 to 9 weeks respectively, ashore between January and April whilst
moulting (Laws 1 960a; Hindell and Burton 1988a). During these haul-out periods,
southern elephant seals fast completely, utilising energy stores in their bodies that
have accumulated whilst foraging at sea (Slip et al. 1 992a; Boyd et al. 1 993 ; Hindell
et al. 1 994a).
Southern elephant seals were slaughtered for over 1 00 years at all maj or breeding
sites, with in excess of one million individuals estimated to have b een taken (Laws
1 994). They were sought after for high quality oil derived from their b lubber, and
were taken in an uncontrolled manner. At Macquarie Island, they were taken
between 1 8 1 0 and the early 1 900s without any form of regulation (Hindell and
Burton 1 988b ), however at South Georgia, government control of sealing began in
1 9 1 0. Commercial harvesting continued at South Georgia until the late 1 960s
(Headland 1 984).
It was not until 1 948 though, that any research was undertaken when at South
Georgia and Signy Island, a 3 year proj ect was initiated to develop a sustainable
harvesting method (Laws 1 960a). Although this study covered many aspects of
southern elephant seal biology, one area of particular interest was growth (Laws
1 953). An understanding of growth of this species would "provide a scientific basis
for its exploitation and control" (Laws 1 960a). Research studies of southern
elephant seal growth at Macquarie Island were also undertaken with harvesting in
mind. Carrick and Ingham ( 1 962a) noted that such research was necessary prior to
commercial slaughter of a wild species. Bryden ( 1 967) undertook a more detailed
study to understand body compositional changes of southern elephant seals at
Macquarie Island, and attempted to relate this to domesticated, food-producing
animals (Bryden 1 969a). Since commercial slaughter of elephant seals ceased at all
breeding sites, a substantial decline in numbers has been reported in several of the
maj or populations (Hindell and Burton 1 987). Consequently, much interest has
developed in studying life history variables which may explain or at least, indicate
reasons for such a decline.
This study aims to investigate growth of southern elephant seals at Macquarie Island
in an attempt to quantify the current growth pattern of animals during their first
foraging trip and for females over their life-time. Quantifying and describing growth
may enable comprehension of the adaptive process that juvenile southern elephant
seals undergo to survive in the marine environment. Subsequent growth and mature
body size attained may provide further information on southern elephant seal
population ecology, and could provide clues for the cause of the population decline.
1. 1 The genus.
The genus name Mirounga is derived from 'miouroung' , an Australian Aboriginal name (Le Boeuf and Laws 1 994 ). The second species of the genus,
M angustirostris, or northern elephant seal, is very similar in size, appearance, behaviour and diving ability to the southern species (Le Boeuf and Laws 1 994). The
northern species is characterised by a more pendulous proboscis in males, is found
in subtropical areas along the west coast of North America and is less able to assume
a U-shaped body posture (Ling and Bryden 1 992). Considerable genetic differences
are believed to exist between the two species as a result of the northern elephant seal
population experiencing an extreme population bottleneck and developing genetic
homogeneity (Bonnell and Selander 1 974; Hoelzel et a!. 1 993). Southern elephant seals in contrast, have a considerable degree of genetic variation (Gales et a!. 1 989).
1.2 Distributi o n of southern elephant seals.
Southern elephant seals have a circumpolar distribution in the southern hemisphere
(Figure 1 . 1 ) . L aws ( 1 960a) defined three independent breeding populations : (i) the
southern Pacific Ocean stock, breeding mainly on Macquarie Island and to a lesser
extent on Campbell Island; (ii) the southern Indian Ocean stock, breeding mainly on
Iles Kerguelen and Crozet, Heard, Marion and Prince Edward Islands; (iii) the
southern Atlantic Ocean stock breeding mainly in the Scotia arc (i. e. South Georgia, South Orkney, S outh Shetland, and South Sandwich Islands), the Falkland Islands
and Peninsula Valdes on the Argentinean coast. Regular haul-outs of moulting non
breeding animals, predominantly males, have also been recorded on the Antarctic
coast at the Vestfold Hills and the Windmill Islands (Burton 1 98 5 ; Gales and Burton
1 989).
1.3 Status of s outhern elephant seals.
The current estimation of the world population of southern elephant seals ( 1 year or
older) is 664 000, with the southern Atlantic, southern Indian Ocean and southern
Pacific Ocean stocks estimated to contain 3 97 000, 1 89 000 and 78 000 seals
10'
Amsterdam 1.. I I
Heard I.
,.
� /
v
_
�
uckland�
s-�0
Macq ' uane . ... , , ,e, G , , Ant1podes I.
Campbell!.
\ \
Kerguelen Is • • Vestfold Hills
c,'f?-• I
• :<.."
\ \
\ \
o·
• Main breeding place
I Q:-c
I A.._�
, South Pole ;
' '
' \
II
$ $
J
' I .'...-2;100 vii$ ;....,7'�/0:-0 I I
I <";;:,0
I ;'o"
\ Bouvetoya
\ .
South 1 v
Orkney Is. 1
',,�andw�����-• \
I
• asouth Shetland Is.
• �-· t;]
�-- I
Gough!.---.-/ 6
• Falkland Is.
Tristan da • South Georgia
Cunha
8 Lesser breeding place
2000
ao•
• Regular moulting herd
Figure 1 . 1 . The distribution of southern elephant seals, showing breeding and moulting sites (from Bryden 1 993). The main breeding populations are divided into the southern Pacific, the southern Indian Ocean, and the southern Atlantic Ocean islands.
5 170°
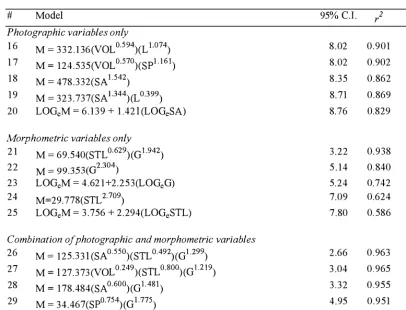
[image:20.591.100.536.172.642.2]respectively (Laws 1 994). There have been substantial declines reported in several
of the main breeding populations, in particular the southern Indian and Pacific
Ocean stocks (Hindell et al. 1 994b ). In contrast, the southern Atlantic Ocean stock appears to be stable (Boyd et al. 1 996) and the population at Peninsula Valdes increasing (Campagna and Lewis 1 992).
1 .4 Life-time growth of southern elephant seals and life history.
A complete study of growth of any mammal involves the growth of the foetus,
however such studies are uncommon for pinnipeds (e. g. Trites 1 99 1 ) . By accelerating prenatal growth, instead of extending the gestation period as large
terrestrial mammals do (e.g. 22 months for elephants (Laws 1 98 1 )), pinnipeds are able to produce a relatively large foetus (Laws 1 959). Implantation of the blastocyst
in southern elephant seals is delayed after fertilisation for a period of approximately
4 months (Laws 1 95 6a), with foetal mass then undergoing an exponential increase
over the 7 month period of foetal growth (Laws 1 956a; Bryden 1 969b; Ling and
Bryden 1 98 1 ). Body length in contrast, tends to increase in a linear fashion (Bryden
1 969b; McLaren and Smith 1 985). Trites ( 1 9 9 1 ) described foetal growth (body
length specific) of northern fur seals ( Callorhinus ursinus) and suggested that significant intersex differences begin shortly after implantation and increase through
to birth. He proposed that male foetuses weigh more because their skeletons are
longer (hence greater mass can potentially be accumulated). Male southern elephant
seal pups are born approximately 1 4% heavier than females, reflecting greater
maternal expenditure on male offspring during gestation (Amborn et al. 1 994).
Members of the Phocidae family ( earless seals) are generally characterised by a
short suckling p eriod with rapid pup growth during this time (Laws 1 95 9). Southern
elephant seal pups are born during September to November into large harems of
cows. At birth, pups weigh approximately 40 kg (Condy 1 980; Guinet 1 99 1 ;
Campagna e t al. 1 992; Fiindell et al. 1 994c ). Whilst suckling, pups undergo a pronounced dynamic change, trebling their body weight over the 23 day nursing
period (Carrick et al. 1 962a). A large percentage of this increase results from deposition of adipose tissue in the form of subcutaneous blubber (Bryden 1 969c ).
Newborn southern elephant seals are born with as little as 3% fat at birth, increasing
to approximately 40% at weaning, whilst lean tissue mass changes very little until
the last four days of the lactation period (Hindell et al. 1 994c ). The rapid
development of b lubber prior to weaning is important as it acts as an energy store
and thermo-insulation (Bryden 1 964), both being critical for the survival of an
animal that is yet to learn how to swim and forage properly.
This period of rapid growth is in direct contrast with the ensuing postweaning fast
which lasts between 3 to 9 weeks (Ling and Bryden 1 98 1 ; Amborn et al. 1 993). Weaned pups move out of the crowded harem and congregate away from adult
animals . Although growth curves of fat, muscle and viscera are reversed during the
fast, positive growth of bone continues, suggesting that both fat and muscle are
metabolised (Bryden 1 969c). Bone growth is believed to continue positively because
of the effect of gravity and the need for a stable structure to house internal organs
and enable muscle attachment (Bryden 1 969c ). The fast may also be an important
developmental stage for behaviour, social skills and diving physiology (Amborn et al. 1 993 ; Modig 1 995).
The loss of 3 0% of the weaning mass generally coincides with departure from the
natal site and commencement of the first foraging trip (Wilkinson and Bester 1 990;
Amborn et al. 1 993). Pups must rapidly and proficiently adapt to aquatic life
without maternal guidance, so that they can travel large distances, forage, and avoid
predators such as killer whales ( Orcinus orca) (Ling and Bryden 1 98 1 ). Further,
¢
individuals must undergo catch-up growth to compensate for energy reserves lost
during the fast. Little is known about this phase of life when a large percentage of
animals do not survive (Hind ell and Burton 1 987; Hindell 1 99 1 ). Only now are diet
and foraging behaviour being elucidated (Green and Burton 1 993 ; Slip 1 995; Slip in press).
Growth continues over the next few years in a negative exponential fashion for
females, accelerating steadily from the beginning of the second year of life, to
approximately 3 to 4 years (McLaren 1 993). At this age, males and virgin females
are not easily distinguished (Carrick et al. 1 962a). Annual increments in body mass and length of females then decline, with females reaching approximately 2. 5 m body
length and 400 to 600 kg body weight at growth maturity (Ling and Bryden 1 98 1 ;
Fedak et al. 1 994). Males undergo a sigmoid pattern of growth (McLaren 1 993), with a secondary period of accelerating growth at 6 to 7 years of age, coinciding
with puberty (Carrick et al. 1 962a) . Males may not reach breeding status until at least 1 0 years of age at Macquarie Island (Carrick et al. 1 962a; Jones 1 98 1 ), at
which bulls can weigh up to 3700 kg and measure more than 5 . 0 m in body length
(Ling and Bryden 1 98 1 ). Males of the South Georgia population were believed to
start breeding at a younger age and smaller body size, possibly the result of
commercial activities selectively removing older larger males from that population
(Laws 1 960b ). The growth pattern of males may account for the extreme sexual
dimorphism observed in this species (Ling and Bryden 1 98 1 ).
Advantages of increased body size in male elephant seals are two fold. Large body
size allows for greater energy stores available for haul-out periods (McCann 1 98 1) .
Increased size also confers dominance characteristics, such that l arger males are
higher ranking and consequently, have a higher copulatory frequency and hence,
greater reproductive success (McCann 1 98 1 ; Modig 1 996). Larger southern elephant
seal males of higher dominance rank also remain ashore for longer periods when
compared to lower ranking males (Modig 1 996). Similar effects of size on
dominance rank and energy stores have been recorded for northern elephant seal
bulls (Deutsch et al. 1 990; Haley et al. 1 994) .
During haul-outs to breed and moult, cows expend energy stored whilst foraging at
sea. The size of mothers is an important influence on pup size at both birth and
weaning (Amborn et al. 1 993; Amborn et al. 1 994). A minimum post-partum body mass of 3 00 kg must be achieved before female southern elephant seals can maintain
a pregnancy, presumably related to energy stores available for lactation and foetal
growth (Amborn et al. 1 994). Smaller cows may utilise a greater percentage of their fat stores than larger cows when producing a pup, but both small and large cows
may often be missing in subsequent breeding seasons, suggesting that both body
sizes could be restricted physiologically (Amborn et al. 1 994; Fedak et al. 1 996).
1.5 Growth studies of southern elephant seals.
Differences have previously been recorded for growth patterns of elephant seals at
South Georgia and Macquarie Island (Figure 1 .2), with the Macquarie Island
population believed to have a slower growth rate, increased age at first breeding and
smaller adult body size (Carrick et al. 1 962a; Bryden 1 968a). Currently, there is indirect evidence to suggest that the difference in growth rate between the two sites
has reduced (Amborn et al. 1 994; Hindell et al. 1 994a; Hindell and Slip in press).
The first intensive growth study of southern elephant seals was performed by Laws
( 1 953) at S outh Georgia, directly measuring 226 individual animals up to 1 7 years
of age. The age o f these animals was determined by counts of dentine layers from
collected canine teeth (Laws 1 953). Carrick et al. ( 1 962a) undertook a study of growth at Macquarie Island, using a total of 83 direct measurements from animals
up to 8 years of age. This study utilised known-age subjects, as it was part of a long
term mark-resight program (Carrick and Ingham 1 962a). Ninety-six animals of up
to 1 7 years of age were directly measured in a subsequent study at Macquarie Island
by Bryden ( 1 967), using similar age determination techniques as Laws ( 1 953). The
studies of Laws ( 1 953) and Carrick et al. ( 1 962a) also included numerous indirect measurements, using photogrammetric and visual estimations respectively.
5.0 (b)
4.0
E 3.0 ..c ...
Ol c:
Q) 2.0 ...J
1.0
Puberty 0' ---.----.
Puberty
9 -...---
...cJ
South Georgia
--- _..---
d
Macquarie
-9 South Georgia
---
---9 Macquarie
_, 0 1 2 3 4 5 6 7 8 9 10 11 12 13 14 15
Age (years)
Figure 1.2. Straight-line body length growth curves for the southern elephant seal at Macquarie Island ( 1 9 5Os and 1 960s) and South Georgia ( 1 948-5 1 ) (from Laws
1 984).
[image:26.594.98.521.282.585.2]1 . 6 Why study growth?
Body growth analysis has many implications for the ecology of mammals. It can
provide an obj ective criterion for monitoring physiological condition of mammalian
populations (Hanks 1 98 1 ), indicate prey abundance (Trites and Bigg 1 992),
highlight foraging success and body condition of mothers (Crete et al. 1 993), and measure nutritional status (Reimers 1 972; Mitchell et al. 1 976). In general, slower growing individuals within a species or population tend to have reduced
survivorship (Choquenot 1 99 1 ; Lee et al. 1 99 1 ). Environmental factors may also play a role in limiting the genetic growth potential of mammals (e.g. Suttie and Hamilton 1 983).
The recognition of substantial population declines of southern elephant seals during
the last 3 0 to 40 years in the south Pacific and Indian Oceans has been the stimulus
for recent research activities (Hindell et al. 1 994b ). Although many single factors
have been suggested as the cause, it is more likely to be multifactorial (Hindell et al.
1 994b ). Factors such as density dependent pup mortality, predation, increased
fishery activity, and competition with other vertebrate consumers for food resources
seem unlikely to be the inciting cause of the decline (Hindell and Burton 1 987;
Hindel1 1 99 1 ; Hindell et al. 1 994b). The two current explanations are: (i) the environmental change hypothesis where fluctuations in the ocean environment are implicated in having an impact on food species used by southern elephant seals
(Burton 1 986; Hindell et al. 1 994b ), and (ii) the equilibration hypothesis where equilibration processes after a population "overshoot" are proposed to be a direct
result of heavy exp loitation of elephant seals since the eighteenth century (Hindell et al. 1 994b ) .
The environmental change hypothesis predicts that first-year survival should change
markedly in a nondirectional manner over short periods of time (Hindell et al.
1 994b ), if responding to short-term environmental change such as an El Nino event
(Fairbach et al. 1 991 ). Longer term environmental change, such as global warming (Folland et al. 1 984; Jones et al. 1 986), would presumably be reflected by more gradual and directional demographic changes. However, the effects of such changes
would depend on the type of effect they have on prey species. If overall prey
availability was reduced, then the resulting population decline could have a density
dependent effect, allowing for increased prey availability per capita, as suggested
for the northern fur seal population on the Pribiloflslands between 1 95 8 and 1 974
(Trites and Bigg 1 992). This increase in prey per capita could b e reflected in
positive changes such as increased adult body size and earlier onset of first breeding
for females. On the other hand, if long-term changes resulted in decreased prey
availability and caloric density, then changes such as reduced adult body size and
later onset of first breeding for females may result (Hanks 1 98 1 ; Stewart and
Lavigne 1 984). The equilibration hypothesis predicts that with stabilisation of the
population, adult and first year survival will increase directionally, somatic growth
rates will increase and adult body size will increase, but age at first breeding for
females will decrease (Hindell et al. 1 994b ). By undertaking growth studies of southern elephant seals, predictions of these hypotheses pertaining to growth rate
and adult body size can be tested. Indirectly, growth studies may also test
predictions relating to age at first breeding and first year foraging success.
Today, cross-sectional studies involving the slaughter of large numbers of seals are
generally not undertaken. Instead mark-resight studies (e.g. Bester 1 988) are used to obtain data pertaining to growth. At Macquarie Island, elephant seals have been
regularly marked using plastic flipper tags since 1 987, and now large numbers of
weaned pups have been permanently identified by hot-iron brands annually since
1 993 (H. Burton pers. com.). Permanent identification of large numbers of known
age animals provides a useful data set of individuals, especially considering the high
site-ftdelity of southern elephant seals (Nicholls 1 970; Lewis et al. 1 997).
1 .7 Aims and structure of the study.
By examining the growth of southern elephant seals at Macquarie Island, this study
aims to address the following fundamental questions:
• what is the current growth pattern of southern elephant seals of the Macquarie
Island population?
• what factors determine growth?
• has growth of the Macquarie Island population changed since the 1 950s and
1 960s?
• does growth of elephant seals at Macquarie Island differ from the South Georgia
population (or at least from the 1 950s when earlier studies were conducted)?
Field work for this study was undertaken in the isthmus study area (Carrick et al.
1962b) on Macquarie Island (54° 30' S, 1 5 8° 57' E) between March 1 994 and
January 1 99 5 (Figure 1 .3).
The thesis has 3 d ata chapters which are based on separate papers that are either in
press (Chapter 2 ; B ell et al. in press) or in preparation for submission (Chapters 3 and 4). As the chapters have been prepared in this way, there is some repetition in
the Methods sections.
The aim of Chapter 2 was to determine a suitable direct or indirect method of
estimating body mass and other morphometries for use in growth studies.
Chapter 3 focuses on growth in the first year of life, using known-age animals. This
study is unique in that it utilises permanently identified animals from the current
mark-recapture program and is the first to examine growth of elephant seals in their
first year of life, p articularly during the first foraging trip.
Chapter 4 aims to quantify the current life-time growth pattern of females
(inadequate data was collected for males to achieve the same objective), to address
observations that Macquarie Island cows are smaller, breed later and grow slower
than South Georgia counterparts. This chapter uses a combination of known-age
animals, as well as animals aged using dental cementum layers. This is a method of
age determination widely used for marine mammals, as well as other terrestrial
mammals. Retrospective analysis of data from the 1 950s and 1 960s from Macquarie
5km
Buckles Bay
+
54°45'8 159°00'EF igure 1 .3. Map of Macquarie Island (after Selkirk et al. 1 990).
[image:31.594.94.397.59.695.2]Island also provides temporal comparison and may provide some explanation for the
current decline o f this population.
Chapter 5 is a general discussion of the findings, and relates these to seal ecology
and population dynamics. It presents an overview of factors which may be
implicated in affecting growth of southern elephant seals.
CHAPTER TWO
INDIRECT AND DIRECT METHODS OF ESTIMATING
MORPHOLOGICAL CHARACTERISTICS.
2 . 1 Introduction.
Direct measurement of the mass of large phocids is difficult and potentially
dangerous for both biologists and specimens. Further, transporting heavy weighing
equipment can b e extremely awkward in field situations (Boyd et a!. 1 993), whilst weighing large numbers of phocids can be time consuming and physically
demanding (Amborn et a!. 1 993) . However, data such as body masses are necessary to assess the condition of phocid seals and must be obtained despite these problems.
Photogrammetry, the science of making measurements on photographs (Baker
1 960), is now a well established technique used in a wide range of fields including
geology, agriculture, medicine and mapping (Atkinson 1 980). Specialised
equipment is available which extends the usefulness of the technique (Karara 1 979).
Laws ( 1 95 3 ) first utilised a photographic technique for marine mammals to estimate
body length of southern elephant seals. More recently, aerial photography has been
used in cetaceans, including southern right whales (Eubalaena australis), fin whales
(Balaenoptera physalus), and bowhead whales (Balaena mysticetus), as a means of making indirect morphological measurements (Cubbage and Calambokidis 1 987;
Best 1 992; Ratnaswamy and Winn 1 993). Terrestrial photogrammetry was used to
predict body mass of northern elephant seal bulls from photographically measured
variables (Haley et al. 1 99 1 ) and more recently, southern elephant seal cows at South Georgia (Modig 1 995).
The aim of this chapter is to develop an indirect method of estimating body mass of
southern elephant seals using both digital photogrammetry and morphometries, to
overcome the logistical problems associated with direct mass estimation.
2.2 Methods.
Field work was undertaken at the isthmus study area (Carrick et al. 1 962b) of Macquarie Island during 1 994 and 1 99 5 . A total of 95 animals were weighed and
photographed. This sample consisted of 3 6 yearlings (between 5 and 1 5 months of
age; 1 9 male, 1 7 female), 3 2 immature individuals ( 1 8 male, 14 female) and 27
post-lactation cows. The immature animals were non-breeding males and females.
Adult bulls were not included in this study because of labour and equipment
constraints.
Individual animals were sedated prior to photographing. Most animals less than 2
years of age were physically restrained with a canvas head-bag and sedated by
intravenous inj ection of approximately 0. 9 mg/kg of ketamine hydrochloride and
0.03 mg/kg of diazepam (see Slip and Woods 1 996). All other animals were sedated
using a 1 : 1 mixture of tiletamine and zolazepam at a dose of 1 mg/kg (Baker et al.
1 990), administered intramuscularly by a remote injection method (Ryding 1 982).
2.2. 1 Photograph i c measurement.
Initially, a Nikon 3 5mm SLR, connected to a Kodak D SC200 charged couple device
(CCD) that converts light to digital signals, was utilised. This was fitted with a
28mm focal length lens, which provided a coverage similar to a 80 mm lens due to a
small sensor area. Later, a Canon ION 260 video-still camera was used. Despite
reduced image quality, this unit proved to be considerably more practical due to its
smaller size, robustness and ease of use.
Once immobilised, two images were obtained of each animal; a side and front view
(see Haley et al. 1 99 1 ) . Side views were taken from a distance of approximately 4. 5 metres, with the camera 0.3 metres above the ground. Frontal pictures were taken
with the camera at a similar height, but approximately 2 . 5 metres from the snout of
the seal. A calibration pole, with a red and white 1 00 millimetre scale, was held by
an assistant over the midline for side pictures and over the axillae, at right angles to
the midline, for front views. Photographs were taken at the point of maximum
inspiration to standardise the side area estimates which varied with the respiratory
cycle. Seals were only photographed when lying on packed sand or hard ground,
and when their body could be positioned in a straight line.
2.2.2 Field measu rements.
Mass was determined to the nearest kilogram by suspending the seal in a stretcher
underneath an aluminium tripod using electronic strain gauge scales of 2500kg
capacity of ± 1 kg accuracy (Measurement Systems International, Seattle,
Washington, USA). Snout-tail length (STL) and axillary girth (G) (Table 2 . 1 ) were
Table 2.1. Variables, abbreviations and units used in models. Variable-type refers to either photographic (P) or morphological (M) variables.
Variable Variable-type Abbreviation Units
Side area p SA m2
Girth area p GA m2
Side perimeter p SP m
Girth perimeter p GP m
Snout to base of hind flippers p L m
Volume p VOL m3
Snout to tail length M STL m
Axillary girth M G m
Body mass M M kg
Body heighta p H m
a Taken at various locations along the length of the body. Refer to Figure 2 . 1 for specific positions.
measured with the animal in ventral recumbency (American Society of
Mammalogists 1 967) with a plastic tape-measure.
2.2.3 Calculati ons.
Once downloaded to a computer, the digital images were preprocessed and
enhanced with an image analysis program (Aldus Photostyler 2 . 0, Aldus
Corporation, Seattle, 1 994) to eliminate orthogonal linear distortion caused by the
scanning/downloading process
(A
Vrana, pers. comm. ) . The image file wastransmitted via a satellite link to Australia and imported into a commercial computer
aided design (CAD) program (AutoCAD Release 1 2, Autodesk, Inc., Sausalito,
1 992) as a screen overlay file. The outline of both side and frontal images were then
manually traced with a digitiser. The caudal flippers were disregarded in the side
image tracing as their position was variable. Using the calibration pole in the
original image, the scale of the tracing entity could be adjusted accordingly by the
ratio of real length : digitised length.
Quantitative data were obtained for the following photographic variables (also
defined in Table 2. 1 ) : (i) side area (SA, equivalent to the area of a longitudinal
section taken at the midline) (ii) girth area (GA, equivalent to the area of a cross
section at the axillary girth) (iii) body length (L, Figure 2. 1 ) (iv) side height (H, see
below and Figure 2. 1 ) (v) side perimeter (SP, perimeter of side section) and (vi)
girth perimeter (GP, perimeter of girth section). All variables were measured using
S . I. units. As the position of the tail was obscured by the caudal flippers in
photographs, the straightline measurement (L) of snout to the base of hind flippers
-
h -
-...,;; - ... - - - - -- - - - -... ... .. ""
--- d
--:---of-Hp
. . H4
L
[image:38.601.95.545.99.528.2]H2
Figure 2.1. Diagrammatic representation of height measurements (Hl to H6) made from the side view. L represents the snout to base of hind flipper length estimated from the digital image. The anteriormost height measurement (HI) was at the straightline distance (K) from the snout: 0.2 m in seals up to one year of age or 0.3 m in seals greater than 1 year of age. H3 represented the height at the axillary girth and H6 the height at the base of the hind flippers. The remaining height
measurements were made at equal intervals according to the diagram. The two other variables used for each truncated cone were the height of the section (h), and the height of the 'parent' cone (d).
(where the caudal flippers meet the body) was made, as per Haley et al. ( 1 99 1 ). Four replicate m easurements were made for each variable. The mean of these 4
measurements was used in the derivation of regression equations. Heights were also
measured at 6 locations along the length of the side images (Figure 2 . 1 ) to enable
the estimation of a body volume.
The method of Gales and Burton ( 1 987) was modified to estimate the volume of
seals. This assumed that individuals were circular in cross-section, such that the
diameter for any cross-section was equivalent to the side height at that point. To
perform the calculations, each animal was divided into five sections which were
treated as five truncated cones, each with ends of diameters corresponding to the
two sets of adj acent height measurements (Figure 2. 1). The head and hind flipper
section were disregarded in the calculations as these were minimal in terms of
volume and diffi cult to estimate. Each section was treated as a separate truncated
cone to calculate the total volume. For each of these, the end with the greater height
was treated as the base and the other end as a parallel section of a cone. The height
(h) of the sections was calculated by subtracting K (straightline distance from the
snout to H l ) from the length (L), estimated from the side image, and dividing by
five (Figure 2 . 1 ) . Volumes were calculated for the 'parent' cone (cone a
)
containingeach section (base radius = height for the base/2, cone height = d ) and the smaller
apical subcone (cone b
)
(base radius = height of shorter section end/2, height = d-h). See Figure 2 . 1 . The total volume of the section was then deduced by subtracting thevolume of co neb from cone a (refer to Appendix 1 for calculation details). The sum
of the volumes of all five sections was the total estimated volume for the seal.
2.2.4 Data analysis.
Regression analysis of body mass on all combinations of the photographic and
morphometric variables (Table 2. 1 ) was performed, in the form of log-log linear and
power models. Adjusted multiple r-squared values (/ ) were derived for these single
and multiple regressions. Colinearity was recognised as a potential cause of spurious
/ values (Zar 1 98 4), as a high degree of intercorrelation existed between many of
the independent v ariables in the multiple regressions. To overcome colinearity, data
from 1 3 individuals, randomly selected from the total pool (n = 95), were used as test cases to assess the predictability of different models. Data from these
individuals were not used in the derivation of models. This group was composed of
5 yearlings (3 male, 2 female), 5 post-lactation cows, and 3 immature animals (2
male, 1 female). These numbers were selected so that adequate sample sizes
remained to derive models. Only class-specific test cases were used to trial class
specific models. Confidence intervals (C. I.) of 95% for the mean percentage
difference b etween the real mass and model predicted mass, that is, the percentage
that the real mass was of the predicted mass, were estimated from these test cases.
As a measure of reliability of models, confidence intervals instead of r2 values were used.
2.3 Results.
Many equations were obtained using different combinations of photographic and/or
morphometric v ariables. The best fifteen models selected on the basis of the 95%
confidence interval for each of the three groups are presented here: (i) all
individuals combined (Table 2.2) (ii) post-lactation cows (Table 2.3) and (iii)
yearlings (Table 2.4). Models were further divided into those with (i) photographic
variables only (ii) morphometric variables only and (iii) a combination of
photographic and morphometric variables. The standard error for replicate
measurements o f photographic variables, as a percentage of the mean, was estimated
for each animal. Mean error was less than 0. 7%, with a maximum of 3 . 9% for SP.
2.3. 1 Class non-specific.
The best confidence interval, ± 3 .9 1 %, (model 6, Table 2.2) was for the power
model which contained the morphometric variables STL and G (Figure 2.2). For
models with only photographic variables, the best confidence interval was ± 4.7 1 %
(model 1 , Table 2 . 2), taking into account S A and GA. The most useful and best
correlated photographic variable was SA (model 4, Table 2.2, Figure 2.3). As
expected from g eometrical relationships, body mass was found to be proportional to
approximately (length)3 (model 9, Table 2.2) and volume (unpub. data). For completeness, confidence intervals are also presented for these models when tested
using class-specific test cases (Table 2.2) .
N --l
Table 2.2. Models for mass estimation, 95% confidence intervals (95% C.I.) for the percentage difference between predicted and real body mass, and coefficients of determination (r2) derived from a combination of yearlings, post-lactation cows and other animals (as outlined in text). n = 13 for estimation of the 95% confidence
intervals (non-specific). 95% C.I. are also shown for the models when test cases were used specific to the post-lactation cow (n = 5) and yearling (n = 5) classes.
# 1 2 3 4 5 6 7 8 9 1 0 l l 1 2 1 3 1 4 1 5 Model
Photographic variables only
M = 849.288(GA0.462)(SAL071)
M = 15.543(GP2.49 l)(SP0.443)(GXo.7oo)(SA0.658)
M = 2 1 .045(GP1 .757)(SPl .054)
LOGeM = 6. 176 + l .454(LOGeSA)
M = 6 12 . 859(SA0.697)(GA o.57l)(L 0.4
62)
Morphometric variable only
M = 5 3 .896(STL 1 .063)(GI.697)
LOGeM = 3 .630 + 2.523(LOGeSTL)
LOGeM = 4.269 + 2.795(LOGeG)
M = 3 l .259(STL 2·772)
M = 8 1 . 827(G2·543)
Combination of photographic and morphometric variables
M = 89. l 85(VOL 0·168)(STL 0·953)(GL428)
M = 1 2 1 . 929(SA0.644)(GP1 .033)(STL 0.629)
M = l l l . 44 7 (GP0.381 )(SP-0.235)(GA-o.oo8)(SA o.392)(STL 0.827 )(G 1 .0 1 s)(L 0.086)
M = 1 96.498(SA0 772)(G!.341)
M = 26.54 l (SP1 .022)(Gl.699)
r 0.983 0.987 0.984 0.939 0.984 0.991 0.902 0.958 0.842 0.964 0.993 0. 987 0.994 0.987 0.988
n 95% C.I. 95% C.L 95% C.I.
(non-specific) (cows) (yearlings)
45 4.71 2.92 16. 1 5
45 5.58 4.26 14.99
45 5.74 4.68 14.49
79 6.36 8.42 1 5.95
45 6 .45 4.16 1 5 .77
82 3 . 9 1 2 . 1 7 6. 16
81 5.59 6.89 7.24
82 6.43 4.72 6.35
82 6.57 6.80 7.42
82 7.06 4.37 6 .02
58 4.42 2.53 7.06
43 4.70 2.66 12.50
49 4.73 1 . 96 8.06
48 4.85 2.76 10.61
N 00
Table 2.3. Models for mass estimation, 95% confidence intervals (95% C. I.) for the percentage difference between predicted and real body mass, and coefficients of determination (/) for post lactation cows. n = 5 for estimation of the 95% confidence intervals.
# Model
Photographic variables only
1 6 1 7 1 8 1 9 20
M = 3 3 2 . 1 36(VOL 0·594)(L 1.074)
M = 124.535(VOL 0·570)(SPl . l61) M = 478.332(SA1 .542)
M = 323 .737(SAL344)(L 0·399)
LOGeM = 6.139 + 1 .42 l (LOGeSA)
Morphometric variables only
2 1 22 23 24 25
M = 69.540(STL 0·629)(G1 .942)
M = 99.353(d304)
LOGeM = 4.62 1+2.253(LOGeG)
M=29.778(STL 2·709)
LOGeM = 3 .756 + 2.294(LOGeSTL)
Combination of photographic and morphometric variables
26 27 28 29 30
M = 125.33 l (SA0"550)(STL 0·492)(Gl .299)
M = l 27.373 (VOL 0·249)(STL 0·800)(GL2 19) M = 178.484(SA0·600)(Gl.481)
M = 34.467(SP0·754)(Gl.775)
M = 1 93 .284(VOL 0·223)(G!.706)
95% C.I. r 2 n
8.02 0.901 18
8.02 0.902 1 8
8.35 0.862 22
8.71 0.869 22
8.76 0.829 2 1
3 .22 0.938 22
5 . 14 0.840 22
5.24 0.742 22
7.09 0.624 22
7.80 0. 586 2 1
2.66 0.963 22
3 .04 0.965 17
3.32 0.955 22
4.95 0.951 22
N �
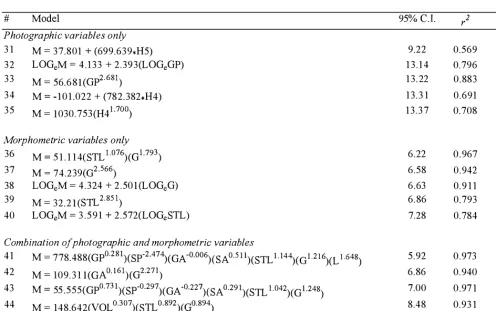
Table 2.4. Models for mass estimation, 95% confidence intervals (95% C. I.) for the percentage difference between predicted and real body mass, and coefficients of determination (r2) for yearlings. n = 5 for estimation of the 95%
confidence intervals.
# Model
Photographic variables only
3 1 M = 37.801 + (699.639*H5)
32 LOGeM = 4.133 + 2.393(LOGeGP)
33 M = 56.6 8 l (GP2·681)
34 M = -101 .022 + (782.382*H4)
35 M = l030.753(H41 .700)
Morphometric variables only
36 37 38 39 40
M = 5 1 . 1 1 4(STL 1 .076)(G!.793)
M = 74.239(G2·566)
LOGeM = 4.324 + 2.50 l (LOGeG)
M = 32.2 l (STL 2·85 1)
LOGeM = 3 .5 9 1 + 2.572(LOGeSTL)
Combination of photographic and morphometric variables
4 1 42 43 44 45
M = 778.488(GP0.28l)(SP-2.474)(GA-o.oo6)(SA0.5 l i)(STL l .l44)(Gl.216)(L ! .648)
M = 109.3 1 l(GAO. l61)(d·271)
M = 55 .555(GP0.73 l)(SP-0.297)(GA-0.227)(SA o.29 l)(STL L042)(G !.248)
M = 148.642(VOL 0·307)(STL 0·892)(d·894)
M = 1 27. 166(SA0.421)(Gl .856)
95% C.I. r 2
9.22 0.569
1 3 . 1 4 0.796
1 3. 22 0.883
13.3 1 0.691
13.37 0.708
6.22 0.967
6.58 0.942
6.63 0.9 1 1
6.86 0.793
7.28 0.784
5.92 0.973
6.86 0.940
7.00 0.97 1
8.48 0.93 1
8.63 0.953
w 0
1 000
900
0800
--700
C) �
-600
tJ) tJ)'
ca
500
E
�
400
"0
0
300
OJ
200
1 00
0
0
2
4
6
8
1 0
1 2
1 4
1 6
1 8
[image:45.838.63.686.99.430.2](length A 1 .063)(G i rth A 1 . 697)
Figure 2.2. The relationship between body mass and snout-tail length/girth for model #6. M = 53 . 896(STLL063)(Gl.697); r2 = 0.99 1 ; 95%
w �
-en en m :E
-0') 0 ..J
-
1
.2
0 0
-1 . 0
-0. 8
7 . 0
oo
5.0
0
4.5
-0. 6
-0.4
-0. 2
0 . 0
0 . 2
0.4
[image:46.839.144.661.79.452.2]Log(Side area)
Figure 2.3. The relationship b etween body mass and side area for model #4. LogeM = 6. 1 76 + 1 .454(LogeSA); r2 = 0.93 9; 95% confidence
2.3.2 Post-lactation cows.
The most reliabl e model for cows contained morphometric and photographic
variables (model 26, Table 2.3). However, the 95% confidence interval was only
increased by 0. 5 6% when morphometric variables alone were used (model 2 1 , Table
2.3). Overall, this animal class produced the best 95% confidence interval for all
models, ± 2. 66% (mo del 26, Table 2.3). Models specific to the cow subgroup were
generally better predictors of body mass than models containing the same variables,
derived from the total pool.
2.3.3 Yearlings.
Of all yearling models, the most reliable contained both variable types and had a
confidence interval of ± 5 . 92% (model 4 1 , Table 2.4). Models obtained for this class
were the least reliable in terms of confidence intervals.
2.3.4 Comparison of morphological characteristics and p hotographic
measurements.
Using a Student t-test, it was shown that the physically measured axillary girth (G)
was not significantly different (t55 = - 1 . 520, n = 56, P = 0 . 1 3 4) to the equivalent photographic variable GP. As expected, STL was significantly different (t84 = 5.6 1 6,
n = 85, P < 0.00 1 ) to photographically measured L as these measurements were taken from different locations at the subjects' caudal end.
2.4 Discussion.
Body masses of p innipeds were estimated with a high degree of certainty using both
morphometries and photogrammetry, however the best model in this study
contained only the morphometric parameters STL and G. Accuracy was marginally
improved when class-specific models were used for cows but not yearlings.
Presumably, this is related to intersex differences in body composition (see Haley et al. 1 99 1 ) and growth pattern (Bryden 1 968a), and age-dependent growth rate
(Bryden 1 968a). Further, when using class-specific test cases for the general models
(Table 2.2), the confidence intervals were, in general, minimally increased for both
yearlings and cows when compared to those of specific models (Tables 2.3 and 2.4) .
Increased sample size and variation i n body condition may be accounted for in the
general models (Table 2. 2), and may explain this finding. In developing models for
yearlings, data for males and females were combined as sexual dimorphism is not
apparent in this age class (Chapter 3).
2.4. 1 Photograp hic variables only.
Although models which included only photographic variables were the least
reliable, they still produced relatively high confidence intervals. Much of the
variation unaccounted for by these models is possibly related to the digitising and
tracing procedure. Accuracy of tracing images with a digitiser depended on the
quality of the images and also the skill of the operator. Four tracings were
undertaken for each image in an attempt to account for such variations. Haley et al.
( 1 99 1 ) repeated tracings of each image so that measurements were consistently
within 1 to 2% of each other. A similar consistency was achieved in this study. The
position of the animal whilst photographing was critical in terms of quality of the
digital tracings. Animals needed to be on a firm and packed down surface such as
sand rather than long grass or beach shingles so that, particularly, an exact ventral
outline could be distinguished.
Haley et al. ( 1 99 1 ) found that STL was approximately 1 0% longer than L, whilst this study found it to be only 3 % . This difference was possibly related to the
operator's selection of the 'base of the hind flippers' . The measurements of girth
and GP were not significantly different, which verified the relative accuracy of
estimation of linear measurements by way of photogrammetry in this study. Side
area was found to be the best correlated single variable, a finding made also by
Haley et al. ( 1 99 1 ) and Modig ( 1 995). A likely reason for this is that side area is influenced by both length and girth (Haley et a!. 1 99 1).
2.4.2 Morphometric variables only.
The best predictor of body mass was a combination of the morphometric variables
body length and girth squared. This corresponds to previous studies of Steller sea
lions (Eumetopias jubatus), Weddell seals (Leptonychotes weddellii), walruses ( Odobenus rosmarus) and southern elephant seals that have used this combination (body volume index) as a reliable predictor of body mass (Gales and Burton 1 987;
Castellini and Kooyman 1 990; Castellini arid Calkins 1 993 ; Knutsen and Born
1 994). This is a practical model to use in field situations, as these variables are
easily measured in a sedated animal.
Body composition is an important consideration when deciding whether to utilise
general or class-specific models for the body volume index. For example, Woods
( 1 994) observed considerably less variation in condition (i. e. blubber levels) of cows at the end of lactation, compared with the beginning of the breeding season. Because
of this, post-lactation cow mass was possibly better predicted by the class-specific
model (model 2 1 , Table 2.3) than the general model. Conversely, the yearlings in
this study appeared to vary considerably more in body condition (C. Bell, pers. obs. )
and consequently, the general model (model 6, Table 2.2) was more reliable than the
equivalent yearling-specific model. There was also a bias towards the yearling age
group in the total sample used for the regressions. Another explanation for this
difference between yearlings and cows is the greater relative error involved with
making morphometric measurements of small animals (yearlings) compared to large
animals (cows and bulls).
Interestingly, models derived in this study with the single calculated variable of
body volume (unpub. data) were considerably less reliable than those which contained length and girth squared. Although the truncated cones method has been
validated to give realistic blubber mass values (Slip et al. 1 992b ), estimation of absolute body volume has not. Accuracy may have been reduced as this model did
not account for differences in body composition between the different age classes or
the different densities of adipose and lean tissue.
It must b e emphasised that repeat morphometric measurements can vary
considerably for one individual. Repeated STL measurements of northern elephant
seal bulls may result in an error of between 2 (Haley et al. 1 99 1 ) and 3% (Clinton 1 994). Higher v ariations such as 4% have been noted in southern elephant seal cows
(C. Bell, unpub. data). This variation greatly depends on the surface that the seal is lying on and the positioning of the neck, and this must be taken into consideration
when making such field measurements.
2.4.3 Photogra p hic and morphometric variables combined.
The best cow and yearling models, in terms of mass predictability, contained both
types of variables. But for both subgroups, only marginal improvements in
confidence intervals were made when using the combined variables over
morphometric v ariables alone (Tables 2.3 and 2.4) . This improvement would not
warrant the extra labour involved with obtaining photographs and processing them.
2.4.4 Comparison with other studies.
In comparison to photogrammetry studies of northern elephant seal bulls (Haley et
al. 1 99 1 ) and southern elephant seal cows (Modig 1 995), the r2 values obtained in this study were considerably higher (Table 2. 5). When post-partum cow models
from this study were compared with Modig ( 1 995) however, r2 values were very
similar. Haley et al. ( 1 99 1) calculated confidence intervals using the measurements included in the models, however these could not be compared as the present study
used test cases which were not used in the derivation of models. Thus, a direct
comparison could not be made on this basis, however r2 values in this case are
adequate indicators as they at least quantify the degree of variation in body mass
attributable
w --l
Table 2.5. Comparison of / values for power models for the present study (utilising all ages and classes), Haley et al. (1991) and Modig (1995).
Haley et al. Modig (1995) Present study
(1991)
Age class Bulls only Cows only Yearlings, cows and
immature males
Variable r 2 n r 2 n r 2 n
GA 0.765 7 1 -
-0.950 48
L 0.778 85 0.682 39 0.894 80
SA 0.923 84 0.840 39 0.973 80
L, GA 0.897 7 1 -
-0.980 45
L, SA 0.928 84 -
-0.973 80
SA, GA 0.940 70 -
-0.983 45
SA, GA, L 0.948 70 -
-0.984 45
H3 - - 0.649 39