Modeling heat transfer in butter products : a thesis presented in partial fulfilment of the requirements for the degree of Doctor of Philosophy (Ph D ) in Bioprocess Engineering, Institute of Technology and Engineering, Massey University, Palmerston Nort
324
0
0
Full text
(2) MODELING HEAT TRANSFER IN BUTTER PRODUCTS. A thesis presented in partial fulfilment of the requirements for the degree of. Doctor of Philosophy (PhD) In Bioprocess Engineering. Institute of Technology and Engineering. Massey University. Palmerston North, New Zealand. AMSHA NAHID 2007.
(3) ABSTRACT. B utter keeping quality and pallet physical stabi lity during transport and storage are dependent on the temperature distribution through the product. Understanding these temperature changes are of vital i mportance for the dairy i ndustry with regard to butter manufacture, storage and shipping.. Three dimensional mathematical models of heat transfer were developed to predict thawing and freezing in butter products. These models require accurate thermophysical data as an input. Specific heat capacity and enthalpy of butter with different composition was measured using Differential Scanning Calorimetry. The specific heat capacity of butter differs for cooling and heating operations due to significant supercooling and delayed crystal lization of the fat fraction of butter at temperatures wel l below the equilibrium phase change temperature during cooling. This reduces the heat capacity for cooling relative to that for heating.. Thawing of individual blocks of butter was accurately predicted by the conduction only model (no mass transfer limitations) with equilibrium thermal properties giving accurate predictions when the butter was completely frozen before thawing. For partial ly frozen butter the conduction model with the measured temperature dependent specific heat capacity data for unfrozen butter including melting of some of the fat fraction gave accurate predictions.. For freezing it was observed that water in the butter supercools many degrees below its initial freezing point before freezing due to its water in oil structure. Experiments suggested that duri ng freezing release of latent heat observed as a temperature rebound is controlled as much by the rate of crystallisation of water in each of the water droplets as by the rate of heat transfer. A conduction only model including water crystallization kinetics based on the Avrami Model predicted freezing i n butter successfully. Simple models with equilibrium thermal properties and nucleation only kinetics (based on homogenous nucleation theory) or the sensible heat only model (no release of latent heat) gave poor predictions.. The models for i ndividual blocks were extended to predict heat transfer in butter pal lets. A butter pallet contains product, packaging material and the air entrapped between the packaging and butter cartons. Measurements were made for freezing and thawing of ful l and half pallets at a commercial storage fac i lity and in the University laboratory. Thawing and freezing in wrapped tightly stacked.
(4) pallets was predicted accurately by the conduction only model with effective thermal properties (incorporating butter, packaging and air) estimated by the parallel model.. For unwrapped tightly stacked or loosely stacked pallets there is potential for air flow between the adjacent cartons of butter. An alternative approach was developed which consisted of modeling the pallet on block by block basis using effective heat transfer coefficients for each surface. Different heat transfer coefficients were used on different faces of the blocks depending on the location of the block in the pallet. This approach gave good predictions for both unwrapped tightly stacked and loosely stacked pallets using the estimated effective heat transfer coefficients from the measured data. Further experimental and/or modelling work is required in order to develop guidelines for estimating effective heat transfer coefficient values for i nternal block face for i ndustrial scenarios.. 11.
(5) ACKNOWLEDGEMENTS. It has been said by a wise person, "Preserve your knowledge by writing it". This PhD thesis consists of knowledge I gained during the last several years of my study at Massey University. Gaining this knowledge and i ts preservation would have not been possible without the help (and patience) of a number of people. I would like to thank to these people for a huge variety of reasons.. Firstly I like to thank my supervisors Associate Prof. John Bronlund, Professor Don Cleland (Massey University) and Bruce Philpott ( Fonterra Co-operative Group Limited) for their continuous support, guidance and constructive criticism while supervising this work. I could not have imagined having a better supervising team for my PhD.. My special thanks to Or. Ashraf Choudhary (Member of New Zealand Parliament) for helpi ng me to come and study i n Massey University and advising me to pursue Doctoral research.. I am grateful to The New Zealand Foundation for Research, Science and Technology (FRST) for Enterprise scholarship funding and Fonterra Co-operative Group Ltd for funding the project costs.. Lot of thanks goes to the administrati ve staff of ITE, specially Joan Brookes, Gayle Leader, Trish O'Grady, Alisha Anan and John Hayward for their help and support throughout the project.. Thanks to Susan Lane for assisting me with the use of DSC and sample preparation and to Or. David Oldfield and Chris Ballentyne for their help during the early stage of the project.. I appreciate Grant Gilbert at Whareroa site for his great help and time in conducting experiments at the dairy factory, Garry Radford for keeping tons of butter in freezers and then disposing off i t, John Edwards who was always there for me whenever I needed a hand in experimental work, Humphrey O'Hagan for cutting, chopping and drilling my butter, Bruce Collins and Craig Bellhouse for giving me a hand in understanding data logging equipment.. III.
(6) H uge thanks to Dr. Tehseen Aslam and Muhammad AIi (my Pakistani friends and colleagues at Massey University) for their support and help during my stay i n New Zealand especially Dr. Zulfiqar Butt and Dr. Zaker Hussain, who always supported me as my real brothers.. I won ' t be able to forget the support, understanding and encouragement given by the Paki stani community in Palmerston North and Wellington specially Or Khalid Sandhu, Dr. Razia Sandhu and Aunty Salima Bibi for thei r moral support and prayers.. A very sincere gratitude to my friends Misbah Akhar, Asifa Butt, Shazia AIi, Samina Zakir, Erum Tariq, Nasreen Bhali, Rizwana Tehseen and Robina Babar for their help and support that. made the last stage of my PhD a bit easier.. I am forever indebted to my father Professor Abdul Hamid (late), my mother Nasim A khtar, my father in law Choudhary Nazir Ahamad (late) and my mother in law Khurshid Bibi for their prayers and support without which I would have never been able to complete this task. Thanks to my brothers Mumtaz, Abbas, I1yas, Usman, and Suleman, my sister Uzma, my sisters and brothers in law and all other fami l y members for their encouragement.. Lastly my hubby Tahir, my daughter Bazal and son Hashim for their love, understanding, endless patience and encouragement when it was most required.. iv.
(7) TABLE OF CONTENTS. ABSTRACT. i. ................................................................... A C KN 0 WLEDGEMENTS TABLE OF CONTENTS LIST OF TABLES. iii. ................................................... v. ....................................................... xii. ................. . . . . . ................................... ..... LIST OF F IGURES. xv. ................ .................................... . . ........ LIST OF APPENDICES. xxvii. ............................ ....................... C HAPTER 1 : PROJECT OVERVIEW. 1.1. Background and Project Definition . . .. .... .. . . . . . .. .... 1-1. 1.2. Project Objectives ...... .... . .. . . .. . . . .. .. .. .. C HAPTER. .. .. .. .. .. .. .. .. .. .. .. . ... ..... .. .. .. .. .. .. .. . .... 1-2 .. .. 2: LITERATURE REVIEW. 2.1. Introduction . ... . . . . . .. 2.2. Butter Composition and Structure .. 2.3. Milkfat Composition . . .. .... . . .. . . . . . . . . . . ... . ... . . . . . 2-2. 2.4. Crystallisation of Fat. ... 2.5. Aqueous Phase of Butter.. .. .... ........... . . . . . . . .. 2.6. Crystallisation of Aqueous Droplets . ......... . . . ... . .. . . 2-6. 2.7. Manufacturing Process .. ............... . .. . . .. .. .. .. .. .. . .. .. .. .. .. .. .. .......... . . .. . . . . . . ... .. .. .. .. .. .. .. . . .. .. .. .. .. .. .. .. .. . .... ..... .. .. .. .. .. .. .. .. .. .. .. .. .. .. .. .. .. .. .. .. 2.7.1 Fritz Butterma ki ng Process . . .. .. .. 2.7. 2 A mmix B uttermaking Process... ... .. .. .. .. .. .. ... .. .. .. .. .. .. .. .. .. .. .. .. .. .. .. .. .. .. .. .. .. .. .. .. .. .. .. ... .. 2-1 . .. . .. .. .. .. . . 2-6 .. .. .. .. .. . .. .......... .. .. ... . .... . . .. .. . .. ........2-3. .. .. .. .. .. .... .... . . . . . .. ... . 2-1. . . . ... . ..... 2-9. .. Thermophysical Properties . . .. .. .. 2.7. 3 Difference Due to Manufacturing processes... ..... . 2.8. .. .. .. .. .. . . . . . .. .. .... . ......... . . .. . . . . . . . . .. .. .. .. .. .. .. .. .. .. .. .. .. . .. .. .. ..... 2-9 . ...2-10. . . .. .. ..2-11. . . 2-11 .. v.
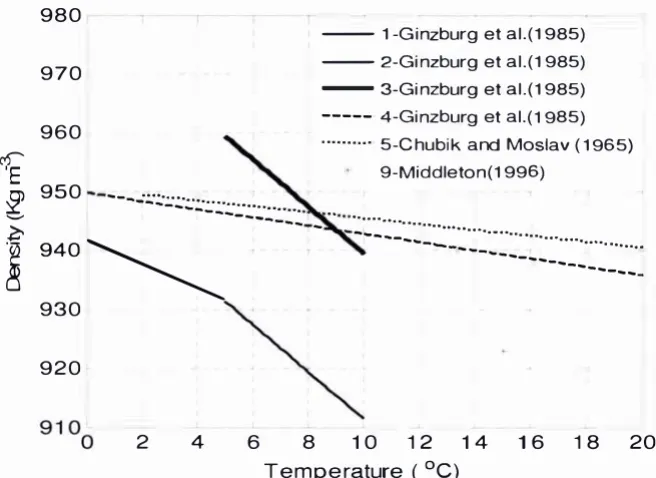
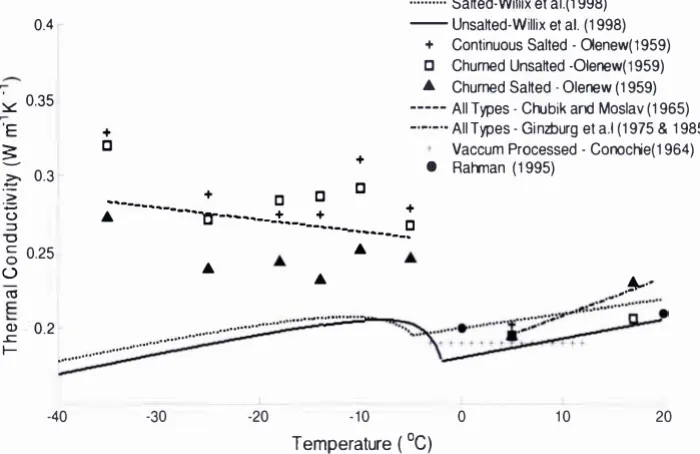
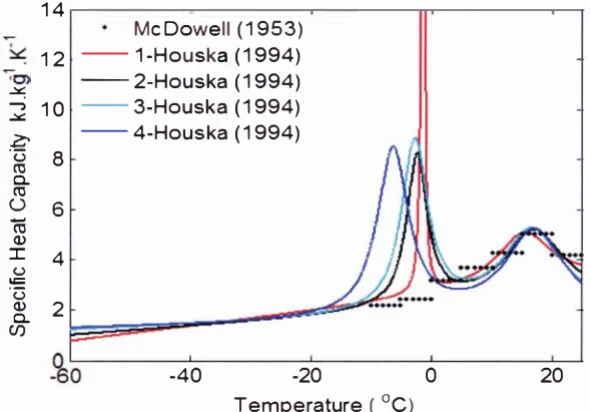
(8) 2.8.1 Initial Freezing Point.. .. .. .. .. .. .. .. .. .. .. .. .. .. .. .. .. .. .. .. .. .. .. .. .. .. .. . . . . . . .. .. .. .. .. .. .. .. 2-1 2. .. 2.8.2 Density........................................................ 2-14 2.8.3 Thermal Conductivity ......................................... 2-16 2.8.4 Specific Heat Capacity and Enthalpy............................ 2-19 2.9. Heat Transfer Models. .. .. .. .. . .. .. .. .. .. .. .. .. .. .. .. .. .. .. .. .. .. .. .. .. .. .. .. .. .. .. .. .. .. .. . .. . . .. .. .. . .. .2-24. 2.9.1 General Heat Conduction Equation ........................... 2-24 2.9.2 Initial and Boundary Conditions.............................. 2-25 2.9.3 Analytical Solution for Conduction Problems ................ 2-27 2.9.4 Numerical Solutions for Heat Transfer........................ 2-27 2.9.5 Freezing Models for Water - enriched foods.................... 2-2 8 2.10 Literature Conclusions. CHAPTER. 3:. .. .. .. .. .. .. .. .. .. .. .. .. .. .. .. .. .. .. .. .. .. .. .. .. .. .. .. .. .. .. .. .. .. .. .. .. .. .. .. .. .. . .. 2-30. ESTIMATION AND MEASUREMENT OF. THERMAL PROPERTIES OF BUTTER 3.1. Introduction......................................................... 3-1. 3.2. Material. 3.3. Initial Freezing Point.. .. .. .. .. .. .. .. .. .. .. .. .. .. .. .. .. . .. .. .. .. .. .. .. .. .. .. .. .. .. .. .. .. .. .. .. .. .. .. .. .. .. .. .. .. .. .. .. .. .. .. .. .. .. .. .. .. .. .. .. .. .. .. .. .. .. .. .. .. .. .. .. .. .. .. .. .. .. . . . . . . . . . . . . . . . . . . .. .. .. .. .. .. .. .. .. .. .. .. .. . . .. 3-1 3-7. 3.3.1 Measurement Methods......................................... 3-7 3 . 3 . 1 .1. Ex trapolation Method. 3 . 3 . 1 .2. Cal ibration with the Standard Solution. .. .. .. .. .. .. .. .. .. .. .. .. .. .. .. .. .. .. .. .. .. .. .. .. .. .. .. .. .. .. .. .. .. .. .. .. .. .. .. .. .. .. .. .. .. . . .. 3-8. . . . . .. 3-9. .. .. .. 3.3.2 Measurement of Initial freezing Point of Butter. ................... 3-9 3.3.3 Alternative Approaches 3 . 3 .3 . 1 3.3.3.2. .. .. .. .. .. ... .. .. .. . .. .. .. Empirical Curve Fitting Models Theoretical Models. .. .. .. .. .. .. .. .. .. .. .. .. .. .. .. .. .. .. .. .. .. .. .. .. .. .. .. .. .. .. .. .. .. .. . . .. 3-12. .. .. .. .. .. .. .. .. .. .. .. .. .. .. .. .. .. .. .. .. . . . . .. 3-12. .. .. .. .. .. .. .. .. .. .. .. .. .. .. .. .. .. .. .. .. . . . . .. 3-13. VI.
(9) 3.3.4 Estimation of Initial freezing Point of Salted Butter.. . . .. .. . . . . . . .. 3-16. 3.4. Density..................................................... , .......3-17. 3.5. Specific Heat Capacity and Enthalpy ...........................3-20 3.5.1 Measurement Techniques..................................... 3-20 3.5.2 Measurement of Specific heat Capacity and Enthalpy of Butter. .. .. .. .. .. . . . . . . . . . . . . . . . . . . . . . . . . . . . . . . . . . . . . . . . .. 3.5 .2.1. Generic Methodology. 3.5 .2.2. Measurement Technique. .. .. .. .. .. .. .. .. .. .. .. .. .. .. .. .. .. .. .. .. .. .. .. .. .. .. .. .. .. .. .. .. .. .. .. .. .. .. .. .. .. .. .. .. .. .. .. .. .. .. .. .. ... .. .. .. .. .. . . . . .. .. .. .. .. .. .. .. .. .. .. .. .. 3. 5.2.4. Phase Separation. 3 . 5 .2.5. Sample Homogeneity. 3 . 5 .2.6. Variation in Frozen Water Contents. 3 . 5 .2.7. Equilibrium Versu. 3 . 5 .2.8. Equilibrium versus Supercooling of the Bulk Fat Phase. 3 . 5 .2.9. Hysteresis Effects Brought About by Microstructure. 3.5.2. 1 0. Method S ummary. 3 . 5 .2. 1 1. Results and Discussion. 3 . 5.2. 1 2. Adjusting and Modeling the Measured Data. 3.5 .2.13. Comparison With Literature Data. .. .. .. .. .. .. .. Thermal Conductivity. .. .. .. .. .. .. .. .. .. .. .. .. .. .. .. .. .. .. .. .. .. .. .. .. .. .. .. .. .. .. .. .. .. .. .. .. .. .. .. .. .. .. .. .. .. .. .. .. .. .. .. .. .. .. .. .. .. .. .. .. .. .. .. .. .. .. .. .. .. .. .. .. .. .. .. .. .. .. .. .. .. .. .. .. .. .. .. .. .. .. .. .. .. .. .. .. .. .. .. .. .. .. .. .. .. .. .. .. .. .. .. .. .. .. .. .. .. .. .. .. .. .. .. .. Supercooling of the Water Phase. .. .. .. .. .. .. .. .. .. .. .. .. .. .. .. .. .. . .. .. .. .. .. .. .. .. .. .. .. .. .. .. .. .. .. .. .. .. .. .. .. .. .. .. .. .. .. .. .. .. .. .. .. .. .. .. .. .. .. .. .. .. .. .. .. .. .. .. .. .. .. .. .. .. .. . .. .. .. .. .. .. .. .. .. .. .. .. .. .. .. .. . .. .. .. .. .. .. .. .. .. .. .. .. .. .. .. .. .. .. .. .. .. .. .. .. . . .. . . . .. .. .. .. .. . . . .. .. .. .. .. .. .. .. .. .. .. .. .. .. .. .. .. .. .. .. .. .. .. . . . . .. .. .. .. . . . . .. .. .. . .. . . . . .. .. .. . .. . . .. . . . .. .. .. . . . .. .. .. .. .. .. .. .. .. .. . . .. .. .. .. . . .. .. .. Scanning Rate. .. .. .. 3 . 5 .2.3. 3.5.3 Conclusions 3.6. .. .. .. .. .. .. .. .. . . . .. . . .. . . .. .. .. 3-28 3-28 3-29 3-3 2 3-3 3 3-3 4 3-3 5 3-3 6 3-3 9 3-40 3-41 3-42 3-44 3-51 3-52 3-52. 3.6.1 Estimation of Thermal Conductivity of Butter. .............. 3-55 3.7. Conclusions. .. .. .. .. .. .. .. .. .. .. .. .. .. .. .. .. .. .. .. .. .. .. .. .. .. .. .. .. .. .. .. .. .. .. .. .. .. .. .. .. .. .. .. .. .. .. .. .. .. .. . . . .. .. .. 3-57. VII.
(10) C HAPTER 4 : HEAT TRANSFER I N BUTTER BLOCKS 4.1. Introduction. 4.2. Material and Method 4 . 2.1 B utter. .. .. .. .. .. .. .. .. .. .. .. .. .. .. .. .. .. .. .. .. .. .. .. .. .. .. .. .. .. .. .. .. .. .. .. .. .. .. .. .. .. .. .. .. .. .. .. .. .. .. .. .. .. .. .. .. .. .. .. .. . .. .. .. 4 . 2.2 Tempe rature Meas urements .. 4. 2.3 Posit ion of Thermoco uples .. .. .. .. .. .. .. .. .. .. .. .. .. .. .. .. .. .. .. .. .. .. .. .. .. .. .. .. .. .. .. .. .. .. .. .. .. .. .. .. .. .. .. .. .. .. .. .. .. .. .. . . . .. .. .. .. .. .. .. .. .. .. .. .. .. .. .. .. .. .. .. .. .. .. .. .. .. .. .. .. .. .. .. .. .. .. .. .. .. .. .. .. .. .. .. .. .. .. .. .. .. .. .. .. .. .. .. .. .. .. .. .. .. .. .. .. .. .. ..4-1. . . . .. .. . 4-1. .. .. .. .. . . .. .. .. .. .. ....... .. .. .. .. .. .. .. ... .. .. .. .. .. .. .. .. .. .. .. .. .. .. .. .. .. .. .. .. .. .. .. . .. .. .. 4-1. . . .. .. .. .. . .4-2. .. .4-2 .4-3. 4.2.3 . 1. Salted Pat (B 1 8). 4.2.3.2. Unsalted Pat ( B 1 6)......................................4-3. 4.2.3.3. Salted B lock ( B 1 5) .. 4.2.3.4. Unsalted Block (B 1 9). .. .. .. .. .. .. .. .. .. .. .. .. .. .. .. .. .. .. .. .. .. .. . .. .. .. .. .. Results and Discussion. .. .. .. .. .. .. .. .. .. .. .. . .. .. .. .. .. .. .. .. .. .. .. .. .. .. .. .. .. 4.3 . 1 Hea t Transfe r in Salted B utter P ats. .. .. .. .. .. .. .. .. .. .. .. .. .. .. .. .. .. .. .. .. .. .. .. .. .. .. .. .. .. .. .. .. .. .. .. 4 . 3 . 3 Hea t T rans fer in Salted B utter B loc ks. .. .. .. .. .. .. .. .. .. .. .. .. .. .. .. C HAPTER 5. -. .. .. .. .. .. . . .. .. .. .. .. .. .. .. .. .. .. .. .. .. .. .. .. .. .. .. .. .. .. .. .. .. .. .. .. .. .. .. .. .. .. .. .. .. .. .. . . .. .. .. .. .. .. ... .. .. .. .. .. .. .. .. .. .. .. .. .. .. .. .. .. .. .. .. .. .. .. .. .. .. .. .. .. .. .. .. .. .. .. .. .. .. .. .. ... .. . .. .. .. .. .. .. .. .. . .. . . .. .. . . . . .. .. .. .. .. .. .. .. .. .. .. . . .. .. .. .. .. .. .. .. .. .. .. . .. .. .. .. .. 4 . 3 . 2 Heat Trans fe r in Unsalted B utter Pats. Conclusions. .. .. .. .. ... .... . . . .. 4.3.4 Heat T rans fer in Unsal ted B utter B loc ks 4.4. .. .. 4.2.4 Initial and Ambient Conditions . .. ... . 4.3. .. .4-5. . . .. .4-5. . ...4-7 .. .. .. .. .. .. .. .. .. .. .. .. .. .. .. .. .. .. .. .. .. .. .. .. .. .4-4. .. .. .. .. .. .4-7. 4-10 4-15 4-21. .4-26. MODELING HEAT T RANSFER IN BUTTER. 5.1. Introduction. 5.2. Model Formulation. .. .. .. .. .. .. .. .. .. .. .. .. .. .. .. .. .. 5 .2. 1 Conc eptual Model. .. .. .. .. .. . . .. .. .. .. .. .. .. .. .. .. .. .. .. .. .. .. .. .. .. .. .. .. .. .. .. .. .. .. .. .. .. .. .. .. .. .. .. .. .. .. .. .. .. .. .. .. .. .. .. .. .. . . .. .. .. .. .. .. .. .. .. .. .. .. .. .. .. .. .. .. .. .. .. .. .. .. .. .. .. .. .. .. .. .. .. .. .. .. .. .. .. .. .. .. .. .. .. .. .. .. .. .. .. .. .. .. .. .. .. .. .. .. .. .. .. .. .. .. .. .. .. .. .. .. .. .. .. .. .. .. .. .. .. .. .. .. .. .. .. .. .. .. .. .. .. .. .. .. .. .. .. .. . . .. .. .. .. .. .. .. .. .. .. .. .. .. .. .. .. .. .. .. .. .. .. .. .. .. .. .. .. .. .. 5 . 2. 2 Validit y o f Ass umptions . .. .. 5 . 2.3 Mathe matical Form ul ation. .. .. .. .. . .. .. .. .. . .. .. . .. 5-1 5-1 5-1 5-2 5-4. V111.
(11) 5.3. System Input Parameters. 5.4. Numerical Solution of the Heat Transfer ModeL ..............5-6. 5.5. Maths Checking ....................................................5-7. .. .. .. .. .. .. .. 5 . 5 . 1 N umerical Error Chec king. .. .. .. .. .. .. .. .. .. .. .. .. .. .. .. .. .. .. .. .. .. .. .. .. .. .. .. .. .. .. .. .. .. .. .. .. .. .. .. .. 5 . 5 . 2 Chec ks against Pre viousl y Val idated S o l ution 5.6. Evaluation of Mathematical Model 5 .6. 1 Sensiti vi t y Anal ysis. .. .. .. .. .. .. .. .. .. .. .. 5 . 6 . 2 Model Predictions - Thawing. .. .. .. .. .. .. .. .. .. .. .. .. .. .. .. .. .. .. .. .. .. .. .. .. .. .. .. .. 5 .6.2 . 1. Predicting Thawing of Pats. 5 .6.2.2. Predi cti ng Th awi ng of B l ocks .. .. .. .. .. 5 .6. 3 Model Predictions - Freezing . .. 5.7. .. .. .. .. .. .. .. .. .. 5. 6.3. 1. Predicti ng Freezing of Pats. 5 .6.3.2. Predicting Freezing of B l ocks. .. .. .. .. .. . .. .. . .. .. .. .. .. .. .. .. .. .. .. .. .. .. .. .. .. .. .. .. .. .. .. .. .. .. .. .. .. .. .. .. .. .. .. .. .. .. .. .. .. .. .. .. .. .. .. .. .. .. .. .. .. . . .. .. .. .. .. .. .. .. .. .. .. .. .. .. .. .. . . . .. .. .. .. .. .. .. .. .. .. .. .. .. .. .. .. . . . .. .. .. .. .. .. .. .. .. .. .. .. .. .. .. .. .. .. .. .. .. .. .. .. .. .. .. .. .. .. .. .. .. .. .. .. .. .. .. .. .. .. .. .. .. .. .. .. .. .. .. .. .. .. .. .. .. .. .. .. .. .. .. .. .. .. .. .. .. .. .. .. .. .. .. .. .. .. .. .. .. .. .. .. .. .. .. .. .. . . . .. .. .. .. .. .. .. .. .. .. .. .. .. .. .. .. .. .. .. .. .. . . . .. .. .. .. .. .. .. .. .. .. .. . . . .. .. 5-8 5-9 5-9. 5-12. . . .. .. 5 -7. 5-11. . . .. .. 5-6. 5-18. . 5-25 . .. 5-25 5-3 0. Conclusions ........................................................5-3 6 5. 7. 1 Thawing o f B utter. .. .. .. .. .. .. .. .. .. .. 5 . 7.2 Freezing of B utter. .. .. .. .. .. .. .. .. .. .. .. .. .. .. .. .. .. .. .. .. .. .. .. .. .. .. .. .. .. .. .. .. .. .. .. .. .. .. .. .. .. .. . . . .. .. .. .. .. .. .. .. .. .. .. .. .. .. .. .. .. .. .. .. .. .. .. .. .. .. .. .. .. .. . . . .. 5-3 6 5-3 6. C HAPTER 6 - MODELING FREEZING OF BUTTER 6.1. Introduction. 6.2. Model Formulation ................................................ 6-2. 6.3. Model Freezing Kinetics ...........................................6-4. 6.4. Measurement and Estimation of Input Data ....................6-9. .. .. .. .. .. .. .. .. .. .. .. .. .. .. .. .. .. .. .. .. .. .. .. .. .. .. .. 6.4. 1 Meas urement o f N ucleation Rate 6.4. 2 S peci fic Heat Capacity. .. .. .. .. .. .. .. .. .. .. .. .. .. .. .. .. .. .. .. .. .. .. .. .. .. .. .. .. .. .. .. .. .. .. .. .. .. .. .. .. .. .. .. .. .. .. .. .. .. .. .. .. .. .. .. .. .. .. .. .. .. .. .. .. .. .. .. .. .. .. .. .. .. .. .. .. .. .. .. .. .. .. .. .. . . . . . .. .. .. .. .. .. .. .. .. 6-1. 6-10 6-16. IX.
(12) 6.4. 3 Equilibrium Freezing Tem perature 6.4.4. Latent Heat .. . . . . . . . .. .. . . . .. . . . . . . . . . . . . . . . . . . . . . . . . . . . . . . . .. 6.4.5 Thermal Conducti vity 6.4.6 Model Solution. . . .. . . . . . . . . . . . . . . . . . . . . . . . . .. .. . . . .... . . . . . . .. . . . . . . . . . . . . .... .. . . . . . . . . . . . . ... ............................................. ................ 6.5. Nucleation Only Model Predictions. ... 6.6. Avrami Model Predictions. ... . . . .. .. . .. . . . .. ... . . . . . . . . . . . . . . . . .. .. . . .. ... . . . . . . . . . . .. .. . .. .. . .. . . ... . . ... 6-19 6-21 6-21 6-21 6-21 6-23. 6.6. 1 Unsalted Butter B lock (BI9) ..................................6-23 6.6. 2 Sensiti vi t y Anal ysis .......................................... 6-25 6.6.3 S alted and Un salted Pats...................................... 6-26 6.6.3 . 1. Salted Pat CB 1 8). 6.6.3 .2. Unsalted Pat CB 1 6). . . . . . . . . . .. . . . . .. . . . . . . . . . . . . . .. . . . . . . . . . . . . . .. . . . . . . . . . . .. .. .. . . . . . . ..... . . .. .. . . . . ..... 6-2 6. 6-29. 6.6.4 Predictions fo r Salted Butter Bloc k...........................6-30 6.7. Conclusions. . . . . . . . . . . . . . . . . . . . . . . . . . . .. . . . .. .. . . . . . . . . . . . . . . . . . .. .. . . . ... 6-31. CHAPTER 7 : HEAT TRANSFER IN PALLETIZED BUTTER 7.1. Introduction. 7.2. Data Collection. . . . . . . . . . . . .. . . . . . . . . . . . . . . . . . . . . . . . . . . . . . . . . . .. . . . . . . . . . . .. .. . . . .. .. . . . . . . . . . . . . . . . . . .. .. .. . . . . . . ..... . . . . . . . . . . . . . . . ... 7-1 7-1. 7. 2.1 Full Pallet Trials................................................ 7 -3 7. 2. 2 Hal f Pal let Trials.................................................7-6 7.3. Experimental Results. . . . . . .. .. . . . . . .. .. . . . . .. ... . . . . . . . . . . . . . . . . . . . . . .... 7-11. 7. 3.1 Trial 1- Wra pped Ful l Pallet . .................................7-11 7.3 . 2 Trial 2- Un wra pped Full Pallet . .............................. 7-17 7.3 . 3 Trial 3 - Wra pped Loosel y Stac ked Half Pallet ..............7-25 7. 3.4 Trial 4 - u n wra pped Tightl y Stac ked Hal f Pallet ............ 7-33. x.
(13) 7. 3 .S T rial S - Un wra pped Loose ly Stac ked Hal f Pal let . ........7-41 .. 7.4. .. Conclusions ........................................................7-50. CHAPTER 8 : MODELING HEAT TRANSFER IN PALLETISED B UTTER 8.1. Introduction......................................................... 8-1. 8.2. Modeling Approaches ..............................................8-2 8.2.1 Modeling Heat T rans fe r in Pallets With No Inte rnal Ai r Flo w....................................... ...... ...... ...... 8-3 .. .. .. 8.2. 1 . 1. Calculation of the Volume of Air Gaps............... . ..8-3. 8 .2 . 1 .2. Effective Thermal Conductivity Model.... ... ...........8-4. 8 . 2 . 1.3. Effective Density. .................................. 8 . 2 . 1 .4. Effective Specific Heat Capacity and Enthalpy.... ......... 8-5. 8.2. 1 .5. Effective Heat Transfer Coefficients, Ambi ent and Initial. .. .. .. .. .. .... ..8-5. .. Conditions ...........................................................8-7 8 .2 . 1 .6. Results and Discussion. .. .. ....... .....................8-9 .. .. 8.2.2 Modeling Heat T rans fe r in Pal lets With Inte rnal Air Flo w.. .8-15 .. 8.3. Conclusions ........................................................8-29. CHAPTER 9 : CONCLUSIONS AND RECOMMENDATIONS 9 1 .. Conclusions ............................................................................9-1. 9.2. Recommendations ..................................................................9-2. REFERENCES APPENDICES. R-1. ............................................................................... . . . ......... ................... . ..... . . . . . ... . . . ......... . . . . . . . . .............. A-1. XI.
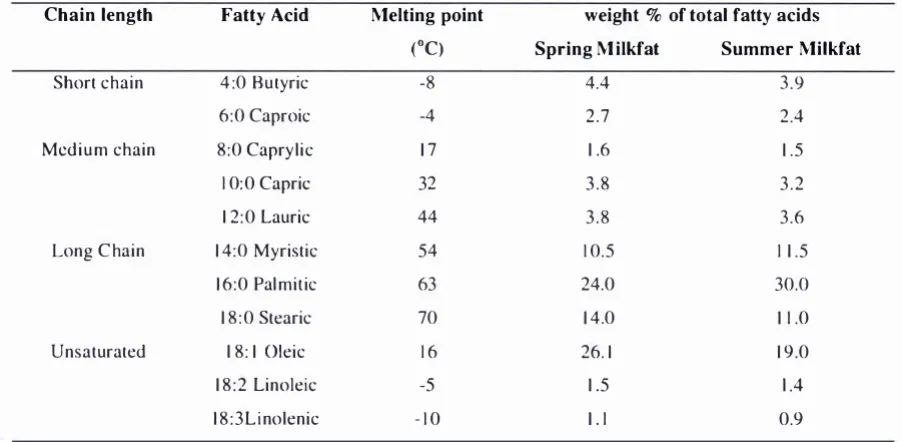
(14) LIST OF TABLES Table 2 . 1. Fatty acids compositio n of spring and summer rnilkfat. . . . . . . . . . . . . . . . . . . . . . . . . . . . .. Table 2 . 2. Composition of butter used by Pham ( 1 994) and Lindsay &. 2-3. Lovatt ( 1 993). . . . . .. . . . . . . . . . . . . . . . . . . . . . . . . . . . . . . . . . . . . . . . . . . . . . . . . . . . . . . . . . . . . . . . . . . . . . . . . . . . . . . . . . . . . . . .. 2- 1 3. Table 2 . 3. Freezing point depression of salted and unsalted butters. . . . . . . . . . . . . . . . . . . . . . . . . . .. 2- 1 3. Table 2 .4. Density of butters as a function of temperature and air contents. . . . . . . . . . . . . . .. 2- 1 4. Table 2 . 5. Composition of butter and fitted parameters for the thermal conductivity mode1 . . . . . . . . . . . . . . . . . . . . . . . . . . . . . . . . . . . . . . . . . . . . . . . . . . . . . . . . . . . . . . . . . . . . . . . . . . . . . . . .. . . . . . . . . . . . . . . . . . . . . . . . . .. 2- 1 6. Table 2 . 6. Thermal conductivity of butter (Olenew, 1 959) . . . . . . . . . . . . . . . . . . . . . . . . . . . . . . . . . . . . . . . . .. 2- 1 7. Table 2 .7. Specific heat capacity of butter for different composi tion (Houska et a1. 1 95 3 ). . . . . . . . . . . . . . . . . . . . . . . . . . . . . . . . . . . . . . . . . . . . . . . . . . . . . . . . . . . . . . . . . . . . . . . . . . . . .. . . . ... Table 2 .8. Average specific heat capacity of unsalted butter as a function of Temperature ( McDowell , 1 953). . . . . . . . . . . . . . . . . . . . . . . . . . . . . . . . . . . . . . . . . . . . . . . . . . . . . . . . . . . . . . . . .. Table 2 . 9. Enthalpy. of. butter. for. different. composition. Houska. et. 2-20. a1 .. ( 1 994) . . . . . . . . . . . . . . . . . .. . . . . . . . . . . . . . . . . . . . . . . . . . . . . . . . . . . . . . . . . . . . . . . . . . . . . . . . . . . . . . . . . . . . . . . . . . . . . . . . . . . . . . . . Table 2 . 1 0. 2- 1 9. 2-2 1. Parameters fitted to enthalpy equations for different compositions of butter. . . . . . . . . . . . . . . . . . . . . . . . . . . . . . . . . . . . . . . . . . . . . . . . . . . . . . . . . . . . . . . . . . . . . . . . . . . . . . . . . . . . . . . . . . . . . . . .. . . . . . . . . . . .. 2-22. Table 3 . 1. Butter samples collected from different seasons . . . . . . . . . . . . . . . . . . . . . . . . . . . . . . . . . . . . . . . . .. 3-2. Table 3 . 2. Composition of butters . . . . . . . . . . . . . . . . . . . . . . . . . . . . . . . . . . . . . . . . . . . . . . . . . . . . . . . . . . . . . . . . . . . . . . . . . . . . . . . .. 3-3. Table 3 . 3. Sol i d fat contents of butter at different temperatures . . . . . . . . . . . . . . . . . . . . . . . . . . . . . . . . . .. 3-4. Table 3.4. Measured initial freezi ng poi nt of unsalted butters . . . . . . . . . . . . . . . . . . . . . . . . . . . . . . . . . . . . .. Table 3.5. Sol ute concentration in the aqueous phase of butter compared with. TiJ·.... .. 3- 1 0 3- 1 1. Table 3 . 6. Element analysis of salted, unsalted and lactic butter.. . . . . . . . . . . . . . . . . . . . . . . . . . . . . . . .. 3- 1 5. Table 3 . 7. Initi al freezing poi n t esti mated using salt solution and empirical curve fitti ng. . . . . . . . . . . . . . . . . . . . . . . . . . . . . . . . . . . . . . . . . . . . . . . . . . . . . . . . . . . . . . . .. . . . . . . . . . . . . . . . . . . . . . . . . . . . . . . . . . . . . . . . . . .. 3- 1 7. Table 3 . 8. Density of butter measured at 1 2°C . . . . . . . . . . . . . . . . . . .. . . . . . . . . . . . . . . . . . . . . . . . . . . . . . . . . . . . . . . . . .. 3- 1 8. Table 3 .9. Density of butter measured at 20°C . . . . . . . . . . . . . . . . .. . . . . . . . . . . . . . . . . . . . . . . . . . . . . . . . . . . . . . . . . . . .. 3- 1 9. Table 3 . 1 0. Cal i bration standards for the DSC. . . . . . . . . . . . . . . . . . . . . . . . . . . . . . . . . . . . . . . . . . . . . . . . . . . . . . . . . . . . . .. 3-29. Table 3 . 1 1. Constants for speci fic heat capacity of sapphire . . . . . . . . . . . . . . . . . . . . . . . . . . . . . . . . . . . . . . . . .. 3-30. Table 3 . 1 2. Comparison of measured and DSC derived initial freezing point . . . . . . . . . . . . . .. 3-43. XII.
(15) Table 3 . 1 3. Enthalpy equations parameters for all butters . . . . . . . . . . . .. . . ... . . . . . . . . . . . .. . . . . . . . . . . . . . .. Table 3 . 1 4. Thermal conductivi ty of butter components in frozen and u nfrozen range using Chio & Okos ( 1 986) models . . . . . . . . . . . . . . . . . . .. . .. . . . . . . . . . . . . . . . . . . . . . .. Table 4. 1. Di mensions. and. type. of. butter. used. in. experi ments. 3-56. (without. packaging).. . .. . . . . . . . . .. . . . . . . . . . . . . . . . . . . .. . . .. . .. . . . . . . . . . . . .. .. . . . . . . . . . . . . . . . . . . . .. .. . . . . ..... . . . . . . . . . . Table 4.2. 3-47. 4- 1. Thermocouple position in the butter block with the origin as shown in Figure 4.3 . . . . . . . . . . . . . . . . . . . . . . . . . .. .. . .. . . . ... . . .. .. . . ... . . . . . . . . . . . . . . . . . . . .. . . . . . . . . ... . . . . .. . . .. . . . . .. 4-5. Table 4.3. Experimental conditions for the trial on butter pats and blocks . .. .. .. . . . . . .. . . . .. 4-6. Table 5 . 1. Sensitivity anal ysis of the heat transfer models . . . . .. . .. .. . . . . . . . . . . . . . . . . . . . . . . . . . . . . . . .. 5- 1 0. Table 5 . 2. Input data for salted butter pat (B 1 8 ) heat trans fer predictions (Trial SPH - I) . . . . . . . . . . . . . . . . . . . . . . .. . . . . . . . .. . . . .. . . .. . . . . . . . . . . . . . . . . . . . . . . . . .. . . . .. . . . . . . . . .. . .. . . . . . .. Table 5 . 3. Input data for u nsalted butter pat (B 1 6) heat transfer predictions (Trial UPH - 1 ) . . .. . . . . . .. . . . . . .. . . .. . . . . . .. . . . . .. . . . . . . . . . . . . . . . . . . .. . . .. .. .... . . .. . . . . . . . . . . . . . . . . . . . . . .. Table 5 .4. 5-28. Input data for s alted butter block (B 1 5 ) heat transfer predictions (Trial SBC - 1 a). ... . . . . . . . . . . . . . . . . . . . . . . . . . .. . . . . . . . . . . . . . ... Table 5 . 1 1. 5 -26. Input data for u nsalted butter block (B 1 6) heat transfer predi ctions (Trial UPC - ]). . . . . . . . . . . . . . . . . . . . . .. . . . .. ... . . . . . .. .. . . . . . . . . . . . . . . . . . . . . . . . . . . . . . .. . .. .. . . . . . . . . ... . . . . .. Table 5 . 1 0. 5-24. Input data for salted butter pat (B 1 8 ) heat transfer predictions (Trial SPC - I ) . . . .. . . . .. . .. . .. . .. . . .. . .. . . . . . . . . . . . . . . . . . . . . . . . . . . . . . . . . . . . .. .. . .. . . . . . . . . . . . . . . . . . . . . . . .. Table 5 .9. 5 -2 2. Input data for u nsalted butter block (B 1 9) heat transfer predictions (Trial UBH - I a). . . . . . . . . . . . . . . . . . . . . . . . . . . . . . . . . . . . . . . . . . . . . .. . . . . . . .. . . . . . . . . . . . . . . . . . . . . . . . . . . . . . . . . . .. Table 5 . 8. 5- 1 8. Input data for u nsalted butter pat (B I S) heat transfer predictions (Trial SBH - 2a). . . . . . . . .. . . . . . .. .. . . . . . . . . . . . . . . . . . . . . . . . . . . . . .. . ... . .. . . ... . . . . . . . . . . . . . . . . . . . . . . . . . . . . .. Table 5 .7. 5-17. Input data for u nsalted butter pat ( B 1 6) heat transfer predictions (Trial UPH - 3 ). . . . . . . . ... . .. . . . . . . . . . . . . . . . . . . . . . . . . . . . . . . . . . . . . . . .... . . .. . . .. . . . . . . . . . . . . . . . . . . . . . . . . . . .. Table 5 .6. 5- 1 4. I nput data for u nsalted butter pat (B I S) heat transfer predictions (Trial SBH -I a ). . . .. . . . .. . . . . .. . . . . . . . . . . . . . . . . . . . . . . . . . . . . . . . . . . . . . . .. .. . . . . . . . . . . . . . . . . . . . . . . . . . . . . . . . . .. Table 5 . 5. 5- 1 2. '". . . . . . . . .. ... . . . . . . . . . . . . . . . . . . . . . . . . .. . . .. 5 -3 1. Input data for unsalted butter block (B 1 8) heat transfer predictions (Trial UBC - 1 a) . .. . . . . ... . .. . . . . . . . . . . . . . . . . . . . . . . . . . . . . . . . . . . . . ... . .. . .. . . . . . . . . .. . . . . . . . . . . . . . . . . . . . . .. 5 -34. Table 6 . 1. Theoretical values of A vrami constants . .. . .. . . . . . . . . . . . . . . . . . . . . . . . . . ... 6-8. Table 6.2. Measured kinetics constants 'a' and 'b' for different emulsions .... . . . .... . . .. .. ' ". .. . . ... ... . . . . .. . .. 6- 1 2. xiii.
(16) Table 6 . 3. Calculation of the nucleation rate J fro m the experimental data. ... . . . . . . . . . . . . .. 6- 1 5. Table 6 .4. Enthalpy equation parameters for experimental butters . . . . . . . . . . . . . . . . . . . . . . . . . . . . . .. 6- 1 8. Table 7 . 1. Experiment plan for half and ful l pallet trials. . . . . . . . . . ... . . . . . . . . . . . . . . . . . . . . . . . . . . . . . . . .. 7-3. Table 8 . 1. Pal let component thermal properties . . . . . . . . . . . . . . . . . . . .. . . . . . . . . . . . . . . . . . . . . . . . . . . . . . . . . . . . . . .. 8-3. Table 8 .2. S ummary of the effective properties for butter h alf and full pallet used in model predictions. . . . . . . . . . . . . . . . . . . . . . . . . . . . . . . . . . . . . . . . . . . . . . . . . . . . . . . . . . . . . . . . . . . . . . . . . . . .. 8-6. Input data for the full pal let and half pallet trials. . . . . . . . . . . . . . . . . . . . . . . . . . . . . . . . . . . . . . . .. 8-8. to predict freezing in trial PC. -. 5 . . . . . . . . . . . . . . . . . . . . . . . . . . . . . . . . . . . . . . . . . . . . . . . . . . . .. . . . . . . . . . . .. 8- \ 8. to predict thawing in trial PH. -. 5................................................................. 8-20. Table 8.6. Input data for unwrapped loosely stacked triaL. . . . . . . . . . . . . . . . . . . . . . . . . . . . . . . . . . . . . . . .. 8-20. Table 8.7. Input data for unwrapped ti ght packed ful l pallet triaL. . . . . . . . . . . . . . . . . . . . . . . . . . . . . .. 8-24. Table 8 .3 Table 8 .4. Table 8 . 5. 2 ' Effective heat transfer coeffi cients (W m- K ) used in the model. 2 ' Effective heat transfer coefficients (W m- K ) used in the model. xiv.
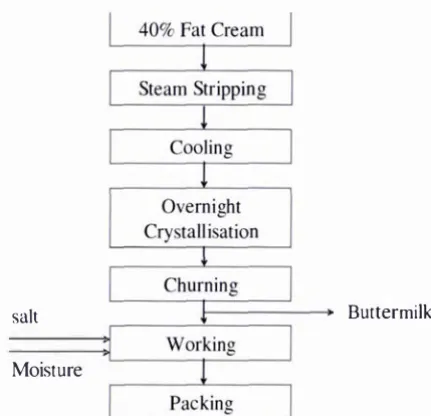
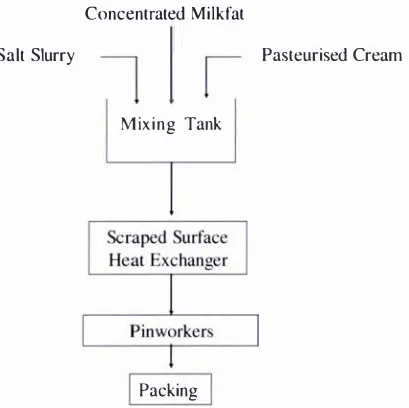
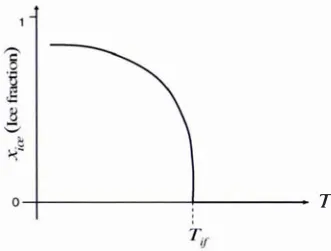
(17) LIST OF FIGURES. Figure 2 . 1. Structure o f butter . . . . . . . . . . . . . . . . . . . . . . . . . . . . . . . . . . . . . . . . . . . . . . . . . . . . . . . . . . . 2-2. Figure 2 . 2. Most extreme differences between New Zealand summer and spri ng. ... ... .. .. .. ... .. . .. ... ... ... . .. .. .. .. ... .. ... ... . .. milkfat ( MacGibbon, 1 993). . . .. . . . . .. .. .. .. . . . . .. . . . . .. .. . . . .. .. . . . . . . . . . . . . .. . . . . . 2-5 Figure 2 . 3. The temperature transition of the five stages of freezing for water and aqueous solution . . ... .. .. . . .. ... .. . . .. . . .. .. . . .. .. .... .... ... ... ....... ... . .... .. .. .... . ... ... .. .. .. .. .. .. .. .. .. .. .. ... ..... . . . 2-7. The Fritz butter m aking process . . . . .. Figure 2 . 5. The Ammix butter making proces s. Figure 2.6. Schematic diagram of temperature-ice fraction relationship. Figure 2.7. Density of butter as a function of temperature . . .. Figure 2 . 8. Thermal conducti vity of butter as a function of temperature . . . . . . . . . . . . . . . . . . . . . 2- 1 8. Figure 2 .9. Specific heat capacity of butter as a function o f temperature. .. . . . .. . .. . . .. ... ... .. .. . . . . . . .. .... . .. . . . . .. .. Figure 2.4. . .. . ... .. .. . .. . .. . . . .. .. ... .. .. . . .. .. . .. .. .. .. ..... ... ... . .. .. .. . . . . . . . . . . . . . . . . . . . 2-9 .. .. .. .. ........ . . . . . .. . .. . ... . . . . . . . . .. . . . . . . . . . . . . . . . . . . . . . . . .. .. .. .. .. .. .. .. .. .... .. ..... .. . . . ......... . . .. . . . . . .. . . . .. . ..... .. Sol id fat contents of butter (a ) Su mmer (b) Spri ng (C) Autumn. Figure 3.3. Thermal history of a sample durin g ceroscopy measurements . . . .. Fi gure 3.4. Extrapolation method for determining the initial freezing point. . . . . . . . . . . . . . . . 3-8. Figure 3 . 5. Initial freezi ng point of unsalted butters as a function of solute. ... . . . .. .... . . . ..... . .. ..... .. . . .. .. .. . .. . .. . . . 2-23. Figure 3.2. .. .. . .. . . . . .. .. Solid fat contents of Summer, Spring and Autumn mi l k fat . . . . . . . . . . . . . . . . . . . . . . . . 3-5. ..... .. .. . 2-20. Figure 3 . 1. .. .. ... .. Enthalpy - Temperature relationship . . . .. .... .. ...... 2- 1 2. Figure 2 . 1 1. .. . ... ... 2- 1 0. . . . . . . . . . . . . . . . . . . . . . . . .. 2- 1 5 .. Figure 2 . 1 0 Enthalpy of butter as a function of temperature . . . . .. .. ... .. . . .... . . . . ...... . . . . . . .. . .. concentration in the aqueous phase. . . . . . . .. . . . . . .. .. . . . . . . . . . . .. . . .. .. .. . 2-30. . . 3-5 .. . . . .. .. .. . . 3-8. .. . . . . . ... . . . . . . . . . .. . . . . . . . .. . . .. 3-1 1. Fi gure 3.6. Estimation of initial freezing poi n t from measured enthalpy data...... . . . . .... 3 - l 4. Figure 3.7. Initial freezing point of salt sol utions .. Figure 3.8. (a) Comparison calorimeter (b) Example of coo l ing curve for use. . . .. i n method of comparison calorimeter. Fi gure 3 . 9. .... .. . . . . . . . .. ........... ... ... ..... . . ... ... .... .. . . . . . ... .. .. ... .... . .. . . .. . .. . .. Specific heat capacity measurement for frozen specimen. .. . . . . .. .. ... . .. . . . .. . . . .. . . . . . . . . . . .. .. .. .... .. . . . . . .. 3- 1 6. .. . .. . . . . . . . . . .. . . . . . . . . . .. . . . . .. 3-22 3-23. Fi gure 3 . 1 0 The concept of guarded hot plate method for specific heat capacity measurement. Figure 3 . 1 1. . . . . . . . . . . . . . . . . . . . . .. . . .. . . . . . . . . . . . . . . . . . . . . . . . . . . . ...... . . . . . . . . . . . . . . . . . . . . . . .. . . . . . . . . . . . . .. Schematic diagram of di fferential scanning calorimeter. . . . . .. Figure 3 . 1 2 Typical specific h eat thermogram o f food by DSC.. .. .. . .. . .. .. . .. ........ . .. . . .. . .. .... . .. .. ... . . .. .. ... ... .... . . . . .. 3-24. . 3-25. . . . . . 3-27 .. .. Figure 3 . 1 3 Measured specific heat capacity and enthalpy of sapphire. xv.
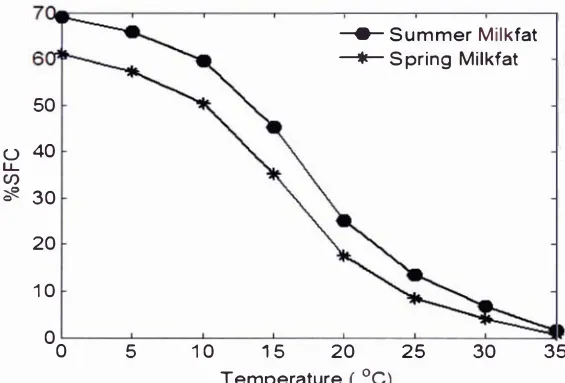
(18) compared with literature data. .. .............. . . . . . .............. . ......................... .... ......... 3-30. Figure 3. 1 4 (a) Specific heat capacity (b) Enthalpy of unsalted butter (B 1 7) with two curve method compared with Mohsenin' s Method. ........................ 3 -3 1. Figure 3. 1 5 (a) Specific heat capacity ( b ) Enthalpy of salted butter (B 1 5) at different scanning rates. .... ........................ ......... . ........................................ 3-32. Figure 3. 1 6 (a) Specific heat capacity ( b)Enthalpy from repeated DSC trial with the same sample of butter (B 1 5 ) . .... ..... . ...... .. . . . . . . .. . .... .. ..... . ..... . ...... . ... .. . 3-34 Figure 3. 1 7 (a) Specific heat capacity (b) Enthalpy of the same kind of butter (B 1 7 ) for two samples done o n the same day... .. . .. . . . ....... .. . . . . . . . . . . . . . . . . . . . . . .. .. . . 3-34 Fi gure 3. 1 8 (a) Specifi c heat capacity (b) Enthalpy of unsalted butter (B 1 7) frozen to different temperatures. ....... . . .......... . . . . . . . . . . .. . . .......... ......... . ..... ......... 3-35. Fi gure 3. 1 9 (a) Specific heat capacity (b) Enthalpy of salted butter (B 1 5) measured by heating runs after cool i ng to -20°C, -40°C and at to -70°C . . . . . . . . .... . . . .. . . . 3-36 .. Fi gure 3.20 Cooling of salted butter sample (B 1 5) at a rate of lOoCmi n-1 to avoid water supercool i ng problem. . . ....................... . . .. . . . . . . . . . . . . ... .. .. . ....... ...... 3-36 Fi gure 3.2 1. Specific heat capacity repeated heating and cooling of one unsalted butter sample ( B 1 2 ).......................... ... . . . ...... . . .. .. . . . . . .. .. . .................. 3-37. Fi gure 3.22 Specific heat capacity measured form repeated heating and cooling DSC runs for one salted butter sample (B 1 5) . . . . . . . . .. . .. . . . . . . . .. .. .... ...... 3-38 Fi gure 3.23 Specific heat capacity of repeated heating and cooling of rnilkfat. . ............. 3-39 Fi gure 3 .24 Specific heat capacity and enthalpy of milkfat compared with the specific heat capacity and enthalpy of salted butter (B 1 5 ) freeze to -40°C and unsalted butter (B 1 9) freeze to -20°C. .......... . . . . . . . . . . . . . . . . . . . . ... . . . . 3-40 Fi gure 3.25 Specific heat capacity (a) U nsalted butter (B 1 9) (b) Salted butter (b 1 5 ) measured by cooling DSC ru ns. Run 2 measured ei ght months later than Run 1 . .. .... ....... ... ....... . . . .. . ... . ..... .......... ....... ..... .... .. .... 3-4 1 Figure 3.26 Measured enthalpy for (a) Salted butters (b) Unsalted butters using DSC.. ..... . .. . ........ .. Fi gure 3.27 Measured and modeled enthalpy of butter. Fi gure 3.2 8 Modeled data for unsalted b utters. .. .. . . . .. . . . . . . . . . ..... ....... . . . . ..... . . . . . ......... . . . . ........ ........ . . . . . . . ........................ .. ............ . ..... . .. . . ....... . .............. . . . . . .......... Fi gure 3.29 Solid fat contents of butters at different temperatures. ..... . . . . . .................... ......... 3-44. 3-46 3-47. 3-48. XVI.
(19) Figure 3 .30 (a) Adjusted enthalpy for salted butters (b) Sol id fat contents for salted butters . . . . . . . . . . . . . . . . . . . . . . . . . . . . . . . . . . . . . . . . . . . . . . . . . . . . . . . . . 3-49 Figure 3 . 3 1. a) Adjusted enthalpy for lactic butters (b) Solid fat contents for lactic butters . . . . . . . . . . . . . . . . . . . . . . . . . . . . . . . . . . . . . . . . . . . . . . . . . . . . . . . . . . 3-50. Figure 3.32 Comparison of measured enthalpy data with the literature data. . . . . . . . . . . . . . . . . . 3-5 1 Fi gure 4. 1. Position of thermocouples in the salted butter pat (B 1 8) . . . . . . . . . . . . . . . . . . . . . . . . . . . . . .4-3. Fi gure 4.2. Position of thermocouples in the unsalted butter pat (B 1 6) . . . . . . . . . . . . . . . . . . . . . . . . . .4-4. Figure 4.3. Position of thermocouples in the salted butter block (B I S) . . . . . . . . . . . . . . . . . . . . . . . . . .4-4. Fi gure 4.4. Position of thermocouples in the unsalted butter block (B 1 9) . . . . . . . . . . . . . . . . . . . . . .4-5. Figure 4.S. Heat transfer i n salted butter pat (B 1 8 ) (a) Cooling (SPC - I ) with: Ti = 1 0°C, Ta = -24°C, tp= I Oh (b) Heating (SPH - \ ) with :Ti =-24°C, Ta = l OoC, tp= 1 3h . . . . . . . . . . . . . . . . . . . . . . . . . . . . . 4-7. Figure 4.6. Heat transfer in salted butter pat (B 1 8) (a) Cooling (SPC - 2 ) for 60 hours (b) :Thawing (SPH - 2 )after cooling at -2SoC for 60 hours . . . . . . . . . . . . . . . . . . . . . . . . . . . .4-9. Figure 4.7. Heat transfer in unsa1ted butter pat (B 1 6) (a)Cooling ( UPC - I ) with: Ti = 1 5°C, Ta = - I SoC, tp= 1 0h (b) Heating(UPH - I )wi th: Ti = I SoC, Ta = 20°C, tp= 1 2h . . . . . . . . . . . . . . . . . . . . . . . . . . . .4- 1 1. Fi gure 4.8. Heat transfer i n unsalted butter pat (B 1 6) (a) Cooling (UPC - 2 ) with: Ti = 20oC,Ta = -70°C, tp= 1 0h (b) Heating (UPH - 2 ) with: Ti = -70°C, Ta = 20°C, tp= 1 2h . . . . . . . . . . . . . . . . . . . . . . .4- 1 2. Figure 4.9. Heating of unsalted butter pat (UPH - 3) with : Ti = - l SoC, Ta = 20°C, tp= 1 2h. ............................................................. .4- 1 3. Fi gure 4. 1 0 Comparison of thawi ng time for an unsalted pat with (UPH - 3) and w ithout(UPH - I ) complete prior water freezi ng . . . . . . . .4- 1 4 Figure 4. 1 1 Heat transfer i n butter block (B 1 5 ) with cardboard packaging (a) Cooling (SBC - 1 a) with : Ti = 4°C, Ta = - 1 8°C, tp= 3days (b) Heati ng (SBH - I a) with : Ti = - 1 8°C, Ta = 2°C, tp= 3days . . . . . . . . . . . . . . . . . . . .4- 1 5 Fi gure 4. 1 2. Heat transfer in butter block (B \ 5 ) without cardboard packaging (a) Cooling (SBC - I b) with: Ti = 4°C, Ta = - 1 8°C, tp= 3days (b) Heating (SBH - 2b) with : Ti = - 1 8°C, Ta = 2°C, tp= 3days . . . . . . . . . . . . . . . . . . . .4- 1 7. xvii.
(20) Fi gure 4.1 3 Comparison of w i th box and w i thout packagi ng trails for salted butter (B I 5 ) (a) Cooling (b) Heating . . . . . . . . . . . . . . . . . . . . . . . . . . . . . . . . . .. . . . . . . . . . . . . . . .4- 1 8 Figure 4.14 Position of the thermocouples i n the plan view of frozen salted block ( B 15) . . . . . . . .. . . . . . . . . . . . . . . . . . . . . . . . . . . . . . . . . . . . . . . . . . . . . . . . . . . . . . . . . . . . . . ... . . . .4-19 Figure 4.15 Thawing of frozen salted butter block (SBH - 2 a) with Ti = _l OoC , Ta = l OoC , tp= I year . . . . . . . . . . . . . . . . . . . . . . . . . . . . . . . . . . . . . . . . . . . . ... . . . . . . ... . . . . . . . . . .4-20 Figure 4.16 Comparison of two i ndependent thawing trials (SBH - 2a) and (SBH - 2b) of salted butter blocks (B15) with Ti = -10°C, Ta = 1 0°C , tp= I year . . . . . . . . . . . . . . . . . . . . . . . . . . . . . . . . . . . . . . . . . . . . . . . . . . . . . . . . . . . . . . . . . .4-21 Figure 4.17 Heati ng of a frozen unsalted butter block (UB H - I a) with :Ti = _l OoC , Ta = l OoC, tp= 6 months . . . . . . . . . . . . . . . . . . . . . . . . . . . . . . . . . . . . . . . . . . . . . . . . . . . . .4-22 Figure 4.18 Compari son of heati ng times for salted (SBH - 2a) and unsalted (UBH - I a) butter blocks . . . . . . . . . . . . . . . . ... . . . . . . . . . . . . . . . . . .... . . . .. . . . . . . . . . . . . . . . . . .4-23 Figure 4.19 Cooling of unsalted butter block (UBC - 1 a) with: Ti = l OoC , Ta =- 23°C, tp= 3 weeks . . . . . . . . . . . . . . . . . . . . . . . . . . . . . . . . . . . . . . . . . . . . . . . . . . . . . .4-24 Figure 4.20. Comparison of two cooling trial in the same u nsalted butter block (B 19) under identical cooling conditions as Ti = 10°C, Ta = -23°C , tp= 3 weeks . . . . . . . . . . . . . . . .. . . . . . . . . . . . . . . . . . . . . . . . . . . . . . . . . . . . . . . . . . . . . . .4-25. Figure 4.21 Cooling of unsalted butter block (UBC - 2) with : Ti = lOoC , Ta = - l OoC, tp= 3 weeks . . . . . . . . . . . . . . . . . . . . . . . . . . . . . . . . . . . . . . . . . . . . . . . . . . . . . .4-26 Figure 5. 1. A block of butter.. Figure 5 . 2. Comparison o f measured data for thawing of salted butter. . . . . . . . . . . . . . . . . . . . . .. . . . . . . . . . . . . . . . . . . . . . . . . . . . . . . . . . . . . . . . . . . . . . . . .. . . . . . . . . . . . . . . . . . . . . .. 5-2. pat (B 18, Trial SPH - I ) with equilibrium property model and sensible heat only model predictions . . . . . . . . . . . . . . . . . . . . . . . . . . .... . . . . . . . . . . . . . . . . . . . . . . . 5- 1 3 Figure 5.3. Compari son of measured data for thawing of unsalted butter pat (B 16, Trial UPH - I ) with equilibrium properties model and sensible heat only Model predictions . . . . . . . . . . . . . . . . . . . . . . . . . . . . . . . . . . . . . . . . . . . . . . . . . . . .. 5-15. Figure 5.4. Compari son of measured data for unsalted b utter pat (B 16, Tri al UPH -I ) with sensible heat only model using temperature dependent specific heat capacity . . . . . . . . . . . . . . . . . . . . . . . . . . . . . . . . . . . . . . . . . . . . . . 5- 1 6. Figure 5.5. Comparison of thawing data of a fully frozen b utter pat. X VIII.
(21) (B 1 6, Trial UPH - 3 ) with equilibrium properties mode1 . . . . . . . . . . . . . . . . . . . . . . . . . . . . 5 - 1 7 Fi gure 5 .6. (a) Comparison of the measured data for the salted block (B 1 5 , Trial SB H - l a) with equilibrium property model and sensible heat only predictions for surface and centre (b) Comparison of the measured data for the salted block using equilibrium properties model predictions for all the positions . . . . . . . . . . . . . . . . . . . . . 5-20. Figure 5 .7. Comparison of measured data for salted butter block without packaging (B 1 5 , Trial SB H - I b) with predictions using sensible heat only model predicti ons with temperature dependent heat capacity . . . . . . . . . . . . . . 5-2 1. Fi gure 5 . 8. Measured data for thawing of fully frozen salted butter block (B 1 5 , Trial SBH - 2a) compared with the equilibrium thermal properties model predictions . . . . . . . . . . . . . ... . . . . . . . . . . . . . . . . . . . . . . . . . . . . . . . . ... . . . . . . . . . . . . . . . . . . . . . . 5-23. Figure 5 .9. Measured data for thawing of fully frozen unsalted butter block (B 1 9, Trial UB H - I a) compared with the equilibrium thermal properties model predictions . . . . . . . . . . . . . . . . . . . . . . . . . . . . . . . . . . . . . . . . . . . . . . . . . . . . . . . . . . . 5-24. Figure 5 . 1 0 (a): Comparison of measured data for the freezing of the salted pat (B 1 8 , Trial S PC - 1 ) with Equilibrium thermal properties model predictions and the sensible heat only model predictions (b) Measured data for the salted pat(B 1 8) w ith the sensible heat only model for all the positions . . . . . . . . . . . . . . . . . . . . . . . . . . . . . .. . . . . . . . . . . . . . . . . . . . . . . . . . . . . . . . . . . . . . . . . . . .. 5-27 Figure 5 . 1 I. a) Measured data for the unsalted butter pat (B 1 6, Trial UPC - I ) compared w i th the sensible heat only model and the equilibrium property model predictions(b) Measured data compared with the sensible heat only model predictions for all the position . . . . . . . . . . . . . . . . . . . . . . . . . . . . . . 5-29. Fi gure 5 . 1 2 (a) Measured data for the salted butter block (B 1 5 , Trial SBC- I a) compared with the sensible heat only model and the equili bri um property model predictions(b) Measured data with the sensible heat only model for all the positions in the salted block . . . . . . . . . . . . . . . . . . . . . . . . . . . . . . 5-32 Figure 5 . 1 3 Measured data for the salted butter block (B 1 5 , Trial SB C. -. I b). compared with the sensible heat only model for all the positions i n the salted block. ............................ ..... ................. .................................. . . . .. 5-33. XIX.
(22) Figure 5 . 1 4 Measured data for the unsalted butter block (B 1 9) compared with the sensible heat only model and the equilibri um property model predictions (a) Freezing with an air temperature of -23°C ( UBC- I a)(b) Freezing w ith an air temperature of - l OoC (UBC-2) . . . . . . . . . . . . . . . 5-35 Figure 6. 1. DSC thermogram for Fritz and Amrnix butter. . . . . . . . ... . . . . . . . . . . . . . . . . . . . . . . . . . . . . . . . . . . . 6- 1 0. Figure 6.2. DSC thermogram for the Fritz unsalted butter w i th a constant I cooling rate of 1 . 25°C rnin- . . . . . . . . . . . . . . . . . . . . . . . . . . . . . . . . . . . . . . . . . . . . . . . . . . . . . . . . . . . . . . . . . . . . . . . . . 6- 1 2. Figure 6.3. I nJ as a function of super cooling for both Fritz butter and the AmrrUx butter. . . . . . . . . . . . . . . . . . . . . . . . . . . . . . . . . . . . . . . . . . . . . . . . . . . . . . . . . . . . . . . . . . . . . . . . . . . . . . . . . . . . . . . . . . 6- 1 3. Figure 6.4. Nucleation rate as a function of temperature for the Fritz and Amrnix butters. Figure 6.5. 6- 1 4. ............................................................................................... I nJ as a function of super cooling calculated from the experimental freezing data and the DSC measurements . . . . . . . . . . . . . . . . . . . . . . . . . . . . . . . . . . . . . . . . . . . . . . . . . . . . 6- 1 5. Figure 6.6. Nucleation rate J as a function of temperature calcu l ated from two freezi ng experiments on a butter block (B 1 9) . . . . . . . . . . . . . . . . . . . . . . . . . . . . . . . . . . . . . . . . . . . . . 6- 1 6. Figure 6.7. Specific heat capacity of butter (B 1 9) measured by DSC in heati ng and cooling modes . . . . . . . . . . . . . . . . . . . . . . . . . . . . . . . . . . . . . . . . . . . . . . . . . . . . . . . . . . . . . . . . . . . . . . . . . . . 6- 1 8. Fi gure 6.8. (a) Equilibrium enthalpy-temperature diagram for butter (B 1 9) showing specific heat capacity values used for different temperature ranges. (b) Enthalpy-temperature di agram for the calculation of equilibri um freezing temperature. . . . . . . . . . . . . . . . . . . . . . . . . . . . . . . . . . . . . . . . . . . 6-20. Fi gure 6.9. Comparison of the measured data (B 1 9 ) with the prediction using the nucleation-only model. (a) Freezing of butter block (UBC - I a) with an ambient temperature of -23°C. (b) Freezing of butter block (UBC - 2) with an ambient temperature of - I 1 °C. . . . . . . . . . . . . . . . . . . . .. . . . . . . . . 6-22. Figure 6 . 1 0 Comparison of the measured data for unsalted butter (B 1 9) with the predictions using the A vrami model. (a) Freezing with an ambient of -23°C (UBC - l a,UBC - I b)(b)Freezing with an ambient of - 1 1 °C (UBC - 2) . . . . . . . . . . . . . . . . . . . . . . . . . . . . . . . . . . . . . . . . . . . . . . . . . . . . . . . . . . . . . . . . . . . . . . . . . 6-24 Figure 6 . 1 1 Comparison of the measured data (UBC - 2 ) for unsalted butter (B 1 9) with the Avrami model using a U v alue of 0.0 1 2 rather than 0.0 1 4 . . . . . . . . . . . .. 6-25. xx.
(23) Figure 6 . 1 2 Effect of U and b values on the model predictio n using the Avrami Model with Ta= -23DC, T j= I I DC , U =0.0 1 4, b = -0.00 1 8 . . . . . . . . . . . . . . 6-26 Fi gure 6 . 1 3 Comparison of the measured data (SPC - 1 ) for the salted butter pat (B 1 8) with the prediction using various freezi ng models (a) For 1 0 Hours (b) For 70 hours . . . . . . . . . . . . . . . . . . . . . . . . . . . . . . . . . . . . . . . . . . . . . . . . . . . . . . . . . . . . . . . . 6-27 Fi gure 6 . 1 4 Comparison of the measured data(SPC-2) for the salted butter pat (B 1 8 ) )with the prediction using A vrami Model predictions for I onger period of time(b) Comparison of measured data (SPH-2 ) for the thawing of salted butter pat (B 1 8)with the equilibrium properties models and sensible heat only model predictions after cooling at -25DC for 60 hours . . . . . . . . . . . . . . . . . . . . . . . . . . . . . . . . . . . . . . . . . . . . . . . . . . . . . . . . . . . . . . . . . . . . . . . . . . . . . . . . . . . . . 6-28 Fi gure 6 . 1 5 Comparison of the measured data (UPC. -. I ) for the unsalted butter. pat (B 1 6)with the prediction using various freezing models predictions (a) For to hours. (b) For 80 h ours . . . . . . . . . . . . .. . . . . . . . .. . . . . . . . . . . . . . . . . . . . . . . . . . . . . . . . . . . . . . . . 6-29. Fi gure 6. 1 6 Comparison of the measured data (SBC - I a) for the salted butter block(B 1 5 ) with the prediction using v arious freezing models (a) For 70 hours. (b) For 200 hours . . . . . . . . . . . . . . . . . . . . . . . . . . . . . . . . . . . . . . . . . . . . . . . . . . . . . . . . . 6-3 1. Fi gure 6. 1 7 Comparison of the measured data for the salted block freeze to -23DC with all the freezing models . . . . . . . . . . . . . . . . . . . . . . . . . . . . . . . . . . . . . . . . . . . . . . . . . . . . . . . . . . . . . . . . . . . . . . . . . 6-32 Figure 7. 1. Plan and elevation view of the full butter pallet configuratio n (approximate outer dimensions i n mm) . . . . . . . . . . . . . . . . . . . . . . . . . . . . . . . . . . . . . . . . . . . . . . . . . . . . . . . . . . 7-2. Fi gure 7.2. Wrapped full p allet used for Trial I (PC - \ , PH - 1 ) . . . . . . . . . . . . . . . . . . . . . . . . . . . . . . . . . . . . . 7-5. Fi gure 7.3. Unwrapped full pallet used for Trial 2 (PC - 2, PH - 2) . . . . . . . . . . . . . . . . . . . . . . . . . . . . . . . . 7-5. Figure 7.4. Plan views « a) and (b)) and front elevation (c) of half pallet trails (Trials 3-5) . . . . . . . . . . . . . . . . ... . . . . . . . . . . . . . . . . . . . . . . . . . . . . . . . . . . . . . . . . . . . . . . . . . . . . . . . . . . . . . . . . . . . . . . . . . 7-8. Figure 7.5. Position and code numbers of thermocouples in the mjddle layer of the three layered h alf pallet trials . . . . . . . . . . . . . . . . . . . . . . . . . . . . . . . . . . . . . . . . . . . . . . . . . . . . . . . . . . . . . . . . . . . . . . . . . . 7-9. Figure 7 .6. Position of the thermocouples in cartons \ , 2 , 7 and 8 i n half pallet Trials 3-5. Figure 7.7. . . . . . . . . . . . . .. . . . . . . . . . . . . . . . . . . . . . . . . . . . . . . . . . . . . . . . . . . . . . . . . . . . . . . . . . . . . . . . . . . . . . . . . . . . . . . .. 7- \ 0. Direction of air flows in the experimental room (a): Plan view ( freezing) (b): Plan view (thawing). XXI.
(24) (c): Elevation (freezing) (d): Elevation (thawing) Figure 7 . 8. . 7- 1 O. . . . . ..... . . . . . . . .. .. . . . . . . . . . . . . . . . . .. .. Experimental temperature profiles measured for trial P C. -. I. (a) pallet faces (b) across the pallet diagonal from bottom LHS front corner to top RHS back corner - positions in mm indicated are relative to bottom LHS of pallet as in Fi gure 7 . 1 (c) across layer 4 . . . . . . . . . . . . . . . . . . . . . . . . 7 - 1 2 Figure 7 .9. Experimental temperature profiles measured for trial PC. -. 1 at centre. of the blocks (one on each layer) from top to bottom of the pallet. . .. . . . . . . . . . . . .. 7- 1 4. Figure 7 . 1 0 Experimental temperature profiles measured for trial P H - I (a). pallet faces (b). across the pallet diagonal from bottom LHS front corner to top RHS back corner - positions in mm indicated are relative to bottom LHS of pallet as in Figure 7. 1 (c). across layer 4 . . . . . . . . . . . . . . . . . . . . . . . . . . 6- 1 5 Figure 7 . 1 1. Experimental temperature profiles measured for tri al PH - I at the centres of the blocks (one on each layer) from top to bottom of the pallet.. .. . . . . .. .. . . . . . .. 6- 1 7. Figure 7 . 1 2 Experimental temperature profiles measured for trial PC - 2 (a). pallet faces (b). across the pallet diagonal from bottom LHS front corner to top RHS back corner - positions in mm i ndicated are relative to bottom LHS of pallet as in Figure 7 . 1 (c). across layer 4 . . . . . . . . . . . . . . . . . . . . . . . . . . 7 - 1 8 Figure 7 . 1 3 Experimental temperature profiles measured for tri al PC - 2 at centers of the blocks ( one on each layer ) from top to bottom of the pallet... . . . . . . . . . . . .. Figure 7 . 1 4 Compari son of the slowest cooling position ( 1 6) in the wrapped (PC and unwrapped (PC. -. 2 ) full pallet trials. .. . . . . .. . . . . . . . . . . . . . . . . .. ... Figure 7 . 1 5 Experimental temperature profile measured for trial PC. -. I). . . . . . . . . . . . . . . . . . . . . . . . . . . . .. -. 7-20. . 7-2 1. 2 (a)Centre. of all the faces of the Block 3 1 (b). posi tions inside the Block 3 1 . . . . . . . . . . . . . . . 3-22 Figure 7 . 1 6 Experimental temperature profiles measured for trial PH - 2 at the centre of all the faces of the Block 38 . . . . . . . . . . . . . . . . . . . . . . . . . . . . . . . . . . . . . . . . . . . . . . . . . . . . . . . . . . . . . ... . . . . . 7-23 Fi gure 7 . 1 7 Experimental temperature profiles measured for trial PH i nside the Block 38. -. 2 at positions. . . . . . . . . . . . . . . . ................. . . . . . . . . . . . . . . . . . . . . . . . . . . . . . . . . . . . ... . . . . . . . . . . . . ...... 7-24. Figure 7 . 1 8 Comparison of thawing of wrapped (PH - I ) and unwrapped (PH - 2 ) i n the full pallet trials . . . .. . . . . . . . . . . . . . . . . . . . .... . . . . . .... ................ .. . . . . . . . .. . . . . . . . . . . . . . . . . . . . ..... Fi gure 7 . 1 9 Experimental temperature profiles measured for trial PC. -. 7-24. 3. (a). Temperature profile at the centre of the faces exposed to ambient. xxii.
(25) (b). Temperature profile at the centre of each block. .. . . . . . . . . . . . . . . . . . . . . . . . . . . . .. . 7-25. . . . . . . .. Figure 7 .20 Temperature read ings (between the blocks and corresponding b utter surfaces) after 50 h ours in Trial PC - 3 Figure 7 .2 1. . . . . . . . . . .. .. . . .. ...... ... . . . .. ....... . . .. . .... . . . .. .. .. .. . . . . .. . . . 7-27 .. Experimental temperature profiles measured for the wrapped loosely stacked half pallet trial (PC - 3)(a) Comparison of block 1 & 8 (b) Comparison of block 2 & 7 . . . . . . . . . . . . . . . . . . .. . . . . . . . . . . . . . . . . . . . . . . . . . . . . . . . . . . . . . . . . . . . . . . . . . 7-28. Figure 7.22 Experimental temperature profiles measured for the wrapped loosely stacked half pallet trial (PC - 3) (a): Temperature profiles of the slowest freezing position along with the other positions around the centre of the half pallet.(b): Schematic diagram of the centre of the pallet. . .. . . . . . . . . . .. 7-29. Figure 7.23 Experimental temperature profiles measured for trial PH - 3 (a). Temperature profile at the centre of the faces exposed to ambient (b). Temperature profile at the centre of each block. . . . . . . . . . . . . . . . . . . . . . . . . . . . . . . . . . . . .. 7-30. Figure 7 .24 Temperature readings (between the blocks and corresponding b utter surfaces) after 50 hours in Trial PH - 3. . . . .. .. . . . . . . . . . . .. .. . . . . . . . . . . . . . . . . . . . . . . . . . . . . . . . . . . .. .. . . .. 7-3 1. Figure 7 .25 Experi mental temperature profiles measured for the wrapped loosely stacked half pallet trial (PH - 3 )(a) Comparison of block I &8 (b) Compari son of block 2 & 7 . . . . . . . . . . . . . . . . . . . . . . . . . . . . . . . . . . . . . . . . . . . . . . . . . . . . . . . . . . . . . . . . . . . . 7-32 Figure 7 .26 Experimental temperature profile measured for the slowest thawi ng position along with other positions around the centre of the half pallet (PH - 3 ). . . . . . . . . . . . . . . . . . . . . . . . . . . . . . . . . . . . . . . . . . . . . . . . . . . . . . . . . . . . . . . . . . . . . . . . . . . . . . . . . . . . . . . .. 7-33. Figure 7.27 Experimental temperature profiles measured for Trial PC - 4 (a). Temperature profile at the centre of each block along with the average ambient temperature on four sides of the half pallet (b). Temperature profile for the centres of all the blocks . . ... . . .. .. .. .. . . .. ..... .... .. . . . . .. . 7-34. Figure 7.28 Temperature readings (between the blocks and corresponding butter surfaces) after 50 hours for Trial PC - 4. . . . . . . .. ....... . .... .. .. . . . .. . . .. . . .. . . . .. .. . . . . . . . .. 7-35. Figure 7 .29 Experimental temperature profiles measured for the unwrapped half pallet trial (PC - 4) (a) Compari son of block 1 and 8 (b) Comparison of block 2 and 7 . . . . . . . . . . . . . . . . . . . . . . . . . . . . . . . . . . . . . . . . . . . . . . . . . . . . . . . . . . . . . . . . . 7-36 Figure 7 .30 Experimental temperature profiles measured for the slowest freezing. XXIII.
(26) position along with other positions around the centre of the half pallet (PC Fi gure 7.3 1. -. 4r . . . . . . . . . . . . . . . . . . . . . . . . . . . . . . . . . . . . . . . . . . . . . . . . . . . . . . . . . . . . . . . . . . . . . . . . . . . . . . . . . . . . . . . . . . . . . . 7-37. Experimental temperature p rofiles measured for Trial PH - 4 (a) : Centre of all the faces exposed to ambient (the position 1 2 on block 1 i s missing)(b ) : Centres of all the blocks in the ntiddle layer... 7 -38. . . . . . . . . . . . . . . . . . . . . . .. Figure 7 .32 Temperature readings (between the blocks and corresponding butter surfaces) after 50 hours for Trial PH. -. 4 . . . . . . . . . . . . . . . . . . . . . . . . . . . . . . . . . . . . . . . . . . . . . . . . . . . . . 7-39. Fi gure 7.33 Experimental temperature profiles measured for Trial PH - 4 (a) Comparison of Blocks I & 8 (b) Comparison of Blocks 2 & 7 . . . . . . . . . . . . . . 7 -40 Fi gure 7.34 Experimental temperature profiles measured for the slowest thawing position along with the other posi tion around the centre of the half pallet Trial PH - 4 . . . . . . . . . . . . . . . . . . . . . . . . . . . . . . . . . . . . . . . . . . . . . . . . . . . . . . . . . . . . . . . . . . . . . . . . . . . . . . . . . . . . . . . . . 7-4 1 Fi gure 7.35 Experimental temperature profiles measured for the half pallet loosely stacked trial PC - 5 at the centre of all the blocks along with the ambient temperature on four sides of the half. . . .. .. 7-42. . . . . . . . . . . . . . . . . . . . . . . . . . . . . . . . . . . . . . . . . .. Fi gure 7.36 Experimental temperature profile measured for the positions at the surfaces of the blocks (PC - 5 a) (a) Block I (b ) Block 2 (c) Block 8 (d) Block 7. . . . . . . . . . . . . . . . . . . . . . . ..... . . . . . . . . . . . . . . . . . . . . . .. . . . . . . . . . . . . . . . . . .. . . . . . . . . . . . . . . . . . . . . . . . . . . . . . . .. 7-43. Fi gure 7.37 Temperature readings (between the blocks and corresponding b utter surfaces ) after50 hour for Trial PC - 5a. . . . . . . .. . . .. . . . . . . . . . . . . . . . . . . . . . . . . . . . . . . . . .. 7-44. Fi gure 7 .38 Experimental temperature profile measured for trial PC - 5 a at the positions i nside the blocks along with the average ambient temperature. (a) Block I (b) Block 2 (c) Block 8 (d) Block 7 . . . . . . . . . . . . . . . . . . . . . . . . . . . . . . . . . . . . . . . . . . . 7-44 Figure 7.39 Experimental temperature profiles measured at the centre of each block along with the ambient temperature on four sides of the half pallet (PH - 5). . . . . . . . . . . . . . . . . . . . . . . . . . . . . . . . . . . . . . . .. . . . . . . . . . . . . . . . . . . . . . . . . . . . . . . . . . . . . . . . . . . . . . . . .. Figure 7 .40 Experimental temperature profiles measured for trial PH. _. 5 at the surfaces. of the blocks(a) Block ( b ) Block 2 (c) Block 8 (d) Block 7 Fi gure 7.4 1. 7-46. . . . . . . . . . . . . . . . . . . . . . .. 7-46. Temperature readi ngs (between the blocks and corresponding b utter surfaces) after 5 0 hours for Trial PH - 5. . . . . . . . . . . . . . . . . . . . . . . . . . . . . . . . . . . . . . . . . . . . . . . . . . . . . . .. 7-47. Fi gure 7.42 Experimental temperature profiles measured for trial PC - 5 i nside the. XXIV.
(27) blocks along with the average ambient temperature.(a) B lock I b) B lock 2 (c) B lock 8 (d) B lock 7 . . . .. . . . . . . . . . . . . . . . . . . . . . . . . . . . . . . . . . . . . . . . . . . . . . . . . . . . . . . . . . . 7-48 Figure 7 .43 Comparison of the slowest freezing point for both the freezing runs of Trial S ( PC - Sa and PC - Sb) . . . . . . . . . . . . . . . . . . . . . . . . . . . . . . . . . . . . . . . . . . . . . . . . . . . . . . . . . . . . . . . . . . 7-S0 Figure 7 .44 Comparison of slowest changi ng positions in the half pallet Trials 3-S (a) Freezi ng (b) Thawing . . . . . . . . . . . . . . . . . . . . . . . . . . . . . . . . . . . . . . . . . . . . . . . . . . . . . . . . . . . . . . . . . . . . . . . . . . . . . . 7-S I Figure 8. 1. Compari son of measured enthalpy with the effecti ve enthalpy for the unwrapped half pallet. . . . . . . . . . . . . . . . . . . . . . . . . . . . . . . . . . . . . . . . . . . . . . . . . . . .. . . . . . . . . . . . . . . . . . . . . . . . . . . . 8-7. Figure 8 . 2. Measured thawing data for the centre of the wrapped full pallet trial (PH - 1 ) compared with model predictions using conduction only model with effecti ve thermal properties calculated by Maxwell Eucken, Parallel and Series models Ti =-6°C, Ta= 1 0°c. . . . . . . . . . . . . . . . . . . . . . . . . . . . . . . . . . . . . . . . . . . . . . . . 8-9. Figure 8.3. Measured freezing data for the centre of t h e wrapped ful l pallet trial (PC - I ) compared with model predictions using conduction only model with effective thermal properties cal culated by the Parallel model . Ti = 1 0°C, Ta=- I I 0c . . . . . . . . . . . . . . . . . . . . . . . . . . . . . . . . . . . . . . . . . . . . . . . . . . . . . . . . . . . . . . 8- 1 0. Figure 8 .4. Measured data for the centre of the wrapped half pallet trial (PH - 3) duri ng thawi ng compared with the conducti on o nl y model with effecti ve thermal properties calculated by the Parallel model (Trial 3) with Ti =-23°C, Ta=20°C . . . . . . . . . . . . . . . . . . . . . . . . . . . . . . . . . . . . . . . . . . . . . . . . . . . . . . . . . . . . . . . . . . . . . . . . . . . . . . . 8- 1 1. Figure 8.S. Predictions for the wrapped half pallet trial (PH - 3) us ing enthalpy for the fully and partially frozen butter compared with the measured data . . . . . . . 8- 1 2. Figure 8.6. Compari son of measured data for the freezi ng o f wrapped loosely stacked half pallet trial (PC - 3) considering heat transfer as conduction only with effective thermal properties based on the parallel model. Ti =22°C, Ta=-23°C. Fi gure 8.7. . . . . . . . . . . . . . . . . . . . . . . . . . . . . . . . . . . . . . . . . . . . . . . . . . . . . . . . . . . . . . . . . . . . . . . . . . . . . . . . . . . . . . . .. 8- 1 3. Comparison of model predictions with the measured data for the unwrapped h alf pallet trial (PH - 4) considering heat transfer as conduction only with effective thermal properties based on the parallel model.(a)Thawing with Ti =- 1 6°C, Ta=23°C (b) Freezing w ith Ti =2 1 °C, Ta=-22°C. . . . . . . . . . . . . . . . . . . . . . . . . . . . . . . . . . . . . . . . . . . . . . . . . . . . . . . . . . 8- 1 4. xxv.
(28) Figure 8.8. Effective heat transfer coeffi cient for freezing of B lock 2 and 7 i n unwrapped h alf pall et trial (PC - 5 ). Fi gure 8.9. . . . . . . . . . . . . . . .. . . . . . . . . . . . . . . . . . . . . . . . . . .. . . . . . . . . . . . . . . . . . .. 8- 1 7. Effective heat transfer coeffi cient for freezing of B l ock 7 and 8 in unwrapped half pal let trial (PH - 5) . . . . . . . . . . . . . . . . . . . . . . . . . . . . . . . . . . . . . . . . . . . . . . . . . . . . . . . . . . . . . 8- 1 9. Fi gure 8. 1 0 Measured data compared with the model prediction for freezing of unwrapped loosely stacked h alf trial with gaps (PF - 3) with T j= 1 1 °C , Ta=-25°C(a) Block l (b) Block 2 . . . . . . . . . . . . . . . . . . . . . . . . . . . . . . . . . . . . . . . 8-2 1 Figure 8. 1 1. Measured data compared with the model prediction for thawi ng of unwrapped loosely stacked h alf pallet trial with gaps (PH - 5) with T j= -25°C, Ta=20°C(a) B lock8 (b) Block 7 . . . . . . . . . . . . . . . . . . . . . . . . . . . . . . . . . . . . . . . 8-22. Figure 8. 1 2 Comparison of the model predictions with measured data for the unwrapped fu ll pal let trial « PH. -. 2 ) & (PC - 2» (a) and. (b) Freezing in B lock 30 with T j= l OoC, Ta=- l l oC (c) Thawing in B lock 3 1 with T j= - 1 1 °C, Ta= 1 1 °C . . . . . . . . . . . . . . . . . . . . . . . . . . . . . . . . . . . . . 8-25 Figure 8. 1 3 Effecti ve heat transfer coeffi cient for freezing of B lock 7 in unwrapped closely stacked half pallet trial (PC - 4) for Block 7 . . . . . . . . . . . . . . . . . 8-27 Figure 8. 1 4 Measured freezi ng data compared with the model prediction for unwrapped closel y stacked half pallet tri al (PC - 4) with Tj = 2 1 °C, Ta= -2 1 °C . . . . . . . . . . . . . 8-28 Fi gure 8. 1 5 Measured data for thawing of B lock 7 in thawing of unwrapped half pallet trial with no gaps (Trial PH-4) with T j= - 1 8°C, Ta=22°C . . . . . . . . . . . . . . . . . . 8-29. xxvi.
(29) LIST OF APPENDICES. Appendix A I : Nomenclature . . . . . . . . . . . . . . . . . . . . . . . . . . . . . . . . . . . . . . . . . . . . . . . . . . . . . . . . . . . . . . . . . . . . . . . . A- I Appendix A 2: Standard Methods Used to Measure the Composition of Butter. . . . . . . . . . . . . . . . . . . . . . . . . . . . . . . . . . . . . . . . . . . . . . . . . . . . . . . . . . . A-4 Appendix A3 : Numerical Formulation of ModeL . . . . . . . . . . . . . . . . . . . . . . . . . . . . . . . . . . . . . . . . A-6 Appendix A4: Matlab Code for the Freezing Models for 25 kg Block of B utter. . . . . . . . . . . . . . . . . . . . . . . . . . . . . . . . . . . . . . . . . . . . . . . . . . . . . . . . . . . . . . . . . . . . . . . A-8 Appendix AS : Plans of Thermocouples Positions and Data for Pallet Trials. . . . . . . . . . . . . . . . . . . . . . . . . . . . . . . . . . . . . . . . . . . . . . . . . . . . . . . . . . . . . . . . . . . . . . . . . . . . .. A-9. XXV l l.
(30) CHAPTER ! PROJECT OVERVIEW. 1.1. Background and Problem Definition. Fonterra Co-operative Group Ltd is a leading multi national dairy company, owned by 1 1 ,600 New Zealand dairy farmers. It i the world's largest exporter of dai ry products, exporti ng 95 percent of its production. A large percentage of its exports consist of milkfat products including butter.. Some initiatives in the NZ Dairy Industry have considered quality (e.g. flavour) or functionality (e.g. hardness) changes during the heating or cooling of bulk butter or milk fat products. The impact of these temperatures changes are of vital i mportance to day to day operations with regard to butter manufacture and shipping. Bulk butter is generally stored and transported at chilled or frozen temperatures. Frozen storage helps to maximise butter keeping quality due to minimisation of oxidation and microbial spoi lage reactions and also increases product rigidity and so avoids pal let instability. In some cases, in order to meet customer requirements, the product is then later raised from frozen to chil led temperatures prior to delivery. Due to manufacturing and handling considerations, a large amount of the heating and cooling of the butter is frequently done on whole pallets of product.. Pallets of butter generall y consist of blocks of product (25 kg) wrapped in a polymer liner and placed in corrugated cardboard cartons. M any of these cartons (48 or 56) are then stacked on a pallet. As a result the bul k system contains product, packaging material and air entrapped between the packagi ng and the butter and between adjacent cartons.. To optimize the temperature conditioning of butter it is i mportant to understand the rate of heat transfer and the temperature distribution throughout the product. This information can then be linked to the functionality of the product and the rates of potential quality rel ated changes that may occur. Specific examples i nclude; •. Dry shipment is the practice which i nvolves shipping the frozen butter in un-refrigerated, insulated containers to export destinations in order to reduce energy and shipping costs. The. I-I.
(31) warming of palletised, block-stacked butter must be understood to determi ne the technical feasibility of this practice. The potential quality related problems linked to this (keepi ng quality and slumping (col lapse of pallet due to reduced stability» need to be balanced against reduced costs of shipment. •. Carton less butter production depends on assuming sufficient solidification of the milkfat in each block to provide pal let stability. This could be optimised by modeling the heat transfer in i ndividual blocks of butter. This would allow the extent of case hardening (solidification of fat) required in cartonless bulk b l ock butter manufacture to be assessed so that the b l ock can maintain its shape during later pal let based, more complete freezing.. •. A modeling tool giving temperature as function of time and position would be usefu l for. giving information regarding thawing/tempering requirements (time, temperature, space al location) for new customers or customers changing product size/format or al low existing customers and Fonterra to optimise their operations. •. Knowledge of freezing times of the product can help In the optimisation of cool-store management and refrigeration heat l oads.. •. If the thermal history of the product with respect to its position in the stack is known then the product variability due to temperature related quality deterioration can be minimized.. •. A good knowledge of freezing and thawing times of the product can also help in optimising. the packagi ng geometry and strength.. Each of these situations is based upon the same underlying principle: three-dimensional heat transfer with phase change (melting or crystallization of both water and milkfat). The functionality of the product is dependent on the temperature distribution throughout the product and the thermal history it has experienced because the rates of quality changes are dependent on the local temperature within the product.. 1.2 Project Objectives The overall objecti ve was to provide a methodology to the dairy industry to allow prediction of butter thawing and freezing to be made in different situations. In order to achieve this goal it was necessary to; •. Provide thermophysical property data for a range of butter types over the temperature range used in commercial practice.. 1 -2.
Figure
+7
Outline
Numerical Solutions for Heat Transfer
Estimation on Initial Freezing Point of Salted Butter
Measurement Techniques
Generally if the space sub-division tends towards infinity and time step tends towards zero the model will closely model a continuous system but this requires considerable simulation time.
Related documents
To what extent these findings can be applied to those declin- ing participation in PA programmes outside a trial setting is not certain; while it seems logical that some of the
The use of sodium polyacrylate in concrete as a super absorbent polymer has promising potential to increase numerous concrete properties, including concrete
The paper assessed the challenges facing the successful operations of Public Procurement Act 2007 and the result showed that the size and complexity of public procurement,
Finally, HRM issues, even when strategic, are considered by top management to strategy implementation phase and not strategy formulation phase (Russ et al. , 1998) study
19% serve a county. Fourteen per cent of the centers provide service for adjoining states in addition to the states in which they are located; usually these adjoining states have
Ultrasound imaging of hyperplastic mouse prostate The volume of the ventral prostate was monitored during development in a mouse model of benign pros- tatic hyperplasia using
Of these, 52 patients with negative resection margins were put in observation after surgery (R0+S group), while the other 32 patients with microsco- pically positive resection
Purpose: To assess the 3-year safety and ef fi cacy of femtosecond laser-assisted intrastromal corneal ring segments' (ICRS) implantation followed or accompanied by
