Seed Mapping of Sugar Beet
H. W. GRIEPENTROG M. NØRREMARK H. NIELSEN AND B. S. BLACKMORE
hwg@kvl.dk
Department of Agricultural Sciences, The Royal Veterinary and Agricultural University, Frederiksberg, 1870 DK, Denmark
Abstract. Individual plant care may well become embodied in precision farming in the future and will lead to new opportunities in agricultural crop management. The objective of this project was to develop and evaluate a data logging system attached to a precision seeder to enable high accuracy seed position mapping of a field of sugar beet. A Real Time Kinematic Global Positioning System (RTK GPS), optical seed detectors and a data logging system were retrofitted on to a precision seeder to map the seeds as they were planted. The average error between the seed map and the actual plant map was about 16–43 mm depending on vehicle speed and seed spacing. The results showed that the overall accuracy of the estimated plant positions was acceptable for the guidance of vehicles and implements as well as potential individual plant treatments.
Keywords: seed mapping, crop management, individual plant care, weeding, seeding, RTK GPS
Introduction
Agriculture has benefited in the past from the success of technological develop-ments that have brought greater productivity and economic efficiency. Historically, the emphasis of these developments has been the mechanization of field operations to increase work rates achievable by individual operators. Today, however, the trend of increased efficiency through the use of larger and more powerful machines becomes more critical due to higher risks of soil damage and high chemical and fuel inputs. Large scale machinery also seems to have the drawback of not matching the general requirements of precision farming. The trend of increased machinery size and weight may be replaced by newer information based technol-ogies that may ultimately enable reliable autonomous field operations. This scale-reduction process, embodied in precision farming, may lead to the possibility of individual plant care cropping systems (Blackmore and Griepentrog, 2002; Griepentrog et al., 2003).
These cropping systems require accurate and reliable information about the position of crop plants and, if possible, additional information about the crop growth status. A highly accurate seed map would already allow several automatically controlled field operations such as
– guidance of vehicles (e.g. parallel to crop rows),
– guidance of implements or tools (e.g. inter-row and intra-row weeding),
– application of fluids or granules to individual crop plants (e.g. insecticides, fun-gicides, fertilizers etc.) and
– measuring health and growth status of individual plants (e.g. multi-spectra and shape).
Three target areas have been identified within a field of row crops where different application techniques for chemical or physical treatments are necessary. They re-quire presumably different cultivation principles as there are (i) the area between the rows (inter-row area), (ii) the area between the crop seedlings within the rows (intra-row area), and (iii) the area close to and around the crop seedlings (close-to-crop area). Inter-row treatments such as hoeing, harrowing or brushing are mature methods and have reached a high level of automation even with automated guidance systems within recent years (Van Zuydam et al., 1995; Tillet et al., 2002). The challenging tasks are still to spatially control either chemical or physical treatments within the intra-row and close-to-crop areas.
The objective of this study was to develop and evaluate a data logging system attached to a precision seeder to enable high accuracy seed position mapping of a field of sugar beet. The mean deviations between the position of the emerged crop plants and the estimated position of the seeds may be determined by altering vehicle speed and seed spacing. Furthermore, the influence of field conditions such as soil type and seedbed quality on the deviations between seed and plant positions should be investigated.
The hypothesis is that by knowing where the seeds have been placed, crop plants can be individually located at a later date. Furthermore, the overall aim of the project was to create an information based on which robotic physical or chemical treatments of individual plants could be built.
Materials and methods
A commercial six row precision seeder for sugar beet was retrofitted with a computer based data logger. A Real Time Kinematic Global Positioning System (RTK GPS) was integrated to provide highly accurate positional information. Six infra red optical switches (one per seeder unit) were mounted directly above the coulters and detected the seeds as they dropped into the furrows. These sensors were already designed and constructed for the seeder to check the operational machine perfor-mance as common in other agricultural implements. Tests in the lab to check the reliability of seed detection and cell filling showed satisfying results for all seeding speeds used in the subsequent field experiments.
No major modifications of the commercially available machine itself were made. The main characteristics and machine settings are shown in Table 1.
Although a high accuracy positioning system was used, results from field opera-tions were initially poor due to small dynamic inclinaopera-tions during the sowing operation. In order to correct this effect, an inclinometer was attached to the GPS antenna pole for measuring pitch and roll. All logged data from GPS, inclinometer and the optical sensors were recorded and time labeled by the data logger at a resolution of 400 Hz. The GPS data in UTM coordinates were sampled at 20 Hz. In order to compute the position of each seed, a time interpolation was carried out based on time tagged seed detections and the 50 ms data intervals from the GPS. In the post processing of the data, a kinematic model provided the heading infor-mation, eliminated the inclination errors and calculated the seed drop positions. Figure 1 is a schematic of the data logging system attached to the seeder. Not shown is the GPS reference station for the RTK GPS located on the AgroTechnology section building which provided the correction data.
The data acquisition system and its verification including the post processing method is described in more detail in Nørremarket al.,(2003). A project with similar objectives with a corn planter was conducted some years ago in the US (Ehsani
et al., 2000).
Field tests were conducted to check the performance of the seeder and to verify the data logging and processing system. The first experiment investigated the effect of seedbed quality and soil type on the deviation between seed position and position where the plants emerged at the field surface. In the second experiment, the seed spacing and vehicle speed were altered to check the influence of these parameters on the seeder’s performance. For both experiments the same precision seeder as described in Table 1 was used.
[image:3.595.119.478.588.696.2]To investigate the influence of seedbed crumb size distributions on deviations between seed positions and plant positions, two fields of the university research farm (field 26 and field 11–1) with different soil type (sandy loam and loamy sand) were selected. On each of the fields, a fine and a coarse seedbed were prepared. The sugar beet seeding was carried out in late spring (3rd May 2001). At field emergence (17th May), a 1.1 ·1.1 m quadrat was placed at randomly chosen spots on each of the four variants. Three digital photos of the frame with crop plants were taken for each
Table 1. Main characteristics and settings of the precision seeder for sugar beet (Kverneland Accord, Germany)
Operation principle Fully mechanical ground wheel driven precision seeder, vertical disc with 4 seed cells with lateral inside feeding, disc diameter 157 mm
Row width 0.50 m
Target seed spacing 125 and 202 mm
Seeding depth 30 mm
Forward speed 2 and 5 km h)1
variant. The known absolute size of the quadrat was used to scale the images for the subsequent digitizing process. The frame was kept on the field while the seeds were carefully uncovered. A photo was also taken from the seeds and the frame. Plants and seeds on the digital photos were digitized on a computer and their distances were determined and statistically analyzed.
The deviations between estimated seed positions and measured plant positions at a field scale, were determined in a different field experiment. The field was ploughed and the seedbed was prepared for sugar beet adapted to the regional field conditions. Two seeding experiments were carried out. The first seeding was in late autumn 2002 (1st November) and the second in spring 2003 (16th April). Pictures were taken at field emergence (20th December 2002 and 19th May 2003). Due to low ambient temperatures in late autumn 2002, the growing conditions for sugar beet were sub-optimal. To increase the germination rate and to improve the growth conditions, the field was partly covered by thin transparent plastic film.
[image:4.595.134.456.140.400.2]treatment were calculated. The experimental data were statistically analyzed by using SAS (GLM procedure for comparison of means).
Results and discussion
The magnitude of the deviations between calculated seed positions and crop plant positions were influenced by several parameters. These error sources included
– accuracy of the positioning system (RTK GPS),
– movement (play) of sowing devices relative to the positioning reference point, – displacements of seeds in the furrows after passing the optical sensors and – deviation of plant positions from seed positions affected by soil conditions
(soil type, seedbed quality, seeding depth).
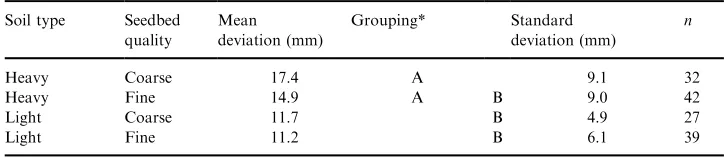
The soil conditions of a field have an influence on where plants emerge related to their seed position. Table 2 shows the results for quantifying these deviations caused by varying soil type and seedbed conditions. The range of mean deviations was 11.2–17.4 mm. This showed that field conditions have a significant effect on the esti-mation of plant positions from seed positions. These fully random errors will always occur because they appear due to normal and unavoidable soil structure conditions. The results show that the seedbed quality has an effect on the deviations at least on heavy soil types.
[image:5.595.115.479.608.687.2]Figure 2 gives a graphical impression of typical results from seed and crop plant mapping. The calculated seed positions of all six rows of the seeder are displayed with character 1, 5 and 6 for the row numbers. For rows 2, 3 and 4, the seed position is indicated by a dot. The digitized plant positions of 15 plants as small circles of one sample frame and the GPS data track are overlaid. Within the rows, there is occa-sionally a gap because the seeder did not drop a seed at every location. This was due to an insufficient singulation process within each seeder unit which gave a cell filling of less than 100%. Furthermore, due to field emergence, there was sometimes no plant where a seed was placed by the machine. Plants without detected seeds were never observed. Seed germination of less than 100% and too weak seedlings and other unfavorable conditions for the seedlings to reach the field surface result in low field emergence rates. For several reasons, as described already, the plant positions were of course not identical with the seed positions indicated by dots being eccentrically within the circles. By measuring the plant positions from selected plots and comparing them with the calculated seed positions from the data logging system, it was possible
Table 2. Mean deviation between seed and plant positions for different soil types and seedbed qualities
Soil type Seedbed quality
Mean deviation (mm)
Grouping* Standard
deviation (mm)
n
Heavy Coarse 17.4 A 9.1 32
Heavy Fine 14.9 A B 9.0 42
Light Coarse 11.7 B 4.9 27
Light Fine 11.2 B 6.1 39
to determine the overall deviation errors. Table 3 gives an overview about the trial variants and main results. The field emergence was as expected very low in late autumn 2002 but had no effect on the deviations. Only the sample sizes were lower when field emergence decreased. Large and consistent differences in field emergence were between 125 and 202 mm seed spacing. At 202 mm seed spacing the displace-ment of seeds is at a minimum due to the zero-ground-speed effect. This ensures even seeding depth and hence higher field emergence rates (Heege and Billot, 1999).
Figure 3 shows the mean and standard deviations as the main results from the trials 2002 and 2003. The range of the overall mean deviation was 16–43 mm. Higher vehicle speeds always resulted in higher deviations compared with the values from the small seed spacing. Furthermore, as expected, the smaller seed spacing always gave higher deviations compared with the larger (202 mm) seed spacing. This can be explained by the zero-ground-speed effect when using the 202 mm spacing. Results from a similar research project (Ehsaniet al., 2000) with a corn planter resulted in higher deviations or errors. In that project, the average error lay between 43 and 53 mm. The planter used for those trials had no zero-ground-speed effect and had therefore not the same advantageous performance for reducing seed longitudinal displacements.
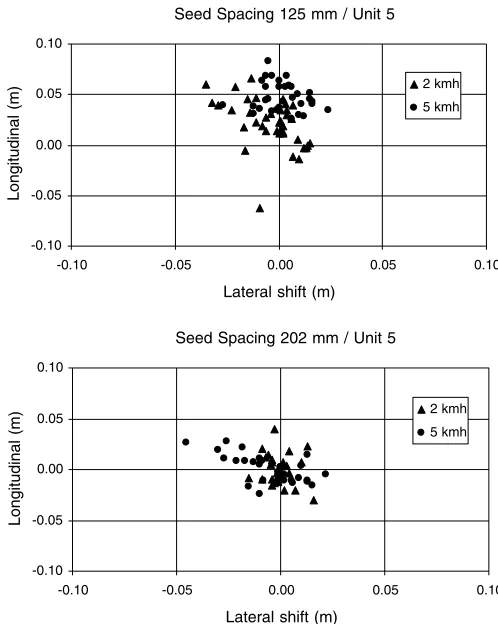
[image:6.595.187.410.152.396.2]deviation is only in the direction of driving within the furrow. Therefore, the data analyzed consisted of longitudinal biased data instead of normal randomly distrib-uted data. In Figure 4, the absolute shift of plant position in lateral and longitudinal directions is shown for one seeder unit. Due to higher disc speeds at 125-mm spacing a bias is significantly visible because, in this case, the horizontal ground speed of seeds is not equal to zero. The data from the 202-mm spacing gave more unbiased and normal distributed results. This effect is independent of the vehicle speed.
Conclusions
[image:7.595.119.477.175.314.2]A RTK GPS and a computer based data logger were retrofitted to a precision seeder to map seeds as they were planted. The average error between the seed map Table 3. Main results of all variants from field experiments autumn 2002 and spring 2003 with variation of seed spacing and operation speed
Year Seed
spacing (mm)
Velocity (km h)1)
Mean deviation (mm)
Grouping* Standard deviation (mm)
n Field
emer-gence (%)
Autumn 2002 125 5.3 42.9 A 23.4 79 37.4
202 5.5 27.2 B 15.8 73 56.0
125 2.0 20.9 B C 11.9 53 25.1
202 2.1 16.6 C 7.8 69 52.9
Spring 2003 125 5.3 37.8 A 13.4 219 83.0
125 2.0 20.8 B 14.1 229 86.7
202 5.5 17.7 B C 9.9 125 95.9
202 2.1 16.1 C 9.8 80 98.2
*Least significant difference (5% error) 7.3 mm for 2002 and 4.0 mm for 2003.
[image:7.595.183.412.349.508.2]produced by the seeder and the actual plant map was 16 to 43 mm. The results showed that the overall accuracy of the estimated plant positions is acceptable for the guidance of vehicles and implements. The control of inter-row and intra-row hoes could be based on seed map data.
Furthermore, for subsequent individual plant care, the deviations were small enough to enable individual plant targeting. For the close-to-crop area probably more information about the actual availability of weeds or even crop plants is needed for treatment of individual crop or weed plants.
Acknowledgments
We acknowledge Kverneland company who supported us with their equipment and expertise. Thanks to the SOCRATES students A. Cavalieri, S. Janssen, A. Smithson and T. Buisman who investigated the sugar beet seedling positions related to the seed
Seed Spacing 125 mm / Unit 5
-0.10 -0.05 0.00 0.05 0.10
-0.10 -0.05 0.00 0.05 0.10
Lateral shift (m)
Longitudinal (m)
2 kmh
5 kmh
Seed Spacing 202 mm / Unit 5
-0.10 -0.05 0.00 0.05 0.10
-0.10 -0.05 0.00 0.05 0.10
Lateral shift (m)
Longitudinal (m)
2 kmh
[image:8.595.171.420.151.463.2]5 kmh
positions. Thanks also to Hanne Lipczak Jakobsen and Knud Erik Knudsen from the University research farm who supported us carrying out the field experiments. We appreciate Peter Rasmussen’s help to improve the MatLab programming. We also thank DARCOF, ‘Danish Research Centre for Organic Farming’ for funding the project.
References
Blackmore, B. S. and Griepentrog, H. W. 2002. A future view of precision farming. In: Proceedings ‘Precision Agriculture Tage’, Bonn, 13–15th March 2002. (KTBL, Darmstadt, Germany), p. 131–145. Ehsani, M. R., Mattson, M. L. and Upadhyaya, S. K. 2000. An ultra-precise, GPS based planter for
site-specific cultivation and plant site-specific chemical application. In:Proceedings 5th International Conference on Precision Agriculture, edited by P. C. Robert, R. H. Rust and W. E. Larsen (ASA/CSSA/SSSA, Madison, WI, USA), CD-ROM.
Griepentrog, H. W., Nørremark, M., Nielsen, H. and Blackmore, B. S. 2003. Individual plant care in cropping systems. In:Proceedings of the 4th European Conference on Precision Agriculture, edited by J. V. Stafford and A. Werner (Wageningen Academic Publishers, Wageningen, Netherlands). Heege, H. J. and Billot, J. F. 1999. Seeders and planters. In:CIGR Handbook of Agricultural Engineering,
Volume III, Plant Production Engineering (ASAE, St. Joseph, USA), p. 217–240.
Nørremark, M., Griepentrog, H.-W., Nielsen, H. and Blackmore S. 2003. A method for high accuracy geo-referencing of data from field operations. In: Proceedings of the 4th European Conference on Precision Agriculture, edited by J. V. Stafford and A. Werner (Wageningen Academic Publishers, Wageningen, Netherlands).
Tillett, N. D., Hague, T. and Miles, S. J. 2002. Inter-row vision guidance for mechanical weed control in sugar beet. Computers and Electronics in Agriculture33, 163–177.