Eating Oil
INTRODUCTION
“Eating Oil” was the title of a book published in 1978 following the first oil crisis in 1973(1). The aim was to investigate the extent to which food supply in
industrialised countries relied on fossil fuels. In the summer of 2000 the degree of dependence on oil in the UK food system was demonstrated once again when protestors blockaded oil refineries and fuel distribution depots. The ‘fuel crisis’ disrupted the distribution of food and industry leaders warned that their stores would be out of food within days. The lessons of 1973 had not been heeded.
Indeed, the food system is now even more based on cheap crude oil. Every time we eat, we are all essentially ‘eating oil’. Virtually all of the processes in the modern food system are now dependent upon this finite resource which is nearing its depletion phase.
Moreover, at a time when we should be making massive cuts in the emissions of greenhouse gases into the atmosphere in order to reduce the threat posed by climate change, the food system is lengthening its supply chains and increasing emissions to the point where it is a significant contributor to global warming.
The organic sector should be leading the development of a sustainable food system. Direct environmental and ecological impacts of agriculture ‘on the farm’ are certainly reduced in organic systems. However, global trade and distribution of organic products fritter away those benefits and undermine its leadership role.
Not only is the contemporary food system inherently unsustainable, increasingly it is damaging the environment. A different approach - focussed on localisation not globalisation - needs to be developed in order to ensure “food supply in a changing climate”.
GLOBAL WARMING AND FINITE OIL
The threat of global warming and the need to reduce carbon emissions Global temperatures are rising faster than ever before recorded, and as a result weather patterns are becoming less predictable and more extreme(2). Man made
climate change is caused by emissions of greenhouse gases, particularly carbon dioxide (CO2) from burning fossil fuels (3). During the last decade the evidence
of a link between anthropogenic emissions of greenhouse gases, concentrations of these gases in the atmosphere and average global temperatures has been increasing. The Intergovernmental Panel on Climate Change (IPCC), an international advisory group consisting of 2,500 of the world's leading
climate
change experts, recently stated, “the balance of evidence suggests that there is a discernible human influence on global climate.”(4)
This paper, edited by Lawrence Woodward, is a summary version of the
report “Eating Oil: Food Supply in a Changing Climate” produced by
Sustain and Elm Farm Research Centre.
The original report was written by Dr Andy Jones.
Elm Farm
Research Centre
is an international research, advisory and educational organisation based in the UK. The business of Elm Farm Research Centre is to develop and support sustainable land-use, agriculture and food systems, primarily within local economies, which build on organic principles to ensure the health and
wellbeing of soil, plant, animal, man and the environment.
Elm Farm Research Centre Hamstead Marshall Newbury
Berkshire RG20 0HR UK
Tel: +44 (0) 1488 658298 Fax: +44 (0) 1488 658503 [email protected]
www.efrc.com
Company No: 1513190 Charity No: 281276 ISBN: 1 872064 33 7
January 2002
Printed on recycled paper
2
Elm Farm Research Centre January 2002
World carbon dioxide emissions from the consumption of fossil fuels increased by 21 per cent between 1980 and 1999, from 18.8 to 22.9 billion tonnes (5). Atmospheric carbon
dioxide levels are currently around 370 parts per million by volume (ppmv). Further rises are already inevitable but there is a consensus amongst scientists that the levels above 550 ppmv must be avoided. The IPCC has recommended cuts of 60-80 per cent in emissions of greenhouse gases to stabilise atmospheric levels of CO2 (6). The UK government believes
that industrialised country emissions may have to be reduced by as much as 90 per cent (7).
Reductions on this scale would require a significant shift away from the use of fossil fuels as an energy source, even their complete phasing out.
The nearness of the depletion stage of oil supplies Discovery of oil and gas peaked in the 1960s. Production is set to peak too, with five Middle East countries regaining control of world supply (8). Almost two-thirds of the world's
total reserves of crude oil are located in the Middle East notably Saudi Arabia, Iran and Iraq (9). An assessment of
future world oil supply and its depletion pattern shows that between 1980 and 1998 there was a 11.2 per cent increase in world crude oil production, from 59.6 to 66.9 million barrels of oil per day (9). Current world production rates are about 25
Gb (billion barrels) per year. A simple calculation shows that if consumption levels remain constant, world crude oil reserves, at approximately 1 trillion barrels, could be exhausted around 2040 (10)(Figure 1).
The oil crises of the 1970s when the Organisation of Petroleum Exporting Countries (OPEC) states reined their production have passed into folk memory. However, they were accompanied by massive disruption and global
economic recession. The same happened in 1980 and 1991(12).
Colin J. Campbell, a pre-eminent oil industry analyst, believes that future crises will be much worse. “The oil shocks of the 1970s were short-lived because there were then plenty of new oil and gas finds to bring on stream. This time there are virtually no new prolific basins to yield a crop of giant fields sufficient to have a global impact. The growing Middle East control of the market is likely to lead to a radical and permanent increase in the price of oil, before physical shortages begin to appear within the first decade of the 21st century. The world's economy has been driven by an abundant supply of cheap oil-based energy for the best part of this century. The coming oil crisis will accordingly be an economic and political discontinuity of historic proportions, as the world adjusts to a new energy environment” (8).
The three main purposes for which oil is used worldwide are food, transport and heating. In the near future the competition for oil for these three activities will be raw and real. An energy famine is likely to affect poorer countries first, when increases in the cost of paraffin, used for cooking, place it beyond their reach. Following the peak in production, food supplies all over the world will begin to be disrupted, not only because of price increases but because the oil will no longer be there (11).
ENERGY, TRANSPORT AND THE FOOD
SYSTEM
Our food system is energy inefficient...
One indicator of the unsustainability of the contemporary food system is the ratio of energy outputs - the energy content of a food product (calories) - to the energy inputs. The latter is all the energy consumed in producing, processing, packaging and distributing that product. The energy ratio (energy out/energy in) in agriculture has decreased from being close to 100 for traditional pre-industrial societies to less than 1 in most cases in the present food system, as energy inputs, mainly in the form of fossil-fuels, have gradually increased.
In modern high input fruit and vegetable cultivation, the output/input ratio is between 2 and 0.1 (i.e. 1 calorie of food energy output requires between 0.5 and 10 calories of energy input, respectively). For intensive beef production the ratio is between 0.1 and 0.03, and may reach extreme values of 0.002 for winter greenhouse vegetables (13). All of these
ratios refer only to the energy consumed up to the farm gate and exclude processing, packaging and distribution.
[image:2.612.51.292.429.634.2]is 0.00786. In other words 127 calories of energy (aviation fuel) are needed to transport 1 calorie of lettuce across the Atlantic. If the energy consumed during lettuce cultivation, packaging, refrigeration, distribution in the UK and shopping by car was included the energy needed would be even higher. Similarly, 97 calories of transport energy are needed to import 1 calorie of asparagus by plane from Chile, and 66 units of energy are consumed when flying 1 unit of carrot energy from South Africa.
Just how energy inefficient the food system is can be seen in the crazy case of the Swedish tomato ketchup. Researchers at the Swedish Institute for Food and Biotechnology analysed the production of tomato ketchup (14). The study
considered the production of inputs to agriculture, tomato cultivation and conversion to tomato paste (in Italy), the processing and packaging of the paste and other ingredients into tomato ketchup in Sweden and the retail and storage of the final product. All this involved more than 52 transport and process stages.
The aseptic bags used to package the tomato paste were produced in the Netherlands and transported to Italy to be filled, placed in steel barrels, then moved to Sweden. The five layered, red bottles were either produced in the UK or Sweden with materials form Japan, Italy, Belgium, the USA and Denmark. The polypropylene (PP) screw-cap of the bottle and plug, made from low density polyethylene (LDPE), was produced in Denmark and transported to Sweden. Additionally, LDPE shrink-film and corrugated cardboard, were used to distribute the final product. Labels, glue and ink were not included in the analysis.
This example demonstrates the extent to which the food system is now dependent on national and international freight transport. However, there are many other steps involved in the production of this everyday product. These include the transportation associated with: the production and supply of nitrogen, phosphorous and potassium fertilisers; pesticides; processing equipment and farm machinery. It is likely that other ingredients such as sugar, vinegar, spices and salt are also imported. Most of the processes listed above will also depend on derivatives of fossil fuels. This product is also likely to be purchased in a shopping trip by car.
………is dependent on oil………. Trade-related transportation has been estimated to account for one eighth of world oil consumption and is expected to increase by 70 per cent between 1992 and 2004 from 29 to 49 trillion tonne-kilometres (15). If this occurs the carbon
dioxide emissions resulting from international trade will increase from approximately 1.45 billion tonnes in 1992 to 2.45 billion tonnes in 2004. Transport associated with the food system is a significant part of this story.
One study has estimated that UK imports of food products and animal feed involved transportation by sea, air and road amounting to over 83 billion tonne-kilometres (16). This
required 1.6 billion litres of fuel and, based on a conservative figure of 50 grammes of carbon dioxide per tonne-kilometre resulted in 4.1 million tonnes of carbon dioxide emissions (17). Within the UK, the amount of food
transported increased by 16% and the distances travelled by 50% between 1978 and 1999 (Table 1).
It has been estimated that the CO2emissions attributable to
producing, processing, packaging and distributing the food consumed by a family of four is about 8 tonnes a year (19)
………and is unnecessarily contributing to carbon emissions
It is not that this transportation is critical or necessary. In many cases countries import and export similar quantities of the same food products (20). A recent report has highlighted
the instances in which countries import and export large quantities of particular foodstuffs (20). For example, in 1997
126 million litres of liquid milk was imported into the UK and at the same time 270 million litres of milk was exported from the UK. 23,000 tonnes of milk powder was imported into the UK and 153,000 tonnes exported (21). UK milk
imports have doubled over the last 20 years, but there has been a four-fold increase in UK milk exports over the last 30 years (22).
Britain imports 61,400 tonnes of poultry meat a year from the Netherlands and exports 33,100 tonnes to the Netherlands. We import 240,000 tonnes of pork and 125,000 tonnes of lamb while exporting 195,000 tonnes of pork and 102,000 tonnes of lamb (20).
This system is unsustainable, illogical, and bizarre and can only exist as long as inexpensive fossil fuels are available and we do not take significant action to reduce carbon dioxide emissions.
Quantity (millions of tonnes) Average distance (kilometres) 1978 287 82
1983 264 89
1988 302 100
1993 300 119
1998 346 123
[image:3.612.317.562.192.276.2]1999 333 125
4
Elm Farm Research Centre January 2002
IS ORGANIC ANY DIFFERENT?
The organic system is more energy efficient to the farm gate………..
One of the benefits of organic production is that energy consumption and, therefore, fossil fuel consumption and greenhouse gas emissions, are less than that in conventional systems.
The energy used in food production is separated into direct and indirect inputs. Indirect inputs include the manufacture and supply of pesticides, feedstuffs and fertilisers while direct energy inputs are those on the farm, such as machinery. One measure of the energy efficiency of food production that allows a comparison between different farming practices is the energy consumed per unit output, often expressed as the energy consumed per tonne of food produced (MJ/tonne) or the energy consumed per kilogram of food (MJ/kg).
A study comparing organic and conventional livestock, dairy, vegetable and arable systems in the UK found that with average yields, the energy saving with organic production ranged from 0.14 MJ/kg to 1.79 MJ/kg, with the average being 0.68 MJ/kg or 42 per cent (23). The results for
arable and vegetable production are shown in (Figure 2).
The improved energy efficiency in organic systems is largely due to lower (or zero) fertiliser and pesticide inputs, which account for half of the energy input in conventional potato and winter wheat production and up to 80 per cent of the energy consumed in some vegetable crops.
In conventional upland livestock production, the largest energy input is again indirect in the form of concentrated and cereal feeds. When reared organically, a greater proportion of the feed for dairy cattle, suckler beef and hill
[image:4.612.303.546.222.400.2]sheep is derived from grass. In the case of milk production it has been found that organic systems are almost five times more energy efficient on a per animal basis and three and a half times more energy efficient in terms of unit output (the energy required to produce a litre of milk) (23).
...but not when it goes global.
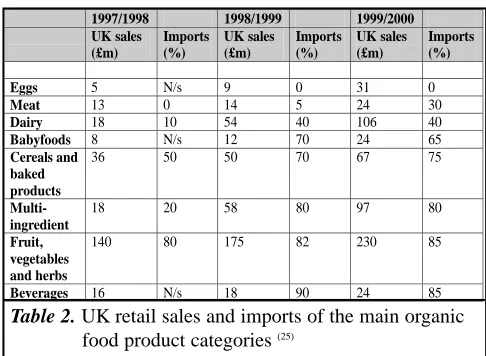
So far so good but once passed the farm-gate things begin to go wrong. Britain imports over three-quarters of its organic produce, and despite consumer demand, only two per cent of its land is organically farmed (24). As the market has grown
it has been met by imports (Table 2).
A study looking at the energy consumption and carbon dioxide emissions when importing organic food products to the UK by plane (26) found that carbon dioxide emissions
range from 1.6 kilograms to 10.7 kilograms. Air transport of food is the worst environmental option but road transport, especially unnecessary journeys, is also bad. For example 5kg of Sicilian potatoes travelling 2448 miles emits 771 grammes of carbon dioxide.
ALTERNATIVES, CONCLUSIONS AND
RECOMMENDATIONS
Proximity and localisation of food system would be beneficial
The contemporary food system is inherently unsustainable. Indicators of social, environmental and economic performance, such as food security, greenhouse gas emissions, food miles, farm income and biodiversity highlight this fact.
This process could be reversed by re-establishing local and regional food supply systems and substituting ‘near for far’ in production and distribution systems. This would reduce both the demand for and the environmental burdens associated with transportation.
The proximity principle is a straightforward concept in
1997/1998 1998/1999 1999/2000
UK sales (£m)
Imports (%)
UK sales (£m)
Imports (%)
UK sales (£m)
Imports (%)
Eggs 5 N/s 9 0 31 0
Meat 13 0 14 5 24 30
Dairy 18 10 54 40 106 40
Babyfoods 8 N/s 12 70 24 65
Cereals and baked products
36 50 50 70 67 75
Multi-ingredient
18 20 58 80 97 80
Fruit, vegetables and herbs
140 80 175 82 230 85
Beverages 16 N/s 18 90 24 85
Figure 2.Energy input in conventional and organic arable and vegetable production (MJ/kg)(23)
which production processes are located as near to the consumer as possible. When applied to food supply, local food systems in the form of home-delivery box schemes, farmers’ markets and shops selling local produce would replace imported and centrally distributed foodstuffs.
Taking UK food supply and trade at present, there is great potential to apply the proximity principle, in the form of import substitution. Apart from products such as bananas, coffee and tea, many of the foodstuffs that are imported at present could be produced in Britain. Many meat products, cereals, dairy products and cooking oils are or could be available here throughout the year. So could fruit and vegetables, perhaps the most seasonal of food groups, through a combination of cultivating different varieties and traditional and modern storage and preservation techniques.
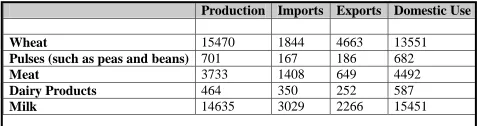
[image:5.612.51.290.330.393.2]The land currently used to produce food that is exported could be used to increase our self-sufficiency.
Table 3 shows foodstuffs for which the quantity produced in the UK is very close to the amount consumed here. Despite this, there are significant levels of imports and exports in these products at present.
There is growing evidence of environmental benefits of local sourcing of food in terms of reduced transport related environmental impact. In the case of organic produce, a survey of retailers compared local and global sourcing of produce marketed in different outlets between June and August 2001. Products were chosen that were available in the UK during these months but are at present imported by the multiple retailers. These included spring onions imported by plane from Mexico, potatoes imported by road from Sicily, onions imported by ship from New Zealand. It was found that local sourcing through a farmers market, for example, would therefore reduce the greenhouse gas emissions associated with distribution by a factor of 650 in the case of a farmers’ market and more for box schemes and farm shop sales (27).
The value of UK food, feed and drink imports in 1999 was over £17 billion. It is clear that a reduction in food imports through import substitution would not only be of benefit to the UK economy as a whole but could also be a major driver in rural regeneration as farm incomes would increase substantially. Local food systems also have great potential to reduce the damaging environmental effects of the current food supply system.
There are essentially three mechanisms through which the food system could relocalise.
These are:
a) Voluntary approaches by the agriculture and food industries and consumers
Although many multiple retailers now have a local sourcing policy and targets for the percentage of food products sourced within the locality or region, the targets that have been set are low. Asda, for example, aims to source two per cent of food products locally. Even when supermarkets promote produce as being local or regional, the food will probably have been transported a considerable distance due to regional distribution centres and centralised processing. The economies of scale and centralised distribution systems of the multiple retailers are not easily suited to dealing with small-scale producers and direct deliveries to stores by local farmers and processors. However more could be done especially if the economic framework changes and there is more pressure from consumers.
Many concerned consumers do not have the information with which they could make an informed choice. Information could be improved through some form of label that indicates the distance accumulated and the transport-related environmental impact. Colour coding could also be applied. The organic certifier Bio-Swiss already distinguishes between imported and national produce on their labels.
Farm assurance schemes and organic certification bodies, could introduce the proximity principle into certification. The options for reducing the damaging effects of post-farm gate transport by providing incentives to market produce locally, for example, through reduced certification costs or an added premium or market advantage should now be considered.
Many restaurants, hotels and public houses now source ingredients locally. This is often seen as a direct way to support local farmers and also indicates the freshness and seasonality of the food on the menu. The National Trust now has a policy to supply its restaurants and cafeterias with local food. This is a welcome move that could become more widespread.
b) Increases in environmental taxes
Another way to reduce the damaging effects of food miles is to increase the costs of transportation so that the environmental damage (such as air pollution and greenhouse gas emissions) are accounted for. In Switzerland, a Heavy Vehicle Fee (HVF) was introduced in January 2001 (28). The
HVF charges heavy goods vehicles (over 3.5 tonnes) based on their gross weight, kilometres driven and emissions.
In 1994, in the UK, The Royal Commission on Environmental Pollution recommended that fuel duty be
Production Imports Exports Domestic Use
Wheat 15470 1844 4663 13551
Pulses (such as peas and beans) 701 167 186 682
Meat 3733 1408 649 4492
Dairy Products 464 350 252 587
Milk 14635 3029 2266 15451
6 Elm Farm Research Centre January 2002
increased every year so as to double the price of fuel, relative to the prices of other goods, by 2005, which would require a 9 per cent annual increase in fuel duty (29).
Successive UK governments adopted increases in fuel duty until the fuel protests in 2000, following which the fuel duty escalator was dropped.
It is assumed that increases in the costs of road transport will encourage a shift to more environmentally benign modes of transport such as rail freight, and public transport and home delivery in the case of shopping trips that are currently done by car. In theory, if transport costs continue to increase there will be a point at which existing distribution systems become uneconomic and alternative distribution systems that are more localised become a viable alternative. The most obvious gap in the economic framework is the failure to tax aviation fuel.
At present most of these taxation measures are seen as being politically unacceptable. Yet the introduction of some kind of fiscal or taxation policy is likely to be required if sustainable food supply is to become a reality. However, local food schemes will need to be developed at the same time and preferably beforehand, in order to provide an attractive and viable alternative to transport-intensive food supply chains.
c) Targets and direct policy and fiscal support for local food systems
Developing a sustainable food system should be a key policy objective for central government, local government and regional development agencies, based on targets for sustainable food production, import substitution, fair trade and local sourcing of food. For instance, the initiative recently announced to provide 'one piece of fruit per school child' offers an ideal opportunity for the government to show its commitment to the development of a sustainable food system. Ambitious targets could be set to meet this increased demand in fresh fruit locally.
Funds available at local, regional, national and European (Rural Development Regulation) level should be directed to support the development of sustainable local and regional food distribution systems. Specifically, there should be an increase in siphoning off CAP production subsidies into support for sustainable farming and regional food economies. Regional Development Agencies could also play an important role in developing regional food systems through grant allocation, technical support and marketing advice. All regional development plans should include local food economy targets.
Direct support for the expansion of local food systems could come in the form of targets set for the procurement of local food by schools, hospitals and publicly run catering facilities. The targets could be modest to begin with, which would allow local food producers to adapt to the new
circumstances. Another mechanism that could be used is inducement through the tax system, so that the rates paid by businesses such as hotels, restaurants and caterers would be reduced if a certain percentage of their food is supplied locally or regionally.
The introduction of practical and classroom based education on food, farming and sustainable development in the National Curriculum would also help to raise awareness and understanding.
CONCLUSIONS
A sustainable food system cannot rely, almost completely, on one finite energy source; an energy source which causes enormous levels of pollution during its production, distribution and use. Although food supplies in wealthy countries such as the UK appear to be secure and choice, in terms of thousands of food products being available at supermarkets, seems limitless, this is an illusion.
The vulnerability of our food system to sudden changes was demonstrated during the fuel crisis in 2001. A sharp increase in the price of oil or a reduction in oil supplies could present a far more serious threat to food security and is likely to as oil enters its depletion phase. Food production and distribution, as they are organised today, would not be able to function. Moreover, the alternatives, in the form of sustainable agriculture and local food supplies, which minimise the use of crude oil, are currently unable to respond to increased demand due to low investment and capacity.
The food system is now a significant contributor to climate change. Reducing the carbon dioxide emissions from food production, processing and distribution by minimising the distance between producer and consumer should be a critical part of any strategy to mitigate global warming.
There are many benefits to organic farming, including reduced fossil fuel energy consumption and greenhouse gas emissions. However, these are often overshadowed by the environmental damage of long distance transport. Organic products that are transported long distances, particularly when distribution is by plane, are almost as damaging as their conventional air freighted counterparts. Highly processed and packaged organic foodstuffs have an added adverse environmental impact.
1 Green, B. M., 1978. Eating Oil - Energy Use in Food
Production. Westview Press, Boulder, CO. 1978.
2 Forum for the Future, 2001. Annual Report.Forum for the
Future, London.
3 DETR, 2000.Quality of life counts. Department of the
Environment Transport and the Regions, HMSO, London.
4 Mark Muller, Catherine Hofman and Paul Hodges, 2000. Addressing Climate Change and Providing New Opportunities for Farmers. Institute for Agriculture and Trade Policy, Minnesota, USA, September 2000.
5 USDOE, 2001.World Carbon Dioxide Emissions from the Consumption and Flaring of Fossil Fuels, 1980-1999. US Department of the Environment at http://www.eia.doe.gov/ pub/international/iealf/tableh1.xls
6 RCEP, 2000. Energy – The Changing Climate. The Royal
Commission on Environmental Pollution, Twenty-second Report, June 2000, HMSO, London.
7 DETR, 2001. The draft UK climate change programme.
DETR, 2001. HMSO, London.
8 Colin J. Campbell, 1997. The Coming Oil Crisis.
Multi-Science Publishing Co. Ltd
9
Green Party USA, 2001. World crude oil reserves – Statistical information. Based on data from the Oil and Gas Journal and the Energy Information Agency. At http://environment.about.com/library/weekly/aa092700.htm
10
Medea: European Agency for International Information, 2001. Oil Reserves. at - http://www.medea.be/en/
11 David Fleming, 2001.The Great Oil Denial. Submission to the UK Energy Review. At http://www.cabinet-office.gov.uk/innovation/2001/energy/submissions/Fleming
12
EIA, 2001. World Oil Market and Oil Price
Chronologies: 1970 – 2000. Department of Energy’s Office of the Strategic Petroleum Reserve, Analysis Division, Energy Information Administration, Department of the Environment, USA, at www.eia.doe.gov
13 Weizsäcker, E. U. von, Lovins, B., and Lovins, L. H.,
1998. Factor Four: Doubling Wealth, Halving Resource Use. Earthscan, London.
14 Andersson, K. Ohlsson, P and Olsson, P. 1996, Life Cycle Assessment of Tomato Ketchup. The Swedish Institute for Food and Biotechnology, Gothenburg.
15 Simms, A, Kumar, R, and Robbins, N., 2000. Collision course: free trade’s free ride on the global climate. New Economics Foundation, London.
16 Cowell, S., and R. Clift., 1996. Farming for the future: an environmental perspective. Paper presented at the Royal Agricultural Society of the Commonwealth, July 1996, CES, University of Surrey.
17 Data for shipping and airfreight from Guidelines for company reporting on greenhouse gas emissions.
Department of the Environment, Transport and the Regions:
J., 1993. Transport for a sustainable future: the case for Europe. Belhaven Press, London; and Gover, M. P., 1994.
UK petrol and diesel demand: energy and emission effects of a switch to diesel. Report for the Department of Trade and Industry, HMSO, London.
18 DETR, 1999. Transport of Goods by Road 1998,
Department of the Environment Transport and the Regions, HMSO, London.
19 BRE, 1998. Building a sustainable future. General
information report 53, energy efficiency best practice programme, Building Research Establishment, Garston, UK.
20 Caroline Lucas, 2001. Stopping the Great Food Swap -Relocalising Europe’s food supply.Green Party, 2001.
21 Lobstein, T, and Hoskins, R, The Perfect Pinta. Food
Facts No. 2. The SAFE Alliance, 1998.
22 FAO, 2001. Food Balance Database. 2001. Food and
Agriculture Organisation, Rome at www.fao.org
23 Energy use in organic farming systems ADAS Consulting
for MAFF, Project OF0182, DEFRA, London, 2001.
24 Natasha Walter, 2001. When will we get the revolution. The Independent19th July 2001.
25 The Soil Association, 2001. The organic food and farming report 2000.The Soil Association, Bristol
26 Based on data on sourcing from UKROFS and a survey of
supermarket stores during June – August 2001; distance tables for air miles at www.indo.com/cgi-bin/dist and the environmental impact of airfreight in Guidelines for company reporting on greenhouse gas emissions.
Department of the Environment, Transport and the Regions, London, March 2001.
27 Data for shipping and airfreight from Guidelines for company reporting on greenhouse gas emissions.
Department of the Environment, Transport and the Regions: London, March 2001. Data for trucks is based on Whitelegg, J., 1993. Transport for a sustainable future: the case for Europe. Belhaven Press, London; and Gover, M. P., 1994.
UK petrol and diesel demand: energy and emission effects of a switch to diesel. Report for the Department of Trade and Industry, HMSO, London. Data for cars from the Vehicle Certification Agency at www.vca.gov.uk; Whitelegg, J., 1993. Transport for a sustainable future: the case for Europe. Belhaven Press, London; and Gover, M. P., 1994.
UK petrol and diesel demand: energy and emission effects of a switch to diesel. Report for the Department of Trade and Industry, HMSO, London.
28
VTPI, 2001. Freight Management: Reducing Commercial Vehicle Traffic.TDM Encyclopedia, Victoria Transport Policy Institute, Victoria, Canada at www.vtpi.org
29 RCEP, 1994. Transport and the Environment 18th Report
Elm Farm Research Centre January 2002 8
Acknowledgements
Elm Farm Research Centre thanks Andy Jones, Vicki Hird and Sustain for the work and thought they put into this project.
David Astor who died shortly before the publication of the report funded the "Eating Oil" project. The full report and this summary are dedicated to him.
‘Who’s Who’ At Elm Farm Research Centre
Council of Management
Chairman: Christopher A. Bielenberg
Trustees: James Cornford D. Roger Harrison
Dr. Adam Onken James S. Skinner Prof. Dr. Hartmut Vogtmann
Members of Staff
Director/Company Secretary: Lawrence Woodward OBE
Deputy Director and
Finance & Resources Director: Pat Walters BA FMAAT
Head of Operations: Bruce Pearce PhD
Administration: Alison Day Pam Tibbatts
Gillian Woodward
Research: Bruce Pearce PhD Prof. Martin Wolfe PhD
James Welsh PhD Lois Philipps BSc
Scott Phillips MSc
Research Associates: Nigel Dudley BSc Nic Lampkin PhD
Christopher Stopes MSc
Farm: Louise Thompson BSc Paul Oeppen MSc
Education: Judith Towers DipHE
Publications/Communications: Vanessa Gray BA
Lean Economy Initiative: David Fleming MA, MBA, PhD
IT Support: Nu-Zone Solutions
Advisory: Jane Uglow, BSc Fergus McLachlan Clark
OAS Consultants & Associates: Josie Bevan, PhD Tim Budden, HND Agric Andrew Carnegie, NCFBM Tim Clarke, BSc
Laura Davis, MA Hugh Davison, MSc
Tim Deane, Nat Cert Agric Gerard Dinnage, NDA
Paula Dossett, BSc Trevor Drew, BSc
Michael Duveen Rod Everett, BSc
Simon Gaddes, MRICS Bill Grayson, PhD
Roger Hitchings BSc Phil Hitchman, HND
Malla Hovi, MRCVS Rob Lavender, BSc
Gary Lightfoot, Nat Cert Agric Mark Measures, BSc Charles Morrish, PhD Philip Nash
Rob Osborne Dan Powell, BSc
Bill Starling, BSc Martin Todman, BSc
Iain Tolhurst William Waterfield, MBIAC
Michael Westripp Ben Wightman, BIAC
Bob Winfield,BSc Isobel Wright BSc
Patrons of EFRC
David Gillett The Countess of March and
Kinrara The Lord Poole
Graham Pye Jan Sundt Peter and Juliet Kindersley
Bankers
Charity Money Management CafCash Ltd
Kings Hill West Malling Kent ME19 4TA
National Westminster Bank Plc City of London Office PO Box 12258 1 Princes Street London EC2R 8PA
Auditors
Russell New The Courtyard Beeding Court Steyning
W est Sussex BN44 3TN
Registered Office:
Elm Farm Research Centre, Hamstead Marshall, Nr.
Newbury, Berkshire RG20 0HR
Tel: + 44(0)1488 658298 Fax: +44(0)1488 658503
E-mail: [email protected]
Visit the EFRC website at www.efrc.com
Investment Manager
Newton