A DISSERTATION
ON
“
PROSPECTIVE STUDY ON ERYTHROCYTE
MORPHOLOGY AND MICROVASCULAR
COMPLICATIONS IN TYPE 2 DIABETES MELLITUS”
Submitted to
THE TAMILNADU DR. M. G. R. MEDICAL UNIVERSITY,
CHENNAI
In partial fulfillment of the regulations
for the award of
M. D. DEGREE IN GENERAL MEDICINE
BRANCH I
GOVERNMENT MOHAN KUMARAMANGALAM
MEDICAL COLLEGE, SALEM
Acknowledgement
I am extremely thankful to Dr. P. KANAGARAJ, M.D., Dean,
Government Mohan Kumaramangalam Medical College Salem, for allowing
me to utilize the hospital facilities for doing this work.
I express my immense gratitude to Dr. S. SURESH KANNA, M D.,
Professor, Department of General Medicine, Government Mohan
Kumaramangalam Medical College Hospital, for his unrelenting inspiration
and excellent guidance in the completion of this study. His enthusiasm and
immense encouragement have been responsible for easing out many
shortcomings during this work.
I am deeply indebted to Dr. G.PRAKASH M.D., D.Diab., Associate
Professor Department of Diabetology, Government Mohan Kumaramangalam
Medical College Hospital, for his fathomless enthusiasm and motivation
throughout the study.
I would like to express my heartfelt gratitude to my postgraduate mentor
and teacher, Dr.S.R.SUBRAMANIAN M.D., Professor& Head, Department
of General Medicine, Government Mohan Kumaramangalam Medical College
Hospital for his relentless encouragement and expert guidance throughout the
period of the study and postgraduate course.
Warmest and sincere thanks to my Professors
Dr.MANJULA M.D., and Dr. ELANCHEZIAN M.D., for all the help,
encouragement and guidance during my post graduation study period.
My warmest gratitude to Dr. T. YOGANANDH M.D., Registrar,
Department of General Medicine for his guidance in completing the study.
I am deeply grateful to Dr. PALANIVEL RAJAN M.D.,
Dr.S.SUDHASELVI M.D., Dr.M.KUMAR RAJA M.D., Assistant
professors in the Department of General Medicine for their immense help and
guidance during my post-graduation course. I am also thankful to all the
Assistant professors for their continued guidance throughout my study period.
I would like to thank Dr. M. THENMOZHI M.D, Professor and HOD
and all the faculties, Department of Pathology for their support throughout this
study.
I also thank the Department of ophthalmology for their help and
guidance to carry out this thesis.
I would like to acknowledge Mr. VENKATESH and
Mr. NANDAKUMAR, for helping me to analyze and compile the statistical
data for my study.
I extend my heartfelt thanks to all my colleagues and friends for their
help rendered during my study.
I specially thank all my patients without whose cooperation, this
TABLE OF CONTENTS- APPENDIX LIST
S.NO
APPENDIX TITLE
PAGE.NO
I
APPENDIX I
3
IA1
INTRODUCTION
3
IA2
NEED FOR THE STUDY
4
IB
AIMS AND OBJECTIVES OF THE STUDY
5
IC
REVIEW OF LITERATURE
6
IC1
HISTORICAL REVIEW
6
1C2
EPIDEMIOLOGICAL REVIEW
9
ID1
DEFINITION
11
ID2
CRITERIA FOR DIABETES
11
ID3
CLASSIFICATION OF DIABETES MELLITUS
12
ID4
METABOLIC DERANGEMENTS IN DIABETES
MELLITUS
14
ID5
MICROVASCULAR COMPLICATIONS
15
ID6
ROLE OF RBCs
17
ID7
DIABETIC NEPHROPATHY
26
ID8
DIABETIC RETINOPATHY
29
ID9
ANEMIA IN DIABETES
31
IE1
GLYCATED HEMOGLOBLIN
33
IE2
BLOOD SUGAR
34
IE3
RENAL PARAMETERS
35
IE4
MICROALBUMINURIA
36
II
APPENDIX II- MATERIALS AND METHODS
40
II A
SOURCE OF DATA
40
IIC
LABORATORY INVESTIGATIONS IN DIABETIC
NEPHROPATHY
41
IID
SAMPLE COLLECTION
42
IID1
URINE SPOT PCR
42
IID2
PERIPHERAL SMEAR PROCEDURE
43
IID3
FUNDOSCOPIC EXAMINATION
45
III
APPENDIX III - STATISTICAL ANALYSIS
46
IIIA
RESULTS
46
IIIB
DISCUSSION
72
IIIC
LIMITATIONS OF STUDY
77
IIID
CONCLUSIONS
78
IV
SUMMARY
79
V
VI
VIII
IX
X
REFERENCES
PROFORMA
PATIENT CONSENT FORM
ETHICAL COMMITTEE APPROVAL
LIST OF FIGURES
S.NO
FIGURE TITLE
PAGE.NO
1
CLASSIFICATION OF DIABETES
13
2
MICROVASCULAR COMPLICATIONS
15
3
PATHOGENESIS OF DIABETIC
MICROANGIOPATHY
17
4
PATHOPHYSIOLOGY OF RBC ROLE IN
MICROANGIOPATHY
18
5
ASCORBATE IN RBC OF DIABETICS
19
6
NORMAL MORPHOLOGY OF PS
20
7
PS OF MICROCYTOSIS
21
8
PS OF MACROCYTOSIS
21
9
SPHEROCYTES
22
10
STOMATOCYTES.
22
11
ELLIPTOCYTES
22
12
TEAR DROP RBCS
22
13
TARGET CELLS
22
14
SICKLE CELLS
22
15
KERATOCYTES
23
16
SCHISTOCYTE
23
17
BURR CELL
23
18
SPUR CELL
23
19
RED CELL AGGLUTINATE
24
20
RBC ROULEAUX APPEARANCE.
24
21
PS OF HYPOCHROMIA
25
22
DIAGRAMMATIC REPRESENTATION OF RED CELL
23
FREQUENCY OF VARIATION IN RBC
MORPHOLOGY IN DIABETICS
26
24
CLINICAL TRIAD OF DN
27
25
HISTOLOGY OF NORMAL GLOMERULUS VS DN
28
26
HISTOLOGY OF HYALINE ARTERIOLE AND KW
NODULE
28
27
FUNDUS CHANGES IN DR
30
28
STAGES OF DIABETIC RETINOPATHY
31
29
ETIOLOGY OF ANEMIA IN DIABETES
32
30
PATHOGENESIS OF ANEMIA IN DIABETES
33
31
REAGENT STRIP TEST FOR URINE PROTEIN
37
32
STERILE URINE CONTAINER
43
33
BLOOD SMEAR PREPARATION
44
34
STAINING PROCEDURE OF BLOOD SMEAR
44
35
FUNDOSCOPIC EXAMINATION
45
36
NORMAL FUNDUS
45
37
HYPOCROMIA
69
38
TARGET CELLS
69
39
BURR CELL
69
40
SICKLE CELL
69
41
SCHISTOCYTES
70
42
STOMATOCYTES
70
43
ANISOCYTOSIS
70
44
ELLIPTOCYTES
70
45
DACRYOCYTES
71
46
MICROSPHEROCYTES
71
47
MICROCYTIC HYPOCHROMIC PS
71
LIST OF CHARTS
S.NO
CHART TITLE
PAGE.NO
1
PIE DIAGRAM SHOWING SEX DISTRIBUTION
46
2
BAR DIAGRAM SHOWING AGE DISTRIBUTION
OF THE STUDY POPULATION
47
3
MEAN DURATION OF DIABETES
49
4
FREQUENCY DISTRIBUTION OF FBS
50
5
FREQUENCY DISTRIBUTION OF PPBS
50
6
DISTRIBUTION OF URINE ALBUMIN
51
7
DISTRIBUTION OF URINE ALBUMIN,
SUGAR,DEPOSITS
52
8
DISTRIBUTION OF URINE SPOT PCR
ALBUMINURIA
52
9
PIE DIAGRAM SHOWING DISTRIBUTION OF
PERIPHERAL SMEAR CHANGES
53
10
BAR DIAGRAM SHOWING DISTRIBUTION OF
ANISOCYTOSIS, POIKILOCYTOSIS,
HYPOCHROMIA IN SMEAR STUDY
54
11
BAR CHART SHOWING GRADING OF
ANISOPOIKILOCYTOSIS, HYPOCHROMIA
55
12
PIE DIAGRAM SHOWING DISTRIBUTION OF
FUNDUS CHANGES
56
13
PIE DIAGRAM SHOWING PERCENTAGE OF
14
PIE DIAGRAM SHOWING DISTRIBUTION OF
HBA1C
57
15
BAR DIAGRAM SHOWING CORRELATION OF
URINE ALBUMIN WITH SPOT PCR
59
16
BAR DIAGRAM SHOWING CORRELATION
BETWEEN PERIPHERAL SMEAR AND SPOT PCR.
60
17
BAR DIAGRAM SHOWING CORRELATION OF
URINE ANALYSIS WITH PERIPHERAL SMEAR
61
18
BAR DIAGRAM SHOWING CORRELATION
BETWEEN FUNDUS CHANGES WITH SPOT PCR
MICROALBUMINURIA.
62
19
BAR DIAGRAM SHOWING CORRELATION
BETWEEN FUNDUS CHANGES AND URINE
MICROALBUMINURIA
63
20
BAR DIAGRAM SHOWING CORRELATION
BETWEEN PERIPHERAL SMEAR AND FUNDUS
CHANGES
64
21
BAR DIAGRAM CORRELATION BETWEEN
HBA1C LEVEL WITH PERIPHERAL SMEAR AND
MICROALBUMINURIA
65
22
BAR DIAGRAM SHOWING CORRELATION
BETWEEN HB AND HBA1C LEVEL.
66
23
BAR DIAGRAM SHOWING DISTRIBUTION OF
PERIPHERAL SMEAR ,MICROALBUMINURIA
AND FUNDUS CHANGES.
67
24
BAR DIAGRAM SHOWING CORRELATION
BETWEEN CREATININE LEVEL AND
PERIPHERAL SMEAR
LIST OF TABLES
S.NO
TABLE TITLE
PAGE.NO
1
ADA CRITERIA FOR DIABETES
11
2
GRADING OF POIKILOCYTOSIS
24
3
CLINICAL STAGING OF CKD BASED ON GFR
AND ALBUMINURIA
29
4
DEFINITION OF MICROALBUMINURIA
39
5
SEX DISTRIBUTION IN STUDY GROUP
46
6
AGE DISTRIBUTION IN THE STUDY
POPULATION
47
7
MEAN AGE OF THE STUDY POPULATION
48
8
DURATION OF DIABETES IN THE STUDY
POPULATION
48
9
MEAN DURATION OF DIABETES
48
10
FREQUENCY DISTRIBUTION OF FBS
49
11
FREQUENCY DISTRIUTION OF PPBS
49
12
DISTRIBUTION OF URINE ALBUMIN
50
13
DISTRIBUTION OF URINE SUGAR
51
14
DISTRIBUTION OF URINE DEPOSITS
51
15
DISTRIBUTION OF URINE SPOT PCR
ALBUMINURIA
52
17
DISTRIBUTION OF POIKILOCYTOSIS
53
18
DISTRIBUTION OF HYPOCHROMIA
54
19
DISTRIBUTION OF ANISOPOIKILOCYTOSIS &
HYPOCHROMIA
54
20
DISTRIBUTION OF GRADING OF ANISOCYTOSIS
55
21
DISTRIBUTION OF GRADING OF
POIKILOCYTOSIS
55
22
DISTRIBUTION OF FUNDUS CHANGES
56
23
DISTRIBUTION OF LOW HB LEVEL
56
24
FREQUENCY DISTRIBUTION OF HBA1C.
57
25
DESCRIPTIVE STATISTICS OF STUDY
PARTICIPANTS
58
26
CORRELATION OF URINE ALBUMIN WITH SPOT
PCR
58
27
CORRELATION BETWEEN PERIPHERAL SMEAR
AND SPOT PCR
59
28
CORRELATION OF URINE ANALYSIS WITH
PERIPHERAL SMEAR
60
29
CORRELATION BETWEEN FUNDUS CHANGES
WITH SPOT PCR MICROALBUMINURIA
61
30
CORRELATION BETWEEN FUNDUS CHANGES
AND URINE MICROALBUMINURIA
62
31
CORRELATION BETWEEN PERIPHERAL SMEAR
AND FUNDUS CHANGES
63
32
CORRELATION BETWEEN HBA1C LEVEL WITH
PERIPHERAL SMEAR AND MICROALBUMINURIA
64
33
DISTRIBUTION BETWEEN HB AND HBA1C
LEVEL
65
34
TEST OF SIGNIFICANCE BETWEEN HB AND
35
DISTRIBUTION OF PERIPHERAL SMEAR,
MICROALBUMINURIA AND FUNDUS CHANGES
IN THE STUDY GROUP
67
36
CORRELATION BETWEEN CREATININE
LIST OF ABBREVIATIONS USED
•
DR – DIABETIC RETINOPATHY
•
DM- DIAETIC MELLITUS
•
DN- DIABETIC NEPHROPATHY
•
ADA- AMERICAN DIABETES ASSOCIATION
•
IDDM – INSULIN DEPENDENT DIABETES MELLITUS
•
IGT - IMPAIRED GLUCOSE TOLERANCE
•
IFG- IMPAIRED FASTING HYPERGLYCEMIA
•
TCA – TRICARBOXYLIC ACID CYCLE
•
NADPH- NICOTINAMIDE ADENINE DINUCLEOTIDE
PHOSPHATE HYDROGEN
•
AGE - ADVANCED GLYCATION END PRODUCTS
•
RAGE - RECEPTORS FOR AGES
•
ROS - REACTIVE OXYGEN SPECIES
•
PKC - PROTEIN KINASE C
•
EC – ENDOTHELIAL CELL
•
VEGF- VASCULAR ENDOTHELIAL GROWTH FACTOR
•
MCHC- MEAN CORPUSCULAR HAEMOGLOBIN
CONCENTRATION
•
MCH- MEAN CORPUSCULAR HAEMOGLOBIN
•
RBC – RED BLOOD CELL
•
PS – PERIPHERAL SMEAR
•
RFT – RENAL FUNCTION TESTS
•
ATII- ANGIOTENSIN II
•
KW NODULE - KIMMELSTIEL-WILSON NODULE
•
ECM – EXTRACELLULAR MATRIX
•
CKD- CHRONIC KIDNEY DISEASE
•
GFR- GLOMERULAR FILTRATION RATE.
•
PDR- PROLIFERATIVE DIABETIC RETINOPATHY
•
NPDR- NON-PROLIFERATIVE DIABETIC RETINOPATHY
•
HB – HAEMOGLOBIN
•
HBA1C- GLYCATED HAEMOGLOBIN
•
CO
2-CARBON DIOXIDE
•
NH
3 –AMMONIA
•
ATP - ADENOSINE TRIPHOSPHATE
•
EGFR - ESTIMATED GLOMERULAR FILTRATION RATE
•
ACR - ALBUMIN:CREATININE RATIO (ACR)
•
SUPCR - SPOT URINE PROTEIN/CREATININE RATIO
•
FBS - FASTING BLOOD SUGAR
1
ABSTRACT
BACKGROUND: Diabetes Mellitus isone of the common risk factors for end organdamage.Altered metabolic state due to persistent hyperglycemia may produce
oxidative stress and membrane dysfunction of red cells which produce impact on
haemorrheologicalfactors to cause macrovascularand microvascular complications.
Many studies have provenan association between haematological alterations in
diabetic patients and vascular pathogenesis as well as haematocrit values and
insulinresistance. The aim of our study is to estimate the prevalence of red cell
morphology changes andtheir correlation with markersofmicrovascular complications
like Diabetic nephropathy and Diabetic Retinopathy.
MATERIALS AND METHODS: This was a descriptional and prospective study conductedat Government Mohan Kumaramangalam Medical college Hospital, Salem
during December2015 to June 2017. The sample size was 100 patients who were
recruited from DiabetologyDepartment and evaluated by taking a detailed
history,Clinical examination and laboratory investigations. Peripheral smear study ,
urine spot PCR and Fundus changes wereassessed in all patients.
INCLUSION CRITERIA:
1) Type 2 DM patients, 2) Age 30 to 60 years, 3) Both sex.
EXCLUSION CRITERIA:
1) Pregnancy and lactating women, 2) congenital haematological disorders, 3)
KnownHypertensives ,4) Known Haematological malignancy, 5) History of Blood
transfusionduring last 3 months, 6) Other systemic illness, 7) Patients on steroids,
2
RESULTS: In our study 69 patients out of 100 showed morphological changes in RBCs inthe form change in shape of RBCs like Target cells (codocytes), dacrocytes,
schizocytes, and other shapes aswell as in variations in size mostly in the form of
microcytes and hypochromia . 58 patientsshowed evidence of Diabetic Retinopathy
in the form of Dot blot haemorrhages, cotton wool spots, microaneurysms as well as
hard exudates in some of the patients. The multivariate statistical analysis show an
association between morphological changes of RBCs and presence of diabetic
nephropathy and diabetic retinopathy.The changes were mostlyobserved in patients
having diabetes of more than 5 years.
CONCLUSION : The results show that there were significant morphological alterations in Red cells of diabetic patients who also showed a significant evidence of
microalbuminuria and features of diabetic Retinopathy. The etiopathogenetic factor
could be the conformational changes in RBCs which may affect the flow properties at
capillary beds resulting in end organ damage. Hence our findings suggest the need for
routinescreening ofperipheral smear study in Type2 Diabetes Mellitus during clinical
assessment of microvascular complications.
3
APPENDIX I IA1.INTRODUCTION :
Diabetes Mellitus is one of the most prevalent metabolic disorders causing
remarkableMorbidity and Mortality globally. This disorder is characterised by
hyperglycemia due torelative or absolute deficiency of insulin and produces metabolic
alterations of carbohydrates, proteins and lipids in total. According to International
Diabetes federationdata, the diabetespopulation will increasefrom 1,94,000,000 in
2003 to 3,34,000,000 in 2025world wide. The effect of DM in general population is
quite remarkable due to long term complications like peripheral neuropathy ,Renal
failure, visual disturbances, infections,chronic foot ulcers leading to amputation,
cardiovascular complications and stroke. Hence often there is a need for new and
periodical research on diabetics to identify the various risk factors and pathogenetic
mechanisms so as to develop efficient therapeutic approaches to reduce the
complicationand social burden of this dreadful disorder, right from dietary
modification to novel insulin analogsand so on.
Erythrocytes , one of the most important components of the blood are very
crucial to human life, being the predominant oxygen carrier in body, the action which
necessitates them to travel through microcirculation, where they ought to face high
shear stress. Inorder to overcome the passage through small areas in capillaries, they
are made in a way to be highly deformable with the help of their unique disc shape
and strong resilient membrane. The plasma membrane and their cytoskeletal
framework is very important for maintaining the stability and shape of a RBC. Such
an erythrocytebeing continuously exposed to chronic hyperosmolar state due to
hyperglycemia is subjected to highly oxidative stress via lipid peroxidation which
4
membrane bound proteins further adds fuel to the fire of membrane damage.
Furthermore DM also produces a reduction in RBC membrane Na+K+
ATPaseactivity resulting in hemodynamic dysfunction.There is also sufficient
evidence in the literature showing haemorrheologicalalterationsin diabetes patients
due to increased erythrocyte aggregation and membrane dysfunction. All thesefactors
altogether produce impact on flow properties of RBC at individual and collection
level.Ultrastructural studies of RBCs through atomic force microscopy (AFM) and
Scanning ElectronMicroscopy(SEM) also confirm the damageproduced in the RBC
membrane resulting inerythrocyte changes in structure as well as in function. This
study was conducted withan primary objective to evaluate morphological alterations
in erythrocyte through simpleroutineperipheral smear studyand also to screen for
microvascularcomplications like Diabetic Nephropathyand Diabetic Retinopathy to
form a hypothesis for further research.
I A2. NEED FOR THE STUDY :
Diabetes mellitus is one of the leading causes of End Stage Renal Disease
(ESRD). It is responsible for 30-40 % of all ESRD. Although any type of Diabetes
Mellituslead to ESRD, Microalbuminuria is the earliest manifestation of diabetic
nephropathy and it is the predictor of developing nephropathy in diabetic
patients..Morphological alterations in RBCs is of latest interest as one of the risk
factors for the development of macro and microvascular complications of diabetes.
The current study was designed to investigate the role of Erythrocyte changes
in morphology as one of the risk factors in the development of microvascular
complications in Diabetics and to correlate the pathological and clinical relationship
between RBC morphology and diabetic nephropathy such as microalbuminuria and
5
IB.AIMS AND OBJECTIVES OF THE STUDY
PRIMARY OBJECTIVES :
1) To evaluate morphological variation of RBCs in Type2 Diabetes Mellitus.
2) To correlatemorphological variation in RBCs with micro vascular complications in
DiabetesMellitus.
SECONDARY OBJECTIVES :
1) To give an appropriate recommendation on the possible dangers of effect of
chronichyperglycemia on RBC parameters and its effect on markers of glycemic
control.
6
I C.REVIEW OF LITERATURE I C1.HISTORICAL REVIEW:
Ancient Egyptians were the first to recognise diabetes followed by, various
studiesto understand the florid manifestations of the disease,
etiopathogenesis,treatment and prevention modalities. The developmental research in
diabetes paved wayfor the understanding and management of the condition. The
overview of the milestones of diabetes, starting from the time immemorial to the
current generation helps to understandthe improvements that have been developed in
diabetes area and health. The first understanding of Diabetes Mellitus was dated back
in 1550 BC in the Egyptian literature, which was discovered by Georg Ebers in 1862,
Medical literature from 3000 BC, stated diabetes means ‘to regulate excessive
urine’which was found by Hesy-Ra, an Egyptian physician. in 1552 BC.The first
attempt at descriping the features of diabetes was described byAulus Cornelius
Celsus (30 BC-50 AD) of Greece (Medvei 1993, Southgate 1999, Zajac et al. 2010).In
230 BC Apollonius Memphites, an Egyptian physician used the prefix ‘diabetes’ for
the first time to indicate an excessive passage of urine and contributed its cause to the
kidney (Papaspyros 1964). In 500 BC, two Indian physiciansSushruta and Chakrat
felt that DM was not a single phenomenon, and they observed the sweetness of urine
from noting ofcongregation of ants around the urine of patients (Tattersall 2010).
Diabetes, is a Greek word meant to denote ‘ run through or siphon’ in the description
of incessant urination (Adams 1856), a word originally ascribed to Demetrios of
Apamaia in the 200-250 BC.Aretaeus of Cappadocia (81-138 AD), a Greek physician
re-introduced the prefix ‘diabetes’ to describe the wasting disease from excessive
7
In 200 AD, TchangTchong-King from China described the excessive eating
symptoms seen in these people with diabetes.
The triad of polyphagia, polydipsia, and polyuria was featured in the literature
as the characteristic symptoms of the diabetes (Lehrer 2006). Avicenna (980-1037),
an Arabian physician, in medieval Persia was the first to focus the clinical features
and some of the diabetic complications in his book ‘ Canon of Medicine’.The first
documented evidence of diabetes in English literature was the use of the
word‘diabete’, suspected to be written around 1425. These were the early evidences
found and no further progress was seen until the sixteenth century. Paracelsus
(1493-1541), a Swiss German physician, was tryinghis experimental research for the
etiopathogenesis of diabetes in the middle of the 16th century.
In 1682, 29 years old Johann Brunner (1653-1727), dida partial
pancreatectomy in a dog, and observed that the dog developed polydipsia, polyuria
and extreme thirst.This was the first attempt in the history of the recognition of the
role of pancreas in the pathogenesis of diabetes. Matthew Dobson in Liverpool (UK)
in 1776, tested the presence of sugar in blood as well as urine of diabetes patients. In
the later part of 18th century an Edinburgh-trained surgeon of the British Army,John
Rollo (1749-1809) added the suffix ‘ mellitus’ meaning honey, to denotethesweetness
of urine in 1798.
Type 2 DM (T2DM) was differentiated from severe acutely symptomatic
T1DM between 18th and 19th century by McGrew 1985.Justus Baron von Liebig
(1803-1873), a German chemist, described the biochemistry of protein, fat and
carbohydrate metabolism in the body andutilisation of these compoundsfor the growth
8
documented the associations of diabetes with the complicationsof the eye, such as
Diabetic retinopathy in 1869. Paul Langerhans, a German pathologist, had described
about the presence ofnew ‘heaps of cells’ in the histologyof pancreas, known as ‘islet
cells’ withinthe acini of the pancreas in his thesis in 1869.A German pathologist,
Julius Dreschfeldin 1886 described in details about the clinical features of Diabetic
ketoacidosis. The concept of insulin as a secretion from pancreatic islets was
highlighted by Jean De Meyer, Belgian physician in 1909.Novel scientific methods
lead to the discovery of insulin by Frederick Banting (1891-1941) and his colleagues
in Canada vizJohn Macleod (1876-1935), James Collip, and Charles Best
(1899-1978), in 1921 from an acid ethanol extract of pancreas from dogs.They isolated and
purified insulin, which was commerciallyavailable for the management of people with
diabetes. Their first trial was on Leonard Thompson, a 14 year old boy a T1DMwho
died after 13 years, in 1922 at the age of 27. Banting and MacLeod was honoured by
Nobel Prize in 1923 for their discovery.Commercial production of insulin was started
by Novo Nordisk Insulin Laboratory in 1923.John Abel; a biochemist isolated the first
crystalline insulin at the John Hopkins University in 1926.Frederick Sanger in 1955
described about insulin’s molecular structure of the amino acid sequence, and its
three-dimensional structure was enlightened, by Dorothy Hodgkin in 1969.The
guidelines for the diagnosis and definitions of various stages of hyperglycemia was
formulated by the American Diabetes Association in 2003 and the WHO in 2006, and
also recommended the use of glycosylated haemoglobin (HbA1C) as a diagnostic and
9
I C2 .EPIDEMIOLOGICAL REVIEW
Diabetes mellitus (DM) has been focussed as a ‘silent’ epidemic. Its can
manifest as a slow onset withgradual asymptomatic progression or sudden onset with
rapid progression leading to complications or coma. By the year 2030, an estimated
366-438 million approximately 7.8% of the world population will develop diabetes,
to an increase of 54% in contrast to that predicted in 2010 by Wild et al. 2004 and
Whiting et al. 2011.Diabetic nephropathy, especially due to Type 2 diabetes mellitus
(T2DM), is becoming the foremostcause ofend-stage renal disease (ESRD) globally,
while other causes are reducing.
Diabetes is recognised as the etiology in some countries for as many as half of
the cases requiring renal replacement therapy (RRT). Hence early prevention of
diabetic nephropathy in T2DM patients becomes mandatory. The ADVANCE study
has provided sufficient evidence that nephropathy can be prevented or even reversed
in patients with T2DM. After a median 5-year followup, in the intensive glucose
control group (mean HbA1c level 6.5 % vs7.3 % in control group), risk of ESRD was
reduced by 65 %, microalbuminuria by 9 %, and macroproteinuria by 30 %. Even
more suggestive is, five years after the last visit or cessation of intensive treatment,
this marked reduction in the risk of ESRD, as defined by the need for dialysis or renal
transplant, was maintained (46 %) in those patients originally achievingHbA1c to 6.5
%.In conclusion, while a diagnosis of nephropathy was only documented in the
medical records of less than 25 % of diabetic patients regularly followed in primary
care centres, about 70 % of them presented with some sign of chronic kidney disease,
and nearlyhalf of the whole population had tell tale signs of significant chronic kidney
10
every diabetic patient at the time of the annual visit by measuring albuminuria and
eGFR. Evidence is available in the literature that intensive control of both
hyperglycemia and hypertension are effective inpreventing and progression of serious
kidney disease, with a reversal.
In India, The Chennai Urban Rural Epidemiology Study (CURES) reported an
overall Diabetic Retinopathy (DR) prevalence of 17.6% (confidence interval [95%
CI]) in the diabetic population. Recently, the SankaraNethralaya DR Epidemiology
and Molecular Genetic Study has estimated a rural prevalence of 10.3% (95% CI:
8.53–11.97%) andurban prevalence of 18.0% (95% CI: 16.0–20.1) of DR in South
India. Similar to this, Aravind Comprehensive Eye Study has reported 10.5%
prevalence of DR (in self-reported subjects with diabetes) in the rural South Indian
population. A DR prevalence of 21.2% has been reported by Chawla et al. in their
cohort of North Indian patients. This study alsofound a significant association
between HbA1c, body mass index, duration of diabetes and microalbuminuria in the
development of DR (P = 0.001).Proteinuria occurs in 15–40% of patients with type 1
diabetes while it ranges from 5 to 20% in patients with T2DM. According to the
European Diabetes Prospective Complications Study, the cumulative incidence of
microalbuminuria was 12.6% over 7.3 years in patients with T1DM. However, 18
years follow-up study from Denmark reported a prevalence rate of 33% in the T1DM
population. Similarly, in the (UKPDS), T2DM patients showed a 2.0% incidence of
microalbuminuria per year, which reached up to 25% in 10 years postdiagnosis. The
prevalence of diabetic nephropathy was higher in Americans, Asians, than
Caucasians. In India, CURES 45 reported a prevalence of 2.2% for overt diabetic
11
I D1.DEFINITION
Diabetes mellitus is not a single disease entity but rather a group of metabolic
disorders sharing the common underlying feature of hyperglycemia. Chronic
hyperglycemia and attendant metabolic dysregulation of diabetes mellitus may be
associated with secondary damage in multiple organ systems, especially kidneys,
eyes, nerves and blood vessels.(3)
Diabetes mellitus tends to run in families. It is associated with dyslipidemia,
atherosclerosis and predispose to specificmicrovascular abnormality including
retinopathy, nephropathy and neuropathy. It increases the risk of stroke, myocardial
infarction, peripheral vascular diseases. It also decreases the resistance to infection,
causes delayed wound healing especially if diabetes is poorly controlled.
[image:33.595.109.442.464.688.2]I D2.CRITERIA FOR DIABETES:
12
I D3.CLASSIFICATION OF DIABETES MELLITUS
1) Type 1 Diabetes mellitus (Insulin dependent diabetes mellitus)
Type 1 Diabetes mellitus is due to absolute deficiency of insulin caused by an
autoimmune attack on the β cells of the pancreas and its progressive
destruction.
It is sub classified as
A) Immune mediated
B) Idiopathic
2) Type 2 Diabetes mellitus (Non insulin dependent diabetes mellitus)
It is due to insulin resistance and dysfunctional β cells. It is further classified
as
a) Obese
b) Non-obese
c) Maturity onset diabetes of young
3)Diabetes Prone Status
a) Gestational diabetes mellitus
b) Impaired glucose tolerance (IGT)
c) Impaired fasting hyperglycemia (IFG)
4) Secondary to other known causes
a) Endocrinopathies : Cushing’s disease, Thyrotoxicosis, Acromegaly
b) Drug induced : Pentamidine, Nicotinic acid, GlucocorticoidsBeta
13
c) Diseases of exocrine pancreas: Pancreatitis, Pancreatectomy, Neoplasia,
Cystic fibrosis, Hemochromatosis
d) Infections: Congenital Rubella, Coxsackies, Cytomegalovirus
e) Uncommon forms of immune mediated diabetes
- Stiff man syndrome
- Anti insulin receptor antibodies
f) Genetic syndrome associated with diabetes mellitus
- Down’s syndrome
- Turner’s Syndrome
- Klinefelter’s Syndrome
-Wolfram Syndrome
14
I D4.METABOLIC DERANGEMENTS IN DIABETES MELLITUS CARBOHYDRATE METABOLISM
Insulin is a hypoglycemic hormone which lowers blood glucose level by
promoting utilization and storage of glucose. It stimulates glycolysis and inhibits
gluconeogenesis glycogenolysis. In diabetes mellitus the release of insulin and the
cellular response to insulin are decreased which leads to inhibition of glycolysis and
stimulation of gluconeogenesis and glycogenolysis resulting in hyperglycemia.
LIPID METABOLISM
Normally insulin inhibits lipolysis which is evidenced by fall in circulating
plasma free fatty acid levels. It enhances lipogenesis and the synthesis of
triacylglycerols by providing more acetyl CoA and NADPH. The principle action of
insulin in adipose tissue is to inhibit the activity of hormone sensitive lipase reducing
the release not only of free fatty acid but also of glycerol.
In diabetes mellitus, due to insulin deficiency there is increased lipolysis with
increased plasma free fatty acids. This causes increased uptake and oxidation of free
fatty acid, releasing more of acetyl CoA. The acetyl CoA cannot be completely
oxidized in TCA cycle, as the availability of oxaloacetate is limited. Hence excess of
acetyl CoA is diverted to ketogenesis causing Ketonemia and Ketosis.
PROTEIN METABOLISM
Insulin is an anabolic hormone. It stimulates entry of amino acids into the
cells, enhances protein synthesis and reduces protein degradation. In diabetes mellitus
there will be absence of anabolic effects of insulin which leads to increased
catabolism of proteins and amino acids providing substrates for gluconeogenesis. This
15
I D5.MICROVASCULAR COMPLICATIONS:
The following are the microvascular complications of DM
1.Diabetic Retinopathy
2.Diabetic Nephropathy
[image:37.595.110.451.243.490.2]3.peripheral Neuropathy
FIG 2: MICROVASCULAR COMPLICATIONS :
PATHOGENESIS OF MICROVASCULAR COMPLICATIONS :
Microvessels are the basic functional unit of the cardiovascular system
comprising of arterioles, capillaries, and venules. The Microcirculation has
regulatory systems controlling vascular permeability and myogenic responses that can
adapt blood flow according to local metabolic needs. Diabetes induces
pathognomonic changes in the microvasculature, affecting the capillary basement
membrane including arterioles in the glomeruli, retina, myocardium, skin, and
muscle, by increasing their thickness, leading to the development of diabetic
16
microangiopathyinvolve generation of reactive oxygen species (ROS), accumulation
of Advanced glycation end products (AGE), and activation of intracellular signaling
molecules such as protein kinase C (PKC) .
1) AGEs are a heterogeneous group of molecules formed by the
nonenzymaticglycation of plasma proteins causing a disruption in their normal
functioning by altering their molecular conformation, disrupting enzyme activity, and
interfering with receptor functioning. AGEs
crosslink with plasma membrane-localized receptors for AGEs (RAGE) leading to
up-regulation of transcription factors such as nuclear factor-κB and its target genes,
release of pro-inflammatory molecules and free radicals. AGEs block nitric oxide
activity in the endothelium and cause the production of ROS. AGEs modify LDL
particles and together with vascular damage accelerate atherosclerosis .
2) Oxidative stress, caused by the overproduction of ROS plays an important role in
the activation of other pathogenic pathways involved in diabetic complications,
including elevated polyol pathway activity, nonenzymaticglycation, and PKC levels
which in turn lead to the development of micro and macrovascularcomplications . It
also inactivates two critical anti-atherosclerotic enzymes, endothelial nitric oxide
synthase, and prostacyclin synthase.
3) Inflammation has been recognized as one of the potent risk factors in both
atherosclerosis and T2DM. Vascular cells encounter many early pathologic changes
in response to hyperglycemia, causing a loss of nonadhesive property and adhesion of
monocyte to ECs, which is an early step in atherogenesis.
4) The proliferation of vasa vasorum, which is termed as neovascularisation is
associated with increased plaque burden, which subsequently promotes
17
microvascularcomplications by increasing the vascular permeability to
macromolecules, monocyte chemotaxis, and tissue factor production. This particularly
[image:39.595.109.398.204.550.2]leads to pathogenesis of Diabetic Retinopathy.
FIG 3: PATHOGENESIS OF DIABETIC MICROANGIOPATHY
I D6.ROLE OF RBCs :
Erythrocyte deformability or the ability of the red blood cell (RBCs) to change
its shape under applied stress is an important function of the erythrocyte. In the
microcirculation, the capillary diameter ranges between 2 to 10 μm, whereas the
average diameter of RBCs is 7.5 μm. Deformability allows RBCs to pass through the
smaller vessels in the circulation while maintaining its normal function. The
18
capillaries that are as small as approximately 3 μm. The erythrocytes are enabled to do
so by their geometry, the cytoplasmic viscosity due to the presence of haemoglobin
(represented by MCHC) and viscoelasticity of the cell membrane.
It is widely believed and observed that all of these factors undergo a certain alteration
in various pathophysiological conditions resulting in the RBC becoming more rigid
and less deformable.Hyperglycemia has several effects on RBCs, besides formation of
glycatedhemoglobin, it leads to reduced deformability, changes in mechanical
properties of RBCs, increased adhesion, and increased osmotic fragility, leading to
changes in erythrocyte structure and hemodynamic characteristics.Hyperglycemia
reduces RBC life span, leading to high variability of the RBC volumes. Peterson et al
has mentioned reduced average life span of RBCs in diabetic patients. This was also
demonstrated by Emilia who showed that an extracellular oxidative stress can be
responsible for erythrocyte 3 activation in type 2 diabetes. Activated
caspase-3 impairs the maintenance of erythrocyte shape and function, thus contributing to the
shortened life span of RBCs.
19
Rigid RBCs are postulated to damage the endothelium of microcirculation causing
endothelial dysfunction and microangiopathy.RBCs alteration in structure leads to
increased aggregability, which favours platelet adherence and thrombus formation
leading to occlusionof microvessels. Deformability of RBCs also have antioxidant
properties, which is also affected resulting in premature destruction of RBCs
itself.Impaired red blood cell deformability correlates with development and severity
of diabetic microangiopathy.Also there is a hypothesis in literature stating a low level
of Ascorbate in RBC of chronic diabetics, resulting in a reduced deformability and
[image:41.595.115.397.348.554.2]increased rigidity accelerating the process of vascular damage.
FIG 5 : ASCORBATE IN RBC OF DIABETICS
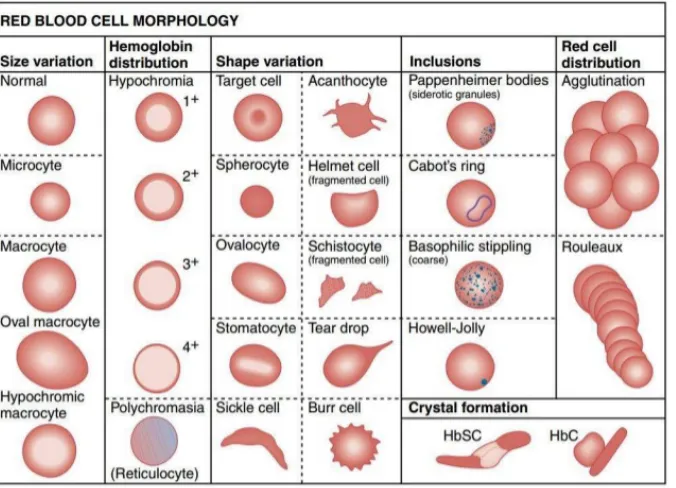
MORPHOLOGY OF RBCS:
Red blood cells are the major cellular component of blood. Mature red blood cells
arebiconcave disc shaped , which lack nucleus and most cell organelles such as
lysomes,mitochondria , and endoplasmic reticulum . However, variability of
abnormal morphologyof erythrocyte is found in variety of pathological conditions in
the form of
20 2) Poikilocytosis: Variation in shape
3) Variation in color
4) Presence of inclusion bodies
FIG 6 :NORMAL MORPHOLOGY OF PS
ANISOCYTOSIS (variation in size of RBCs):
Variation in size of RBC is called Anisocytosis. The normal size of RBC is
7.2micrometer in diameter. Nucleus of small lymphocyte is used to compare with the
size of RBC, while assessing during PS. Anisocytosis is divided into Macrocytosis
and Microcytosis.
1. Microcytosis: RBCs, which are smaller than the normal size are considered as microcytes. Microcytosis is seen in : Iron deficiency anemia, thalassemia,
sideroblasticanemia,lead poisoning and anemia of chronic disorders.
2. Macrocytosis: RBCs, which are larger than the normal size are considered as macrocytes. Macrocytosis is seen in :Megaloblasticanemia,Liver diseases,
hypothyroidism, and post splenectomy.
GRADING OF ANISOCYTOSIS
21 1+ = 10-25%
2+ = 25-50%
3+ = 50-75%
4 + = > 75%
FIG 7 : PS OF MICROCYTOSISFIG 8 : PS OF MACROCYTOSIS
POIKILOCYTOSIS ( Variation in shape of RBCs)
Variation in the shape of RBC is called poikilocytosis. RBCs present as biconcave
discs in large blood vessels but their shape changes to parachute like confirmation in
capillaries. Following are some abnormal shapes of RBCs :
Spherocytes: RBC becomes more spherical, no central pallor is seen with increased hemoglobin content.
22
FIG 9: SPHEROCYTES FIG 10 :STOMATOCYTES
Ovalocytes: Oval shaped RBCs.
Elliptocytes: The RBCs are elliptical or oval in shape, long axis is twice the short axis.
Teardrop cells: RBCs appear like teardrop . These are usually microcytic and hypochromic
FIG 11: ELLIPTOCYTES FIG 12 : TEAR DROP RBCS
Target cells: Red cells look like carrom coin like appearance , which have an area of increased staining in the area of central pallor.
Sickle cells: These are sickle-shaped Red Blood Cells.
23
Keratocytes: These are half-moon shaped cells with two or more spicules.
Schistocytes: These are fragmented, triangular or distorted RBCs, smaller than normal size.
FIG 15 : KERATOCYTES FIG 16 : SCHISTOCYTE
Burr cells or Echinocyte : Red cells have uniformly spaced with rounded projections on their surface .
Acanthocytes or Spur cells : RBCs have irregularly spaced projections, with thorny appearance.
.
FIG 17: BURR CELL FIG 18 : SPUR CELL
Red cell agglutinate: These are irregular clumps of RBCs.
Rouleaux Formation: Stacks of RBCs resembling a stack of coins.
GRADING OF ROULEAUX
1+ 2+ 3+ 4+
24
FIG 19 : RED CELL AGGLUTINATE FIG 20 : RBC ROULEAUX
GRADING OF POIKILOCYTOSIS
TABLE 2 : GRADING OF POIKILOCYTOSIS
Abnormality Slight 1+ 2+ 3+ 4+
Echinocyte or Burr Cell (Crenated RBC)
<1 1-3 4-5 >5
Codocyte (target cell)
1-2 3-4 5-7 ≥8
Schistocyte or schizocyte (cell
fragment)
<1 1-3 4-5 >5
HELMET CELL (bite
cell)
<1 1-3 4-5 >5
Drepanocyte (Sickle cell)
<1 1-3 4-5 >5
Dacryocyte (Tear drop cell)
<1 1-3 4-5 >5
Stomatocyte <1 1-3 4-5 >5
Acanthocyte (spur cell)
<1 1-3 4-5 >5
Elliptocyte or Ovalocyte
2 3-4 5-7 >8
Spherocyte 2 3-4 5-7 >8
25
VARIATION IN COLOUR OF RBCs
RBCs which appear as disc shaped and possessing an area of central pallor which
occupies approximately one-third of the cell’s diameter (containing normal amount of
hemoglobin) are considered as normochromic RBCs.
Hypochromic : RBCs which have an area of pallor more than one-third of the cell’s diameter are called hypochromic. This condition is seen in most commonly observed
inIron deficiency anemia, thalassemia, anemia of chronic diseases.
HYPOCHROMIA CRITERIA: Central pallor > 3 micrometer
HYPOCHROMIA GRADING :
1+ : One half of diameter
2+: Two third of diameter
3+ : Three quarter of diameter
4+ : Thin rim of Hb
26
[image:48.595.113.451.118.362.2]FIG 22 :DIAGRAMMATIC REPRESENTATION OF RED CELL MORPHOLOGY VARIATION
FIG 23 : FREQUENCY OF VARIATION IN RBC MORPHOLOGY IN DIABETICS
I D7.DIABETIC NEPHROPATHY
Diabetic nephropathy is a clinical syndrome characterized as a triad of :
• Progressive decline in the glomerular filtration rate (GFR)
• Persistent albuminuria (>300 mg/d or >200 μg/min) that is present on at least 2
occasions 3-6 months apart
27
FIG 24 : CLINICAL TRIAD OF DN
In diabetic nephropathy, the activation of the local renin- angiotensin
system ATII) contributes to the progression of diabetic nephropathy. ATII selectively
constricts the efferent arteriole in the glomerulus, resulting in higher intraglomerular
capillary pressures. In addition to its hemodynamic effects, ATII, through its ATII
type 1 receptors, promotes renal growth and fibrosisby upregulating TGF-β and other
growth factors. Genetic factors also play a role in the predisposition to diabetic
nephropathy among family members who have DN.
Histologically the term diabetic nephropathy is applied to the conglomerate of
morphological lesions that are often observed in the diabetic kidney, which include
A) Capillary basement membrane thickeningearliest morphologic abnormality in
diabetic nephropathy is the thickening of the GBM
B) Diffuse mesangial sclerosis - mesangial expansion is directly promoted by
hyperglycemia, through increased matrix production or glycation of matrix proteins.
C)Nodular glomerulosclerosis(Kimmelstiel-Wilson disease glomerular sclerosis is
producedby intraglomerular hypertension (caused by dilatation of the afferent renal
28
supplying the glomeruli).The key change in diabetic glomerulopathy is the augmented
deposition of extracellular matrix. (ECM) The severity of diabetic glomerulopathy is
estimated by the thickness of the peripheral basement membrane and mesangium and
matrix expressed as a fraction of appropriate spaces (eg, volume fraction of
mesangium/glomerulus, matrix/mesangium, or matrix/glomerulus).Imaging of
kidneys are usually normal or increased in size initially, thus distinguishing diabetic
nephropathy from most other forms of chronic renal insufficiency, wherein renal size
is reduced (except renal amyloidosis and polycystic kidney disease).
FIG 25 :HISTOLOGY OF NORMAL GLOMERULUS VS DN
FIG 26 : HISTOLOGY OF HYALINE ARTERIOLE AND KW NODULE
29
Diabetic nephropathy, leading cause of ESRD remains a major cause of morbidity and
mortality for persons with either type 1 or type 2 DM. Nephropathy progress with
microalbuminuria through proteinuria, azotemia and culminating in end stage renal
disease.
I D8.DIABETIC RETINOPATHY:
Diabetic retinopathyoccurs in up to 80 percent of people in patients having diabetes
for long duration.DR occurs due to progressive alterations in the retinal
microvasculature leading to thickening of the retinal microvascular basement
membrane,capillary occlusion,vascularhyperpermeability, and leakage of proteins
30
STAGES:
1) NON-PROLIFERATIVE DIABETIC RETINOPATHY
In the initial stages which is known as non-proliferative diabetic retinopathy (NPDR)
ofdiabetic retinopathy, patients are generally asymptomatic.Signs of diabetic
retinopathy include the following:
A)Microaneurysms: These are microscopic blood-filled bulges in the artery walls ,
which are the earliest clinical sign of diabetic retinopathy;
B)Dot and blot hemorrhages: similar to microaneurysms in the deeper layers of the
retina.
C)Flame-shaped hemorrhages: Splinter hemorrhagesoccuring in more superficial
nervefiber layer
D)Cotton-wool spots: Nerve fiber layer infarctions that occur due to occlusion of
precapillary arterioles;
E)Hard exudates: formeddue to breakdown of the blood-retina barrier, causing
leakage of serum lipids, and protein from the vessels.
31
TYPES:
Mild: presence of at least 1 microaneurysm
Moderate: presence of hemorrhages, microaneurysms, and hard exudates
Severe (4-2-1): Characterized by microaneurysms and hemorrhages in 4 quadrants,
venous beading in 2 quadrants and intraretinalmicrovascular abnormalities in 1
quadrant.
2)PROLIFERATIVE DIABETIC RETINOPATHY
In the second stage, abnormal new blood vessels (neovascularisation) form at the back
of the eye as part of proliferative diabetic retinopathy (PDR); these can burst and
bleed (vitreous hemorrhage) and blur the vision, because these new blood vessels are
fragile.
FIG 28: STAGES OF DIABETIC RETINOPATHY
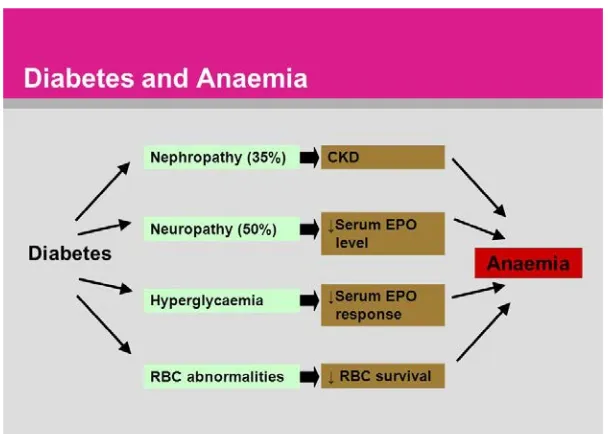
I D9.ANEMIA IN DIABETES:
Anemia is used to denote less than normal levels of red blood cells or hemoglobin in the blood for the age and sex of the patient.
Normal hemoglobin values are related to the person's age and sex.
• Female: Age >18 years: 12.1 to 15.1 g/dl (mean 14.0 g/dl)
• Male : Age >18 years: 13.6 to 17.7 g/dl (mean 15.5 g/dl)
People with diabetes are more prone for developing anemia because of the
32
essential for RBCs production and survival. As kidneys get affected they secrete less
of it. Without this ingredient, the body is unable to produce sufficient red blood cells.
Another way is because of the inflammation DN causes Anemia. 50% of people with
chronic kidney disease have associated iron deficiency.Drugs that are given for
diabetes, such as Metformin, can cause absorption problems with B-12. One study
showed that using Metformin for 12 to 15 years causes Vitamin B-12 deficiencies in
about 30% of the people that cause macrocytic anemia. Neuropathy alters the body
[image:54.595.108.413.344.561.2]metabolism to make enough red blood cells.
33
FIG 30: PATHOGENESIS OF ANEMIA IN DIABETES
I E1.GLYCATED HEMOGLOBLIN
It is used as the best index for long term control of blood glucose level. When
there is hyperglycemia, proteins in the body undergo Glycation, whichis a non
enzymatic process where the glucose after entering RBC forms a Schiff’s base with N
terminal amino group of protein by an aldimine linkage which changes to a ketamine
linkage by an irreversible Amadori rearrangement. The attachment of the hexose
molecule proceeds over the entire life span of the RBC and depends on
concentration and the duration of exposure of the erythrocyte to blood glucose. Hence
HbA1c level predicts the mean glucose concentration over the previous period of 8-12
weeks, and is an useful indicator of long-term glycemic control than blood and
urinary glucose determinations. The risk of diabetic microvascularcomplications are
34
ADVANTAGES:
No need for fasting
A single test may be used both for diagnosing and monitoring diabetes
Intraindividual variability is very low (critical value of <2%)
REFERENCE RANGE
Normal :4.0-5.6%
Increased risk for diabetes (prediabetes): 5.7-6.4%
Diabetes: > or =6.5%
The ADA recommends monitoting of HbA1c levels 2 times per year for
well-controlled type 2 diabetic patients and 3-4 times per year for poorly well-controlled type 2
diabetics and type 1 DM to achieve blood glucose within the target range.
I E2.BLOOD SUGAR:
FASTING BLOOD GLUCOSE
Fasting Blood Glucose indicates the body’s inherent capacity to clear glucose
and reflects one’s basal metabolism. FBS is used for screening people who are at risk
of developing diabetes. Fasting for minimum 8 hoursovernightis required before the
blood is being tested.
REFERENCE RANGE:
A fasting blood sugar level less than 100 mg/dL(5.6 mmol/L) is normal.
A fasting blood sugar level from 100 to 125 mg/dL(5.6 to 6.9 mmol/L) is considered
prediabetes.
If it's 126 mg/dL (7 mmol/L) or higher on two separate occasions, It indicates
35
POSTPRANDIAL BLOOD GLUCOSE
Post-prandial is the blood sugar after any meal, which reflects insulin
sensitivity. Blood is drawn at 2 hrs after ingestion of the meal or glucose load. Two
post prandial tests with glucose levels of 200 mg/dl or higher at 2 hours are suggestive
of diabetes.
I E3. RENAL PARAMETERS BLOOD UREA
Urea, also known as carbamide, is an organic compound with the chemical
formula CO(NH2)2 Ammonia (NH3) is produced in the body as aby product of the
metabolism of nitrogenous compounds. Urea is produced in the liver by combining
two ammonia molecules (NH3) with a carbon dioxide (CO2) molecule in the urea cycle and excreted by the kidney via urine. Measurement of serum urea has been
widely used as a marker of kidney function.
Normal range of Blood urea is 20-40 mg/dl. (4)
SERUM CREATININE :
Creatinine is a byproduct of muscle metabolism producedfrom enzymatic
reaction involving creatine, phosphocreatine (also known as creatine phosphate),
and adenosine triphosphate(ATP, the body's immediate energy supply) .Creatinine
isexcreted from the blood mainly by the kidneys, unchanged primarily by glomerular
filtration, but also by proximal tubular secretion. Little or no tubular reabsorption of
creatinine occurs. Every day, 1-2% of muscle creatine is converted to creatinine. Men
usually have higher levels of creatinine than women because, of greater muscle mass.
serumcreatinine is a commonly done test, as an indicator of renal function. Also used
36
collection and some variables like age, sex, weight, and race, as proposed by
the American Diabetes Association.
REFERENCE RANGE
0.5 to 1.0 mg/dL(about 45-90 μmol/L) for women
0.7 to 1.2 mg/dL(60-110 μmol/L) for men.
I E4.MICROALBUMINURIA
Microalbuminuria is defined as an urinary albumin excretion of 30-300 mg/day, or
20-200 µg/min,which is due toglomerular capillary injury and indicates diffuse
endothelial dysfunction . Albumin molecule is relatively small and it is often the first
protein to enter the urine after the kidney is damaged. It is a marker of earlier sign of
vascular dysfunction in patients with diabetes, which develops in 2 to 5 percent of
patients per year .Increased albuminuria serves as an indicator of insulin resistance
and is a predictor of worse outcomes like renal and cardiovascular risk associated
with the metabolic syndrome. Hencescreening for albuminuria is quite significant for
early identification of at risk subjects.Only negligible amounts of albuminuria below
approximately 2mg/ day is considered as 'normal . Dipstick for albuminuria is easy
37
FIG 31: REAGENT STRIP TEST FOR URINE PROTEIN
Normoalbuminuria: < 30 mg/24 hrs or<20 µg/min
Microalbuminuria : 30-300 mg/24 hrs or 20-200 µg/min
Macroalbuminuria :>300 mg/24 hrs or >200 µg/min
URINE SPOT PCR:
The reason for increased incidence of microalbuminuria in diabetic nephropathy is
the result of widespread endothelial dysfunction arising from the effects of cytokines
and other inflammatory mediators, released during the intense inflammatory
responses that are associated with critical illnesses. The effects of disruption of the
integrity of the endothelial barriers is manifested as altered glomerular endothelial
permeability in the kidneys, allowing increased amounts of albumin to escape into the
glomerular ultrafiltrate. The tubular reabsorptive mechanism for albumin from the
ultrafiltrate is exceeded beyond its threshold capacity, leading to increased excretion
38
with many reportsdocumenting poor compliance. This further adds fuel to the fire ofthis
expensive procedure.
Also 24-h collection is altered by the variation in protein excretion throughout
the day, Because the excretion of creatinine and protein is significantly constant
throughout the day some have recommended the use of a ratio measurement of
protein to creatinine in urine samples collected over shorter time periods, or even
random (or “spot”) urine samples.
Newman et al. proposed that variations in protein and albumin excretion in
urine samples collected throughout the day are much less when their concentrations
are expressed as a ratio to creatinine or specific gravity. Hence the spot urine
protein/creatinine ratio (SUPCR) has increasingly replaced the 24-h urine proteinuria
estimation.Urine ALBUMIN:CREATININE RATIO (ACR) in preference, as has
greater sensitivity than PCR for low levels of proteinuria.
REFERENCE VALUE:
<15 mg/mmolCreatinine = Normal
15 – 49 mg/mmolCreatinine = Trace Proteinuria..
50 – 99 mg/mmolCreatinine = Significant proteinuria.
100 – 300 mg/mmolCreatinine = High proteinuria.
39
40
APPENDIX-II
MATERIALS AND METHODS
This study was done at Government Mohan Kumaramangalam Medical college
Hospital, salem during a period between December 2015 to May 2017. This is a
Prospective and observational study with a sample size of 100 patients.
II A.SOURCE OF DATA
The study population was selected among the diabetic patients admitted in the
department of general medicine, also from diabetic patients who attended diabetology
outpatient department, Non communicable disease outpatient department and clinical
pathology department at Government Mohan Kumaramangalam Medical college
Hospital, Salem.
II B.METHOD OF COLLECTION OF DATA
In this study 100 subjects wereselected based on inclusion and exclusion criteria.
Patients were evaluated by taking a detailed history, clinical examination and
laboratory investigations. A detailed proforma was specially formulated for data
collection.Their diabetic status was confirmed as perADA criteria for diabetes.
Consent was taken from each subject .Required laboratory investigations were done
and the patients were subjected to Fundus examination and andthefindings were noted
with the help of ophthalmologist.
Final results were studied and correlated.
INCLUSION CRITERIA :
1. Age 30 to 60 yrs
2. Both Sex
41
EXCLUSION CRITERIA :
1. Pregnancy and lactating women
2. Congenital hematological Disorders
3.Knownhematological malignancy
4.History of blood transfusion during last 3 months
5.Other systemic illness
6.Hypertension
7.Patients on steroids, antiplatelet drugs and haematinics.
All the patients were subjected to the following investigations
II.C.LABORATORY INVESTIGATIONS IN DIABETIC NEPHROPATHY
Patients were asked to report to the clinical pathology laboratory after overnight
fasting for 10 to 12 hours. The following next morning blood samples were collected
by venepuncturemethod under strict aseptic precaution and following tests were
carried out such as
FBS
PPBS
HBA1C
RBC COUNT
HB
HAEMATOCRIT
PERIPHERAL SMEAR:
URINE ANALYSIS: ALBUMIN,SUGAR, DEPOSITS
SPOT URINE PCR:
42
Again blood sample was collected from the same patient at 2 hrs after meal for post
prandial sugar level (PPBS) estimation.Peripheral smear was prepared and report was
done by the Pathologist. Early morning Urine sample was also collected for which
routine urine analysis of Albumin, sugar , deposits and Urine Spot PCR
II.D.SAMPLE COLLECTION
10ml of blood was drawn under aseptic precautions and divided into 4 test tubes, marked as 1, 2, 3 and 4.
1. Test tube 1 Contains 2 ml of blood with anticoagulant, which is used for
estimation of FBS ( Glucose oxidase method )
2. Test tube 2 contains 4 ml of blood with no anticoagulant that is allowed to clot
and serum is separated. Serum is used for measurement of
a) Blood Urea – ( Glutamate dehydrogenase– Urease method )
b) Serum creatinine( Jaffe’s method )
3. Test tube 3 contains whole blood that is used for estimation of glycated
hemoglobin (Ion exchange Resin method )
4. Test tube 4 contains 2 ml of blood which will be collected with anticoagulant
after 2hrs of meals, which is used for estimation of PPBS.
URINANALYSIS
Early morning midstream urine samples (10ml) were collected in a sterile container
without preservative and tested for microalbuminby urine Dipstick method.
II.D1.URINE SPOT PCR
SUITABLE SPECIMEN TYPES
Plain Spot Urine
43 PATIENT PREPARATION
Early morning urine sample preferable
FORMULA:
The urine protein:creatinine ratio is calculated as follows:
(Urine protein(g/L) X 1000)/Urine creatinine(mmol/L)
FIG 32: STERILE URINE CONTAINER
II D2.PERIPHERAL SMEAR PROCEDURE
Two clean glass slides are selected.To make a smear the blood drop should be placed
in the center line approximately 1/4 inch from the frosted edge of the slide. The
spreader slide is kept at a 30° angle just in front of the drop of blood is drawn
backwards until it just touches the drop of blood. And allowed to spread in the angle
between the slide and the spreader.The spreader slide is pushed rapidly across the
stationary slide with one even stroke and pressure, avoiding any jerky movements and
44
FIG: 33 BLOOD SMEAR PREPARATION
The staining technique used was Leishmann’s technique.
FIG 34 : STAINING PROCEDURE OF BLOOD SMEAR
The microscopic examination was done initially with the objective of 10×/20× to
assess the staining and cellular distribution followed subsequently by the examination
of the smear withan objective of 100× immersion, with evaluation of each cell type
45
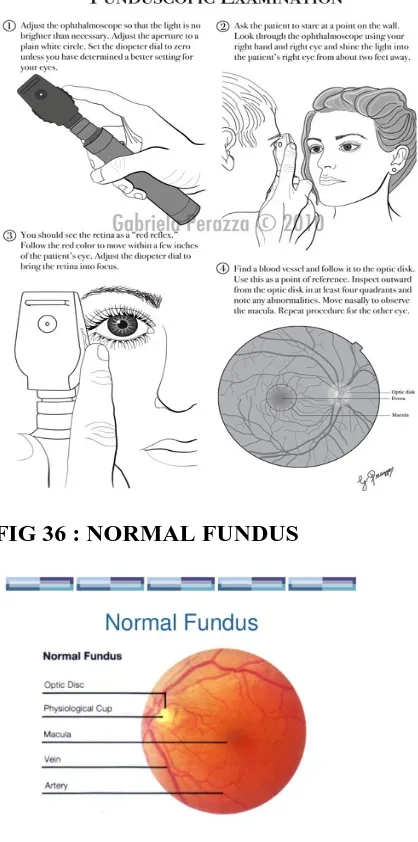
II D3.FUNDUSCOPIC EXAMINATION
Ophthalmoscopy, otherwise known as funduscopy, is an eye examination and
carried out as a part of a routine physical examination. It is done to evaluate
symptoms of various retinal vascular diseases of eye. Regular ophthalmoscopic
examinations (once in every 6 months to 1 year) are recommended to screen
for diabetic retinopathy as visual defects due to diabetes can be diagnosed and treated
at the earliest.
[image:67.595.111.320.321.742.2]FIG 35 : FUNDUSCOPIC EXAMINATION
46
APPENDIX III - STATISTICAL ANALYSIS
III A.RESULTS
Our study is a prospective and descriptional study of erythrocyte morphological
[image:68.595.106.473.411.628.2]variations and its relation to microvascular complications in Type2 DiabetesMellitus.
TABLE 5 : SEX DISTRIBUTION IN STUDY GROUP
Sex Frequency Percent
Male 49 49
Female 51 51
Total 100 100
CHART 1 : PIE DIAGRAM SHOWING SEX DISTRIBUTION
In our study 51% are females and 49% are males.
51% 49%
Gender
47
TABLE 6: AGE DISTRIBUTION IN THE STUDY POPULATION
Frequency Percent Valid
Percent
Cumulative Percent Valid Upto
40 yrs
5 5.0 5.0 5.0
41 - 45 yrs
12 12.0 12.0 17.0
46 - 50 yrs
20 20.0 20.0 37.0
51 - 55 yrs
25 25.0 25.0 62.0
Above 55 yrs
38 38.0 38.0 100.0
Total 100 100.0 100.0
CHART 2 : BAR DIAGRAM SHOWING AGE DISTRIBUTION OF THE STUDY POPULATION
Most of the patients in our study group are above 50 yrs contributing about
63% of study participants.
0 5 10 15 20 25 30 35 40
Upto 40 yrs 41 - 45 yrs 46 - 50 yrs 51 - 55 yrs Above 55
48
TABLE 7 : MEAN AGE OF THE STUDY POPULATION
N Minimum Maximum Mean SD
Age 100 37 60 52.65 6.31
The lowest age was 37 years and the maximum age was 60 years. The mean age
group was 52.65%.
TABLE 8: DURATION OF DIABETES IN THE STUDY POPULATION
Frequency Percent
Valid Percent
Cumulative Percent
Valid 2 1 1.0 1.0 1.0
3 4 4.0 4.0 5.0
4 12 12.0 12.0 17.0
5 24 24.0 24.0 41.0
6 37 37.0 37.0 78.0
7 17 17.0 17.0 95.0
8 2 2.0 2.0 97.0
9 3 3.0 3.0 100.0
Total 100 100.0 100.0
TABLE 9: MEAN DURATION OF DIABETES
Peripheral Smear N Mean SD t p
Duration Present 69 5.72 1.32 0.747 0.457
Absent 31 5.52 1.23
The mean duration of diabetes with morphological changes of RBC in peripheral
smear was 5.72 years and the mean duration without changes was 5.52 years and
49
CHART 3: MEAN DURATION OF DIABETES
TABLE 10 : FREQUENCY DISTRIBUTION OF FBS
Frequency Percent
Valid Percent
Cumulative Percent Valid Glycemic
control
34 34.0 34.0 34.0
Uncontrol 66 66.0 66.0 66.0
[image:71.595.112.516.96.378.2]Total 100 100.0 100.0 100.0
TABLE 11: FREQUENCY DISTRIBUTION OF PPBS
Frequency Percent
Valid Percent
Cumulative Percent Valid Under
control
41 41.0 41.0 41.0
Uncontrol 59 59.0 59.0 59.0
Total 100 100.0 100.0
100.0