The pupil premium:
assessing the options
Haroon Chowdry
Ellen Greaves
Luke Sibieta
Institute for Fiscal Studies
Copy-edited by Judith Payne
The Institute for Fiscal Studies
7 Ridgmount Street
Published by
The Institute for Fiscal Studies 7 Ridgmount Street
London WC1E 7AE Tel: +44 (0)20 7291 4800 Fax: +44 (0)20 7323 4780 Email: mailbox@ifs.org.uk Website: http://www.ifs.org.uk
Printed by
Pureprint Group, Uckfield
© The Institute for Fiscal Studies, March 2010
Preface
The authors gratefully acknowledge funding from the Esmée Fairbairn Foundation (grant number ED/09-1429).
The authors would like to thank the following for their help, comments and advice on drafts: Stuart Adam, Julian Astle, Mike Brewer, Sam Cannicott, Robert Chote, Claire Crawford, Sam Freedman, Alissa Goodman, Hilary Hodgson, Elinor Landeg, Alastair Muriel, David Phillips, Anna Vignoles, Anne West and officials from the Department for Children, Schools and Families. The authors are also grateful to the Department for Children, Schools and Families for providing the National Pupil Database and to Experian for providing MOSAIC data.
Contents
Executive summary 1
1. Introduction 4
2. School funding in England 6
2.1 Schools spending in England 7
2.2 How does the school funding system work? 8
2.3 Key characteristics and changes 10
2.4 Proposals for a pupil premium 16
3. Theory and empirical evidence 21
3.1 Direct impact of resources on pupil attainment 22
3.2 Indirect impact of peer groups 28
3.3 Indirect impact of new schools 33
3.4 Summary 38
4. Empirical analysis of policy options 40
4.1 The design of a pupil premium 41
4.2 Data and methodology 47
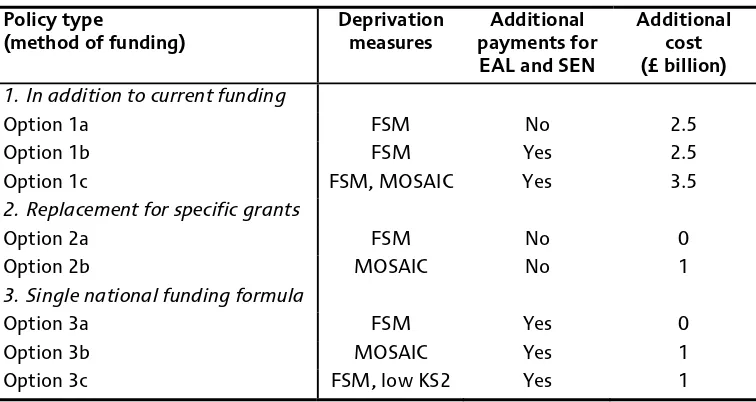
4.3 Policy options 49
In addition to current funding 50
Replacement for specific grants 57
Single national funding formula 62
4.4 Moving to a single national funding formula 72
4.5 Conclusions 80
5. Conclusions 82
Appendix: Regression results for 2008–09 84
Executive
summary
Introduction
• Both the Conservatives and the Liberal Democrats have proposed introducing a pupil premium in England, with the aim of narrowing the achievement gap between rich and poor by attaching greater levels of funding to pupils from disadvantaged backgrounds.
• The idea of a pupil premium is to provide a fixed extra amount to state schools for each pupil from a disadvantaged background they admit each year. The current system already weights pupil funding towards deprivation to some extent. The proposals for a pupil premium would simplify this system, could weight funding even more towards disadvantage and make changes in a school’s funding levels much more immediate as intakes change over time.
• Such a reform would mark a significant change to school funding and, without additional money from the public purse, risks creating winners and losers. At a time of fiscal restraint, it is essential that any such reform is grounded in both theory and evidence.
School funding in England
• Total school spending in England amounted to £47.5 billion in 2008–09 (in 2010 prices). Day-to-day spending per pupil has grown by an average of 4.8% per year in real terms since Labour came to power in 1997.
• Schools currently receive their funding through two main sources: local authorities’ ‘fair-funding’ formulae and specific grants from central government.
• Per-pupil funding varies widely between schools in England. Much of this variation arises because the current system weights funding towards schools with more deprived intakes. For example, the implied additional income that schools receive for each pupil eligible for free school meals (FSM) comes to approximately £2,460 in the case of primary schools and about £3,370 for secondary schools. A
disproportionate share of these implicit ‘FSM premiums’ results from specific grants made by central government, which serve to make the school funding system more redistributive than it otherwise would be. This is particularly true for secondary schools, thereby making deprived secondary schools highly dependent on specific grants.
• The level of funding targeted at deprivation has increased rapidly in recent years, particularly in terms of funds provided by local authorities. Local authorities still seem to ‘flatten’ the funding they receive on the basis of deprivation, spreading it across all pupils instead, but the level of such flattening has reduced. However, the system remains relatively unresponsive to changing needs from year to year. • Both the Conservatives and the Liberal Democrats have proposed the introduction
Theory and empirical evidence
• The pupil premium could narrow the achievement gap between advantaged and disadvantaged pupils through a number of mechanisms: the direct effect of extra resources; the indirect effect of changes to pupils’ peer group; or the indirect effect of the creation of new schools.
• The conventional wisdom surrounding the impact of increasing school resources on pupil attainment is that ‘there is not a strong or consistent relationship between student performance and school resources’. Recent academic literature for the UK has provided some evidence of resource effects, however, though they are generally small in magnitude. There is some suggestion that extra resources for disadvantaged pupils would reduce the attainment gap, although this will depend on how those resources are used by schools.
• Schools are unlikely to actively recruit more disadvantaged pupils as a result of the pupil premium: the premium would need to be very high to sufficiently reduce the disincentive for schools to attract such pupils, and schools’ ability to select pupils is also limited to some extent by the School Admissions Code. The pupil premium may lead to a small reduction in covert selection by schools but is unlikely to significantly reduce social segregation.
• New schools may be established primarily in disadvantaged areas, although, without a ‘for-profit’ incentive, it is unlikely that the UK would see the same level of
expansion that other countries have seen. We also find that an increase in the number of schools may lead to an increase in the level of segregation between schools, but this may not be detrimental to disadvantaged pupils. Several chains of schools in the US specialise in teaching pupils in disadvantaged areas and have reported significant gains in attainment.
Empirical analysis of policy options
• We simulate a number of options for the pupil premium and then examine their likely impact on school finances. The results show the impact on the amount of ‘progressivity’ in the school funding system (i.e. the weighting of funding towards school-level measures of deprivation) and they document the range of winners and losers compared with the current system.
• The policy options are grouped together according to whether they (1) supplement the existing system, (2) replace specific grants or (3) replace the entire system. • The options in the first category approximate current Liberal Democrat policy. Out
of the options we consider, these reforms financially benefit schools the most and increase progressivity. However, funding must be found from other sources: the Liberal Democrats have proposed cutting tax credits to above-average-income families, as well as other areas of spending.
Executive summary
• We also consider the implementation of a single national funding formula, a seemingly radical option. However, the number of significant losers from
implementing such a system could actually be much lower than through replacing specific grants alone.
• More detailed analysis of a national funding formula illustrates a key problem with such a reform: the concentration of gains and losses across particular local
authorities. This pattern does not appear to simply follow an urban/rural split; instead, it is likely to reflect local authority choices over central services, prioritisation of primary or secondary schools and historical factors.
All the main political parties have expressed a desire to narrow the achievement gap between rich and poor children and to promote social mobility. The Department for Children, Schools and Families lists ‘Clos[ing] the gap in educational achievement for children from disadvantaged backgrounds’ as one of its main strategic objectives.1
Meanwhile, the Conservative Party’s draft 2010 general election manifesto for schools states that ‘we will improve standards for all pupils and close the attainment gap between the richest and poorest’.2 In a recent speech, the leader of the Liberal Democrats, Nick
Clegg MP, said that ‘Countless young boys and girls are falling behind at school not because of a lack of potential, but because of the circumstances of their birth’.3
Achievement gaps between rich and poor can be seen from a very early age and continue to widen as children get older. By the time children take their GCSEs at age 16, there is a significant achievement gap between rich and poor. As Figure 1.1 shows, in 2008, less than a quarter of children eligible for free school meals (FSM) achieved five good GCSEs (A*–C) inclusive of English and Maths. This compares with just over half of all children from higher-income families (not eligible for free school meals). However, this gap has narrowed in relative terms in recent years, as shown by the black line in Figure 1.1. In 2008, children eligible for FSM were half as likely to achieve this benchmark as children who were not eligible, yet in 2003 they were only a third as likely to do so. Nevertheless, the current achievement gap is large and makes a significant contribution to later-life income and earnings inequalities, and could potentially be passed on to future generations.
Figure 1.1. Percentage of children achieving 5+ GCSEs at A*–C (including
English and Maths) by FSM eligibility
Sources: 2003–04 to 2007–08 – Department for Children, Schools and Families (2009a); 2008–09 – Department for Children, Schools and Families (2009b).
1http://www.dcsf.gov.uk/dsoindicators/downloads/DSO-Indicators-March2009.pdf.
2
http://www.conservatives.com/News/News_stories/2010/01/~/media/Files/Draft%20Manifesto/DraftSchool
sManifesto.ashx, page 4.
3
‘Four steps to a fairer Britain says Nick Clegg’, 11 January 2010,
http://www.libdems.org.uk/speeches_detail.aspx?title=Four_steps_to_a_Fairer_Britain_says_Nick_Clegg&pP
K=800fa58c-5bc9-45d3-8b58-32b93d5c2e96.
1.0 1.2 1.4 1.6 1.8 2.0 2.2 2.4 2.6 2.8 3.0
0 10 20 30 40 50 60
2003–04 2004–05 2005–06 2006–07 2007–08 2008–09
Ratio –
relative
difference
Percentage achieving
5+ GCSEs
at
A*–C
(including
English and Maths)
Introduction
Various policy proposals have been put forward to reduce this gap, including: greater levels of early years provision; increased numbers of health visitors; greater levels of one-on-one tuition in reading and Maths; opening up the state sector to provision by non-state providers; incentives for good teachers to work in deprived schools; mentoring schemes; and programmes to raise the aspirations of young children from disadvantaged backgrounds.
One proposal put forward by both the Conservatives and the Liberal Democrats is the introduction of a disadvantaged pupil premium into the school funding system in England. These proposals are highly likely to form part of their manifesto commitments for the upcoming 2010 general election.4
The idea of a pupil premium is to provide a fixed extra amount to state schools for each pupil they admit from a disadvantaged background. The current system of school funding in England does effectively already provide extra funding for schools with more pupils from disadvantaged backgrounds. However, the system is complex and rather slow to respond to year-on-year changes in a school’s intake, with a large amount of funding apparently dependent on historical rather than current deprivation.5 The proposals for a
pupil premium would not only simplify this system, but could also weight funding even more towards disadvantage and make changes in a school’s funding levels much more immediate as intakes change over time.
Such a reform, if implemented, would therefore mark a significant change to the way schools are funded in England. It is thus essential that any such reform is grounded in both theory and empirical evidence. This Commentary aims to provide a rigorous and impartial analysis of the theory behind a pupil premium, together with a comprehensive empirical analysis of how a pupil premium would operate in practice and how it would affect school finances.
The rest of this Commentary is structured as follows. Chapter 2 provides some
background information on the current system of school funding, its key characteristics and the proposals for a pupil premium currently being put forward. Chapter 3 reviews the theory of the pupil premium and the channels through which the pupil premium may affect the attainment of disadvantaged pupils, drawing on relevant literature and
empirical evidence. Chapter 4 then examines the empirical options for a pupil premium, tying these closely to the proposals put forward by the Liberal Democrats as well as recent proposals made by Policy Exchange.6 We examine the extent to which the pupil
premium could increase or decrease the targeting of resources at disadvantaged pupils and how many schools would win or lose from these proposals. We also consider some issues that might be likely to arise with the introduction of a single national funding formula, a long-term aspiration of the Conservative Party. Chapter 5 concludes.
4See the draft schools chapter of the Conservatives’ 2010 general election manifesto and the speech by Nick
Clegg on 11 January 2010, both cited earlier.
5
See Chowdry, Muriel and Sibieta (2008).
6
Key findings
• Total school spending in England amounted to £47.5 billion in 2008–09 (in 2010 prices). Day-to-day spending per pupil has grown by an average of 4.8% per year in real terms since Labour came to power in 1997.
• Schools currently receive their funding through two main sources: local authorities’ ‘fair-funding’ formulae and specific grants from central government.
• There is a great deal of variation in per-pupil funding between schools in England. Much of this variation arises because the current system weights funding towards schools with more deprived intakes. For example, the implied additional income that schools receive for each pupil eligible for free school meals (FSM) comes to approximately £2,460 in the case of primary schools and about £3,370 for secondary schools. A disproportionate share of these implicit ‘FSM premiums’ results from specific grants made by central government, which serve to make the school funding system more redistributive than it otherwise would be. This is particularly true for secondary schools, thereby making deprived secondary schools highly dependent on specific grants.
• The level of funding targeted at deprivation has increased rapidly in recent years, particularly in terms of funds provided by local authorities. Local authorities still seem to ‘flatten’ the funding they receive on the basis of deprivation, spreading it across all pupils instead, but the level of such flattening has reduced. However, the system remains relatively unresponsive to changing needs from year to year. • Both the Conservatives and the Liberal Democrats have proposed the introduction
of a pupil premium. This would provide a fixed amount to schools for each pupil enrolled from a disadvantaged background. A pupil premium aims to increase the level of resources targeted at pupils from disadvantaged backgrounds and reduce any disincentives that affluent schools might have to attract hard-to-teach pupils.
School funding in England
2.1 Schools spending in England
In 2008–09, it is estimated that school spending reached £47.5 billion (expressed in 2010 prices). As Figure 2.1 shows, about 12% of this total represents capital expenditure (for example, rebuilding or refurbishing school buildings). The remaining 88% represents current or day-to-day expenditure (for example, teachers’ pay, textbooks, stationery and other consumables). About 28% is spent on primary schools and another 39% on
secondary schools; 10% covers expenditure on the under-5s, with the final 11% covering other expenditure (including expenditure on city academies and teacher training).
[image:14.595.164.479.306.477.2]Figure 2.2 shows the level of current spending per pupil (i.e. excluding capital spending) between 1997–98 and 2010–11, expressed in 2010 prices. This measure of spending per pupil is expected to reach £5,580 by 2010–11. If delivered, this would represent an annual average growth rate of 4.8% per year in real terms since Labour came to power in 1997. The growth rate would be even higher, at 5.8% per year, if we included capital spending.
Figure 2.1. Composition of schools spending in England, 2008–09
Source: Department for Children, Schools and Families, 2009b.
Figure 2.2. Evolution of current school spending per pupil in England
Sources: Department for Children, Schools and Families, 2009b. ONS and HM Treasury for deflators.
Capital 12%
Under-5s 10%
Primary 28% Secondary
39%
Other 11% Total school spending
in 2008–09: £47.5 billion (2010 prices)
£0 £1,000 £2,000 £3,000 £4,000 £5,000 £6,000
1997–98 1999–2000 2001–02 2003–04 2005–06 2007–08 2009–10
Spending
per pupil (2010 prices)
2.2 How does the school funding system work?
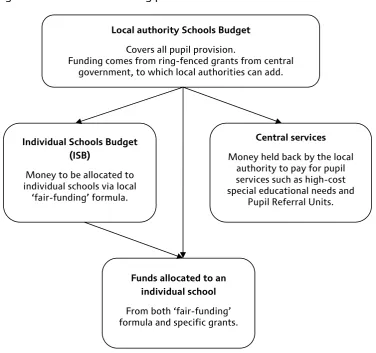
[image:15.595.75.452.164.517.2]Per-pupil funding of £5,580 in 2010–11 will not be allocated to all schools in England as a fixed per-pupil amount in 2010–11. The school funding system is significantly more complicated and is described in detail in Chowdry, Muriel and Sibieta (2008). Here, we provide a brief summary, which is illustrated in Figure 2.3.
Figure 2.3. The school funding process: local authorities to schools
Schools in England receive almost all their funding via local authorities, though local authorities do not control all of this money. Each year, local authorities receive an allocation from central government called the Dedicated Schools Grant (introduced in 2006–07). This is calculated based on pupil numbers, the allocation the local authority received the previous year and other factors to reflect ministerial priorities (such as the number of pupils eligible for free school meals or with low prior attainment). This allocation is ‘ring-fenced’, meaning that it must be spent on pupil provision in support of local authorities’ ‘Schools Budget’.However, local authorities are free to add to this money from other sources, such as grants that are not ring-fenced, council tax revenues and local charges for council services.
Some of this Schools Budget is spent on central services provided by the local authority, such as high-cost special educational needs, transport, education psychology services and school admissions. The amount that is held centrally varies by local authority. In 2008– 09, local authorities spent, on average, 12% of their Schools Budget on these central
Local authority Schools Budget
Covers all pupil provision.
Funding comes from ring-fenced grants from central government, to which local authorities can add.
Individual Schools Budget (ISB)
Money to be allocated to individual schools via local
‘fair-funding’ formula.
Central services
Money held back by the local authority to pay for pupil services such as high-cost special educational needs and
Pupil Referral Units.
Funds allocated to an individual school
School funding in England
services. However, about one in ten local authorities spent more than 16% of their Schools Budget on central services, and one in ten spent less than 9%.7
The rest of the Schools Budget is then allocated to schools using a local authority’s ‘fair-funding’ formula. This is intended to ensure that schools within a local authority that have similar characteristics receive the same level of per-pupil funding. These formulae vary by local authority, but the most common elements determining schools’ funding are:
• the number of pupils in each Key Stage;
• indicators of social deprivation (e.g. number of pupils eligible for free school meals); • number of pupils with a statement of special educational needs (SEN);
• number of pupils with SEN without a statement;
• number of pupils with English as an additional language;
• site and school factors (e.g. business rates bill, or an amount per square metre). The amount provided through these fair-funding formulae represents the largest single source of each individual school’s funding. However, over the past decade, schools have increasingly received funding via another source: specific grants from central
government. These are calculated using formulae determined by central government. Local authorities have no say over how they are allocated. Instead, they must be passed on in full directly into schools’ bank accounts. Examples of specific grants include the School Standards Grant, School Development Grant and other Standards Fund grants.
[image:16.595.162.505.480.666.2]Figure 2.4 shows the proportion of (a) primary and (b) secondary schools’ funding that came from formula funding (i.e. via local authorities’ fair-funding formulae) and the proportion that came from specific grants for years from 2005–06 to 2008–09. In 2008– 09, primary schools received about 15% of their funding from specific grants, a figure that has not changed much since 2005–06. Similarly, secondary schools received about 16% of their funding from specific grants in 2008–09, but, in contrast to primary schools, this figure has fallen over time from about 20% in 2005–06.
Figure 2.4a. Composition of primary school funding over time
Sources: School financial data – based on Section 52 outturn data. Pupil- and school-level characteristics – taken from the National Pupil Database (NPD), Pupil Level Annual School Census (PLASC) and EduBase. ONS and HM Treasury for deflators.
7
Authors’ calculations using Section 52 data – publicly-available financial data on schools’ individual levels of funding and expenditure.
0% 10% 20% 30% 40% 50% 60% 70% 80% 90% 100%
2005–06 2006–07 2007–08 2008–09
Figure 2.4b. Composition of secondary school funding over time
Sources: School financial data – based on Section 52 outturn data. Pupil- and school-level characteristics – taken from the National Pupil Database (NPD), Pupil Level Annual School Census (PLASC) and EduBase. ONS and HM Treasury for deflators.
2.3 Key characteristics and changes
As outlined above, schools receive funding from two broad sources: their local authority’s fair-funding formula; and specific grants determined by central government. In this section, we examine the key characteristics of the present system, as well as changes in recent years and current government proposals for further changes.
Variation in funding
The operation of fair-funding formulae and differences in pupil characteristics across schools create quite a wide range of funding per pupil across schools in England. Figure 2.5 plots the distribution of per-pupil funding in 2008–09 for primary schools (dashed line) and secondary schools (solid line), expressed in 2010 prices.
Figure 2.5. Distribution of funding per pupil in 2008–09
Source: School financial data – based on Section 52 outturn data.
0% 10% 20% 30% 40% 50% 60% 70% 80% 90% 100%
2005–06 2006–07 2007–08 2008–09
Specific grants LA formula funding
0
.0002
.0004
.0006
.0008
Proportion
2000 4000 6000 8000 10000
Funding per pupil (£ 2010 prices)
[image:17.595.79.456.511.721.2]School funding in England
Both distributions exhibit a wide amount of dispersion, with primary funding per pupil varying between around £3,000 and £6,000, while secondary funding per pupil varies between £4,000 and £7,000 or so. A small number of schools exhibit funding levels outside these amounts. The fact that the distribution for secondary schools is further to the right indicates that they generally receive more funding per pupil: £5,050 on average versus £4,050 for primary schools.
Increases in deprivation funding
In our previous report on school funding (Chowdry, Muriel and Sibieta, 2008), we analysed which pupil characteristics (implicitly) explain the largest proportions of schools’ funding. We found that funding was highly skewed towards schools with greater numbers of pupils with special educational needs (particularly if those pupils have a statement8) and towards schools with a greater number of pupils from deprived
backgrounds. Here, we repeat some of this analysis for the most recent financial year, 2008–09.
We use regression techniques to isolate the impact of various school-level characteristics on a school’s overall level of funding in any particular year, whilst holding other
characteristics constant (see Table A.1 in the Appendix for full results for 2008–09). For instance, we ask how much higher the level of funding is, on average, in schools with an extra child eligible for free school meals, holding other school-level characteristics constant. We refer to this example throughout the Commentary as the implicit FSM premium and use it as a measure of the level of targeting towards disadvantage present in the current school funding system. However, it is important to note that this
methodology only gives us the implicit formula used by local authorities rather than their
explicit or actualformulae. Explicit formulae are more complex than the implicit formulae
we estimate, as they use other measures of disadvantage and factors that we cannot control for (for example, the number of children in care). The standardisation and simplification of the present system is one aim of the pupil premium. Indeed, one option for a pupil premium could simply create an explicit FSM premium.
Noting this, Figure 2.6 shows that, in 2008–09, primary schools received, on average, an implicit FSM premium of £2,460 for each pupil eligible for free school meals, whilst secondary schools received an extra £3,370 (in 2010 prices). These amounts are on top of any base amount provided for all other pupils. This implicit FSM premium has grown in recent years for both primary and secondary schools, as is also shown in Figure 2.6. It has grown by a total real-terms amount of 69% for primary schools and by a total of 53% for secondary schools over the period 2005–06 to 2008–09. Both figures take into account the effects of inflation and are well in excess of the 17% real-terms growth in total per-pupil spending that could be observed earlier in Figure 2.2. The growth in this implicit FSM premium in the last few years has thus been very large indeed, and suggests the school funding system has become much more redistributive. It is also worth noting that the growth in primary schools’ implicit FSM premium was particularly large in 2007–08: it grew from £1,630 the previous year to £2,260, an increase of 39% in a single year. The growth in secondary schools’ implicit FSM premium over the period was more gradual.
8
Figure 2.6. Implicit FSM premium over time
Sources: School financial data – based on Section 52 outturn data. Pupil- and school-level characteristics – taken from the National Pupil Database (NPD), Pupil Level Annual School Census (PLASC) and EduBase. ONS and HM Treasury for deflators.
In our previous report, we also showed that a disproportionate share of this implicit FSM premium can be accounted for by specific grants from central government. Despite representing only 15% of overall primary schools’ budgets over time, they contributed to 28% of the implicit FSM premium in 2008–09, as is shown in Figure 2.7a. The story is even starker for secondary schools (Figure 2.7b). Specific grants represented 16% of secondary schools’ budgets in 2008–09, yet contributed 44% of the implicit FSM premium. Therefore specific grants seem to have made the school funding system more redistributive than it otherwise would have been. However, their contribution to the implicit FSM premium has decreased for both primary and secondary schools since 2005–06.
Figure 2.7a. Composition of implicit primary FSM premium over time
Sources: School financial data – based on Section 52 outturn data. Pupil- and school-level characteristics – taken from the National Pupil Database (NPD), Pupil Level Annual School Census (PLASC) and EduBase. ONS and HM Treasury for deflators.
£0 £1,000 £2,000 £3,000 £4,000
2005–06 2006–07 2007–08 2008–09
Implicit FSM
premium,
2010
prices
Primary Secondary
0% 10% 20% 30% 40% 50% 60% 70% 80% 90% 100%
2005–06 2006–07 2007–08 2008–09
School funding in England
Figure 2.7b. Composition of implicit secondary FSM premium over time
Sources: School financial data – based on Section 52 outturn data. Pupil- and school-level characteristics – taken from the National Pupil Database (NPD), Pupil Level Annual School Census (PLASC) and EduBase. ONS and HM Treasury for deflators.
Flattening of deprivation funding
In our previous report, we found that the amounts allocated to schools via local
[image:20.595.147.519.493.701.2]authorities’ ‘fair-funding’ formulae are less redistributive than the system used to allocate grants to local authorities. In other words, local authorities seem to spread or ‘flatten’ the deprivation-led funding that they receive, giving more to all pupils across their area rather than just focusing it on deprived pupils. West (2009) examines the formulae used by a sample of local authorities and also finds that they allocate less funding on the basis of deprivation than they receive from central government, instead spreading the funding over all pupils in their area.
Figure 2.8. Proportion of funds implicitly allocated to local authorities on
the basis of FSM that was passed on to individual schools
Sources: School financial data – based on Section 52 outturn data. Pupil- and school-level characteristics – taken from the National Pupil Database (NPD), Pupil Level Annual School Census (PLASC) and EduBase. ONS and HM Treasury for deflators.
0% 10% 20% 30% 40% 50% 60% 70% 80% 90% 100%
2005–06 2006–07 2007–08 2008–09
Specific grants LA formula funding
0% 10% 20% 30% 40% 50% 60% 70% 80% 90% 100%
2005–06 2006–07 2007–08 2008–09
Proportion
of implciit
FSM premium
allocated
to LAs that
was passed to schools
Here, we repeat some of the analysis from our previous report, including the most recent financial year. Figure 2.8 shows that, in 2008–09, local authorities passed on about 63% of the funding they received on the basis of deprivation, on average. This amount was similar for both primary and secondary schools, having risen since 2005–06 in both cases. The reduction in ‘flattening’ was particularly significant for primary schools in 2007–08, coinciding with the large growth in their overall implicit FSM premium that year.
The issue of flattening of deprivation funding has been a major one for the Department for Children, Schools and Families. The department has encouraged local authorities to allocate greater levels of funding on the basis of social deprivation. It provided them with more information on how much of their funding is determined on the basis of deprivation and more advice on what mechanisms they can use to allocate funds to schools.9 Based on
current evidence, it seems as if such pressure and information may well have induced local authorities to allocate a larger proportion of funds on the basis of deprivation.
Stability and lack of responsiveness
Whilst Chowdry, Muriel and Sibieta (2008) found that funding is, on average, strongly skewed towards schools with greater levels of social deprivation, they also found that changes in funding are much less sensitive to changes in social deprivation and educational need from year to year. Although schools with high levels of social
deprivation do, on average, have higher levels of funding per pupil, schools that become more deprived in any given year are unlikely to see much change that year in their level of funding per pupil. This may exacerbate any incentive schools have to ‘cream-skim’ easy-to-teach pupils; harder-to-teach pupils may be more expensive to teach, but they do not seem to bring with them much immediate change in funding.
More generally, historical levels of funding have always been used to determine current levels of funding. However, various mechanisms have been introduced to the school funding system in recent years that further favour stability. This possibly comes at the expense of tackling funding inequalities or responding to changes in need. Most of these stability mechanisms were introduced following on from the school funding ‘crisis’ of 2003–04, in which a number schools complained that they were due to receive significant cuts in funding.
One important mechanism increasing the inertia (and so reducing responsiveness) of schools’ per-pupil funding is the Minimum Funding Guarantee (MFG), which guarantees each school a minimum increase in funding per pupil each year. This guarantee limits the impact of local authorities’ fair-funding formulae, as these formula allocations are ignored if they provide schools with less than the level of the MFG.10 This almost certainly
diminishes the responsiveness of school funding to changing needs from year to year. Indeed, the Audit Commission (2004) noted that ‘the minimum [funding] guarantee does not resolve issues of funding inequalities that might exist at school level. It has the potential to embed them and postpone them being tackled’ (page 11).
9http://www.teachernet.gov.uk/management/schoolfunding/schoolfunding2008to11/deprivationfundingrevie
w200811/.
10
School funding in England
The MFG was originally set at a relatively high level. In 2004–05, it was set at 4% per pupil in cash terms, two-thirds of the overall cash increase in the main grant provided to local authorities that year (6%). However, it is currently set at 2.1% per pupil for years 2008–09 to 2010–11, around half of the average per-pupil increase in the Dedicated Schools Grant over these years (4.2% per year in cash terms). It has thus become a slightly less binding constraint recently.
Another example of the way the school funding system currently favours stability is the so-called ‘spend-plus’ methodology currently used to determine most grants to local authorities and schools. Under this method, grants are determined as a flat-rate increase on what schools or local authorities received in the previous year, plus an extra increase determined on the basis of a formula. Like the Minimum Funding Guarantee, this limits the ability of the school funding system to redistribute money between schools or local authorities on the basis of changing need.
Future changes
The government is currently undertaking a review of the formula used for distributing the Dedicated Schools Grant (DSG), and school funding arrangements more generally. This review is intended to guide the development of the school funding settlement for 2011 onwards. The main aim of this review is to:
consider the development of a single transparent formula for the distribution of DSG, which distributes resources in line with relative need, recognising the different costs of educating particular groups of pupils and providing education in different areas.11
The review aims to move beyond the spend-plus methodology used in recent years and develop a single needs-based formula to determine allocations to local authorities. The review is yet to report at the time of writing, but some of the relevant issues it is considering are:
• whether the basic unit of funding should be determined on a top-down basis, as it is now, or through an activity- or needs-based analysis;
• whether there is scope for further streamlining of direct grants and payments – for example, merging the School Standards Grant and School Development Grant into the Dedicated Schools Grant;
• what indicators are best used when distributing money for pupils with additional educational needs; whether it is possible to attach money more directly to deprived pupils, for example, as they move round the system.
To inform the review, the Department for Children, Schools and Families also
commissioned a number of pieces of research relevant to school funding in England.12
Some of the key findings of the review of additional educational needs are discussed in Sections 3.2 and 4.1.
11
Review of DSG Distribution Formula: Terms of Reference,
http://www.teachernet.gov.uk/docbank/index.cfm?id=12419.
12
Summary of key characteristics and changes in school funding
There is a great deal of variation in per-pupil funding between schools in England. Much of this variation is the result of funding weighted towards schools with more deprived intakes: primary schools receive an implicit FSM premium of about £2,460 on top of all other funding, and secondary schools receive about £3,370. A disproportionate share of these implicit FSM premiums results from specific grants made by central government, which make school funding more redistributive than it otherwise would be. However, the level of funding targeted at deprivation has increased rapidly in recent years, particularly in terms of the funding provided by local authorities. Local authorities still seem to ‘flatten’ the funding they receive on the basis of deprivation, spreading it across all pupils instead, but the level of such flattening has reduced in recent years. This could well be the result of pressure and information from central government.
The system is, however, still relatively unresponsive to changing needs from year to year. Several mechanisms, such as the Minimum Funding Guarantee, have been introduced that further favour stability in funding, possibly at the expense of tackling funding
inequalities. The government is currently reviewing the system of school funding for 2011 onwards, though no specific proposals have been announced at the time of writing.
2.4 Proposals for a pupil premium
Both the Conservatives and the Liberal Democrats have made proposals for the
introduction of a pupil premium into the school funding system in England. Both sets of proposals would introduce a fixed amount provided to schools for pupils from a
disadvantaged background, aimed at increasing the targeting of resources at schools with a high proportion of disadvantaged pupils, and reducing the disincentive to attract hard-to-teach pupils. Such a reform could, in principle, also simplify the school funding system.
The idea of a pupil premium
The origins of the pupil premium can be traced back to proposals for a voucher system for schools in the 1960s – for example, Milton Friedman’s (1962) proposed system in which parents would be given a voucher equal to the average cost of a place in a state school. In his system, the parents could use this voucher to apply to any school, private or public, but the school had discretion over its admissions. If the cost of the school place exceeded the value of the voucher, parents could ‘top up’ the voucher from their own money in order to meet the total fee. Variants of this voucher system have been implemented across the US and other countries. In the UK, similar schemes have been proposed by various free-market think tanks and commentators – for example, Sexton (2002).
School funding in England
In response to such concerns, Jencks (1970) proposed a different system of vouchers in which ‘topping up’ was not possible, but in which low-income parents received a larger voucher. This was designed to divert more resources to schools with larger numbers of disadvantaged pupils and reduce any disincentive on the part of schools to admit such pupils. The system was still a voucher policy: it maintained the notion of parental choice over which school to send their child to, and it aimed to increase competition between schools and drive up standards; it just placed more emphasis on redistribution.
In 1989, Le Grand proposed a ‘positively discriminating voucher’, similar to Jencks’s scheme in that more money would be attached to pupils from disadvantaged backgrounds. This would provide more money to schools serving disadvantaged communities in the hope of raising attainment in these schools – an objective of all the main political parties in the UK. Under Le Grand’s proposal, schools serving more disadvantaged pupils ‘would have better premises and equipment and could attract higher quality staff’ (Le Grand, 2007). It was also designed to counteract the incentive for schools to ‘cream-skim’ easy-to-teach pupils in a competitive market for schools. The pupil premiums proposed by the Liberal Democrats and the Conservative Party are largely inspired by Le Grand’s system and have similar aims.
However, the parties have tended to place different emphases on the various mechanisms that could reduce the attainment gap between rich and poor. The Liberal Democrats have put the greatest emphasis on the direct effect of providing extra resources, with less emphasis on the indirect effects. Although the Conservatives also highlight the direct resource effect, they have put relatively more emphasis than the Liberal Democrats on the indirect or incentive effects, especially the effect of new schools. They have proposed reducing the barriers to creating new schools and the introduction of Swedish-style free schools, run by non-state providers. The pupil premium cannot be seen in isolation from this quite radical policy.
Liberal Democrat proposals
The Liberal Democrats (2009) have said that they are committed to:
Introduc[ing] a Pupil Premium to close the performance gap between children from rich and poor families. £2.5bn extra would be used immediately to bring the funding of the poorest and most educationally disadvantaged 1 million children up to levels in private schools.
They have also said that such a pupil premium would be attached to pupils eligible for free school meals, those with English as an additional language (but only for their first year), those with low- or medium-level special educational needs, and children in care. It would then be extended in future years to ‘include other children from low income households where one or more parent is in employment’.
Under the Liberal Democrat proposals, the pupil premium would be in addition to all other sources of funding for schools (i.e. it would create an explicit FSM premium on top of the current implicit FSM premium). For example, a pupil premium could simply give schools an extra £2,500 for each of their pupils eligible for free school meals on top of all other funding.13 Such a premium would obviously increase the targeting of resources at
13
pupils from disadvantaged backgrounds, and it would also increase the sensitivity of the system to changes in pupil needs from year to year.
Funding for such a pupil premium would need to be found via increases in taxation, spending reductions elsewhere or new borrowing. The Liberal Democrats have proposed that a pupil premium of £2.5 billion could be funded via reductions in tax credits to families with above-average incomes and cuts to other areas of spending.
Such a pupil premium would not change the role of local authorities in school funding decisions. It would simply represent another specific grant from central government, which local authorities must pass on to schools. However, when they observe the large increase in deprivation funding from a pupil premium, local authorities could respond by reducing the emphasis on deprivation in their own funding formulae. The fact that local authorities have tended to flatten deprivation funding in the past might suggest that they could well respond in this way. Preventing this unintended consequence of a pupil premium could require further constraints to be placed on the school funding decisions of local authorities.
Lastly, how schools with large numbers of disadvantaged pupils would use the extra money from the pupil premium is an open question. The Liberal Democrats have chosen to put no constraints on how schools could use the extra resources. Schools could thus choose to target funds on individual pupils defined as being disadvantaged on the basis of the pupil premium, although they could also choose to spend them on other pupils they identify as needing extra resources for other reasons. However, the Liberal Democrats have also stated that ‘Schools would be held accountable by parents, the Local Authority and OFSTED for using their resources in sensible and innovative ways’.
Conservative proposals
In a draft chapter for their 2010 general election manifesto, the Conservatives state that ‘We will introduce a pupil premium – weighting school funding towards children from disadvantaged backgrounds’.14 In an earlier paper outlining their plan for schools reform
(Conservative Party, 2007), they state that:
We have proposed an explicit Pupil Premium to increase per capita funding for pupils from deprived backgrounds ... We believe that the Pupil Premium should attach to pupils directly. ... [Schools within the maintained system] will thus be incentivised to seek out and accept pupils from more challenging backgrounds. (page 42)
Therefore the Conservatives also seem committed to a pupil premium that would increase the targeting of resources towards pupils from disadvantaged backgrounds, and to making the system more responsive to changes in need from year to year.
Furthermore, they have announced an ambition to move to a single national funding formula for all schools in England, with a pupil premium for disadvantaged pupils:
In order to help schools plan and make them more accountable for what they spend we will ... shift towards a system in which there is a simplified
14
http://www.conservatives.com/News/News_stories/2010/01/~/media/Files/Draft%20Manifesto/DraftEduca
School funding in England
amount paid by the taxpayer per pupil (with the Pupil Premium on top).15
This would represent a substantial reform to the school funding system in England. It would essentially abolish the role of local authorities in determining school funding. The system would instead be centralised, with power resting either with the Department for Children, Schools and Families or with an independent body appointed by the
department. It could also lead to a substantial redistribution of resources across schools. However, it would greatly simplify the system of school funding.
In principle, a single national funding formula could allow central government to allocate more resources to schools attended by disadvantaged pupils. It would also prevent any extra resources targeted at disadvantage from being flattened by local authorities. However, it remains an open question whether a single national formula with a pupil premium would increase or decrease the targeting of resources towards disadvantaged pupils. As we have already seen, the present system of school funding already produces reasonably high implicit FSM premiums. The pupil premium in a single national funding formula would replace implicit FSM premiums with an explicit version targeted at some measure of disadvantage – thereby simplifying the system of deprivation funding. However, if the pupil premium scheme is less redistributive than the present system, then it could in principle reduce the targeting of the school funding system at
disadvantaged pupils. Indeed, in Department for Children, Schools and Families (2009c), the government stated that:
Introducing a pupil premium ... could actually mean a smaller proportion of school funding allocated at national level for deprivation, and less money reaching schools with the most deprived pupils. [It] could replace more generous existing school funding streams that are allocated on the basis of deprivation. (page 72)
Therefore whether it makes the system more or less redistributive is an empirical question and one that we will return to in Chapter 4, where we seek to model various options for a pupil premium.
Unfortunately, the Conservatives have not said what would go into such a single national school funding formula. In particular, they have not said how they would measure ‘disadvantage’, how much extra per-capita funding these pupils would receive or what the planned total cost of the scheme is. We can therefore only speculate as to what such a formula would include, and show the implications of various options for a single national funding formula. Finally, like the Liberal Democrats, the Conservatives have not specified how money from the pupil premium would need to be spent by schools.
Proposals from Policy Exchange
In recent years, researchers at Policy Exchange have published a number of reports that have included proposals for a pupil premium, which seem likely to influence Conservative thinking in this area. O’Shaughnessy and Leslie (2005) proposed that pupils attending a failing school should receive a pupil premium in per-capita funding that could be taken to other schools – a proposal inspired by a similar scheme in Florida.
15
Speech by Michael Gove, 6 November 2009,
http://www.conservatives.com/News/Speeches/2009/11/Michael_Gove_A_comprehensive_programme_for_s
More recently, Freedman and Horner (2008) proposed a single national funding formula that would incorporate a pupil premium. Under this system, all school funding would be determined by a basic per-pupil amount (adjusted for area costs) plus a pupil premium system for pupils from disadvantaged backgrounds. They proposed using a geo-demographic measure (MOSAIC), allocating greater levels of funding to pupils from MOSAIC types with lower average GCSE scores. Special educational needs funding would be determined by a separate independent agency.
However, Freedman and Horner were not able to fully model their proposed scheme; instead, they modelled an approximate version. The total cost of this scheme was to be £4.6 billion, which would be met partly through the abolition of a number of direct government grants and payments (the School Development Grant, School Standards Grant, Personalised Learning Grant and other Standards Fund grants) and partly through other cuts to the education budget (abolition of the Education Maintenance Allowance, ContactPoint and the National Challenge programme). In Chapter 4, we will attempt to model the single funding formula originally proposed by Freedman and Horner (2008), along with their approximate version, comparing these with other potential models of a pupil premium.
Summary of proposals for a pupil premium
Both the Conservatives and the Liberal Democrats have made proposals for the introduction of a pupil premium into the school funding system in England. These proposals aim to increase the targeting of resources at schools with a high proportion of disadvantaged pupils, and to reduce the disincentive to attract hard-to-teach pupils. In the next chapter, we review the theory behind a pupil premium. We focus on whether or not extra resources could improve attainment amongst disadvantaged pupils and whether they might change schools’ incentives to admit such pupils. In Chapter 4, we will investigate the extent to which the options for a pupil premium make the system of school funding more or less redistributive, the numbers of schools that win or lose under these options and by how much they win or lose. This is particularly relevant for
proposals – such as a single national funding formula – that would create a pupil
3. Theory and empirical evidence
Key findings
• The pupil premium could narrow the achievement gap between advantaged and disadvantaged pupils through a number of mechanisms: the direct effect of extra resources; the indirect effect of changes to pupils’ peer group; or the indirect effect of the creation of new schools.
• The conventional wisdom surrounding the impact of increasing school resources on pupil attainment is that ‘there is not a strong or consistent relationship between student performance and school resources’. Recent academic literature for the UK has provided some evidence of resource effects, however, though they are generally small in magnitude. There is some suggestion that extra resources for disadvantaged pupils would reduce the attainment gap, although this will depend on how those resources are used by schools.
• Schools are unlikely to actively recruit more disadvantaged pupils as a result of the pupil premium: the premium would need to be very high to sufficiently reduce the disincentive for schools to attract such pupils, and schools’ ability to select pupils is also limited to some extent by the School Admissions Code. The pupil premium may lead to a small reduction in covert selection by schools but is unlikely to significantly reduce social segregation.
• New schools may be established primarily in disadvantaged areas, although, without a ‘for-profit’ incentive, it is unlikely that the UK would see the same level of
expansion that other countries have seen. We also find that an increase in the number of schools may lead to an increase in the level of segregation between schools, but this may not be detrimental to disadvantaged pupils. Several chains of schools in the US specialise in teaching pupils in disadvantaged areas and have reported significant gains in attainment.
The main aim of the pupil premium proposed by the Conservative and Liberal Democrat parties is to narrow the attainment gap between rich and poor students. Proponents of the pupil premium claim that it will achieve this goal via a number of mechanisms, which are summarised in Figure 3.1.
First, if extra resources improve attainment, then targeting extra funds at disadvantaged pupils will narrow the attainment gap between rich and poor students. We refer to this as the direct mechanism and discuss it in more depth in Section 3.1. The pupil premium could also indirectly narrow the attainment gap through changes to pupils’ peer group, the type of school they attend or the creation of new schools. We refer to these effects collectively as the indirect mechanisms.
Figure 3.1. Possible mechanisms through which the pupil premium may
raise the attainment of disadvantaged pupils
The Conservatives’ education policy would allow greater freedom for groups of individuals to create new schools. The pupil premium cannot be seen in isolation from this policy; a funding premium for disadvantaged pupils may increase the incentive for schools to be created, especially in more deprived areas. In Section 3.3, we therefore investigate the potential effects of the pupil premium via the creation of new schools.
3.1 Direct impact of resources on pupil attainment
In a review of the literature to date, Hanushek (1997) concludes that ‘there is not a strong or consistent relationship between student performance and school resources’ and that ‘simple resource policies hold little hope for improving student outcomes’. Hanushek acknowledges that an increase in school resources could be effective in some situations, but believes extra resources will not consistently improve attainment unless
accompanied by changes in schools’ incentives and organisation:
The existing work does not suggest that resources never matter, nor does it suggest that resources could not matter. It only indicates that the current organization and incentives of schools do little to ensure that any added resources will be used effectively. (page 156)
This view summarises the common academic perception of the effectiveness of increasing school resources, supported by cross-country evidence from the OECD (2008). Some recent evidence has found small but statistically significant resource effects, however. Dewey, Husted and Kenny (2000) claim to review a more recent and comprehensive body of literature than Hanushek, differentiating between studies they believe correctly
Pupil premium
Extra resources
Increase in attainment for disadvantaged pupils
New providers
Increased competition Change in mix of
Theory and empirical evidence
identify the effect of resources on attainment and those that do not.16 The authors
conclude that the question of whether school inputs matter for the educational attainment of children is answered by ‘a resounding yes’, although they agree with Hanushek that not all schools will necessarily use extra resources effectively.
We now present a brief summary of UK studies, which are likely to be more relevant for us in assessing any potential direct benefits of increasing school resources on pupil attainment. Would increasing resources necessarily reduce the attainment gap between advantaged and disadvantaged pupils? We note that once funds are allocated to schools, they are free to distribute resources between their pupils. If schools choose to allocate the extra funds disproportionately to advantaged pupils, then the attainment gap would not be reduced. This is an unlikely strategy for schools, however, and in any case most resources will affect whole classes rather than individual pupils. Even if resources are allocated as intended, it may also be the case that disadvantaged pupils do not gain for some reason. Although the evidence we review does not show conclusively whether advantaged or disadvantaged pupils gain more from extra resources, we conclude that disadvantaged pupils are likely to gain from extra resources just as much as advantaged pupils, and therefore any positive resource effect is likely to reduce the attainment gap.
Evidence from the UK: NCDS
A number of studies have used the National Child Development Study (NCDS) to estimate the relationship between school resources and attainment.17 The NCDS is a longitudinal
survey of all the children born in the UK during the first week of March 1958; it contains a rich amount of data on these children throughout their childhood and on later life
outcomes. We review three studies that use the richness of this data set to attempt to isolate the effect of school quality.18 These papers acknowledge that schools can choose to
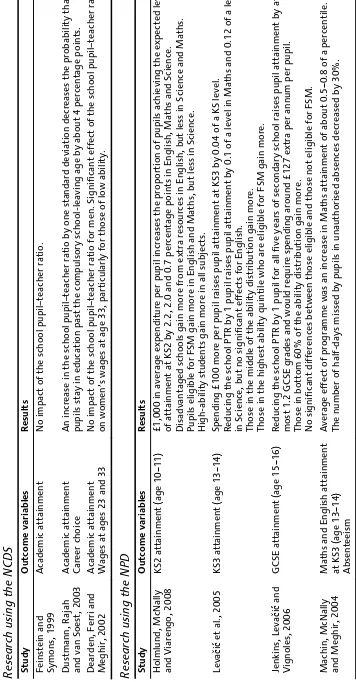
spend resources in a number of different ways. There could be a general increase in spending in all areas, or resources could be targeted at reducing the number of pupils per class (known as the pupil–teacher ratio). We summarise the findings of these papers below, and again in Table 3.1.
Feinstein and Symons (1999) find no significant effect of the pupil–teacher ratio (PTR) on academic attainment. However, Dustmann, Rajah and van Soest (2003) find that an increase in the school PTR by one standard deviation (i.e. an increase in average class sizes) decreases the probability that pupils stay in education beyond the compulsory school-leaving age by about 4 percentage points. Dearden, Ferri and Meghir (2002) find that the school PTR has no impact on educational qualifications, although there are some positive resource effects on future wages for women.
These studies using the rich NCDS data find some evidence of benefits to pupils in schools with a lower average PTR, although this is by no means universal. The results may not be the most relevant when thinking about the current school funding system, however, as the NCDS cohort went through the British education system in the 1970s.
16
They believe that income should not be used as a proxy for the time the parent spends teaching the child, as there are conflicting income/substitution effects of time as income increases. In the US school funding system from which most data are derived, there is also multicollinearity between income and school quality, as nearly half of all public school funding resources are generated from local taxation. The US system generates large funding differences between wealthy and impoverished communities (Biddle and Berliner, 2003).
17The NCDS is an individual-level data set with comprehensive information on educational outcomes, prior
attainment, family background and school quality.
18
Table 3.1. Summary of papers esti
mating the effe
ct of resources on attainment in the UK
Research using the NCDS
Study Outcome vari ables R esults Feinst ein a n d Symons, 19 99 Academic attainme nt No impa
ct of the sc
hool pupil – teac he r ra tio. Dust mann, Ra jah and va
n Soest, 2003
Academic attainment Care
er c
h
oi
ce
An inc
rease in the sch
o ol p u pil– teac he r ra
tio by on
e sta
n
da
rd deviati
on
decreases the probabili
ty
that
pupils stay in ed
ucati
o
n past the c
o mp uls o ry sc h o ol-l ea ving ag
e by about 4
per ce n tage p o in ts.
Dearden, Ferri and Me
gh
ir
, 20
02
Academic attainment Wages at age
s 23 and 3
3
No impa
ct of the sc
hool pupil – teac he r ra tio f o
r men. Signifi
cant eff
e
ct of the sc
hool p u pil – teac h e r rati on w o me n’ s wages at age 33, pa rtic ula rl y for t h os e of low a b ility.
Research using the NPD
Study Outcome vari ables R esults Hol m lu nd, M cNally an d Viare n go , 2 0 08 KS2 attai n me
nt (age 1
0
–
11)
£1,
00
0 in ave
rage ex pe ndi ture per p u pil inc reases the p
roportion of p
u
pi
ls achievi
n
g the e
x pe ct e d leve of attai n me nt
at KS2 by 2.2
, 2.0 and 0.
7 per
centa
ge points in Englis
h, Maths and
Science.
Disadvan
taged scho
ol
s gain m
o re fro m extra resou rces in Engl ish, bu t l e ss
in Science and Ma
ths.
Pupils eligible for FSM
gain
more in
E
n
g
lish and Ma
ths,
but less in Science.
High-abi
lity stude
n
ts gain
more in al
l subje cts. Leva č i ć e
t al., 20
05
KS3 attai
n
me
nt (age 1
3 – 14) Sp e n d ing £1 00 mo re pe r pup il r a ise s p u p il attainme nt a
t KS3 by 0.
04
of a KS lev
e
l.
Red
u
cing the
school PTR by
1 pupil raises pupi
l attai
n
m
e
nt
by 0.1 of a level i
n
Mat
h
s and 0.1
2
of
a level
in Science, but no signific
a n t effe cts f o r E n g lish. Thos
e in t
h e mid d le of t h e ability dis tri b u ti on gai n m o re.
Those in t
h e h ighest abi lity qui n til e wh
o are eli
g
ible for FSM gain
more. Jenkins, Leva č i ć and Vig nol e s, 2 006 GCSE attai n ment (ag e 15 – 16 ) Red u cing the
school PTR by
1 pupil f
o
r al
l five years
of se co nda ry s ch o o l rais es pu p il attain me nt by at most 1.2 GCS E grad es and woul d req u ir e spendi n g arou
nd £127 extra per annu
m
per pupil
.
Those in b
o
tt
o
m
60
% of t
h
e ability distri
bution gain more. No sig n if ic an t d if fe re nc e s be tw ee n th o se e ligi b le a n d t h os e no t eligi b le f o r FSM. Machi n , McN a lly an d Me gh ir , 20 04
Maths and English attai
n
m
e
nt
at KS3 (age 1
3 – 14) Absen teeism Average e ffe
ct of p
rogra
mme was an incr
ease in Mat
h
s attainment of ab
out 0.5
–
0.8 of a p
e rc e n til e The num b e
r of
half-d
ays missed by pupils
in una ut horised abse nc es decr
eased by 3
0
Theory and empirical evidence
Recent evidence from the UK
In the current school funding system, resources are not allocated randomly; they are determined by pupil characteristics (including attainment levels). This causes a problem in using actual differences in funding across schools to isolate the impact of resources. For instance, since deprived and low-achieving schools tend to receive higher levels of funding, a simple correlation of funding and average attainment would probably lead one to (falsely) conclude that higher funding reduces attainment. The correlation is simply the result of the school funding system targeting resources at measures of educational disadvantage. To get around this reverse causality problem (sometimes referred to as the ‘endogeneity’ of school resources), a more recent group of academic papers in the UK have attempted to isolate the impact of school resources on pupil attainment by using an ‘instrument’ – an exogenous or random change in the level of school resources. These studies use administrative data on pupils’ attainment from the National Pupil Database (NPD), as well as school finance data. Each study is summarised in Table 3.1.
Holmlund, McNally and Viarengo (2008) investigate the impact of extra resources for schools on pupils’ attainment in their Key Stage 2 (KS2) exams, taken at the end of primary school in England when pupils are aged 10–11. They present results from a multivariate regression (a statistical model that controls for multiple explanatory factors) that they believe accounts for most of the endogeneity problem. As an alternative
strategy, they also use data on a subsample of local authorities, which contain
information about how they distribute funding to schools and how their funding formulae change over time. This strategy essentially measures the effect of an increase in school resources by comparing schools in one local authority (LA) with equally-deprived schools in another LA that allocates more or less resources on the basis of deprivation in its local formulae. The main results of the paper suggest that an increase of £1,000 in average expenditure per pupil would increase the number of pupils achieving the expected level of attainment at KS2 by 2.2, 2.0 and 0.7 percentage points in English, Maths and Science respectively. These figures are roughly equal to 3, 2.5 and 1.5 weeks’ worth of progress in the three subjects, which may be considered a small impact given the associated costs.
The authors find positive and statistically significant effects for most subgroups, but there is some variation in the estimated impacts of expenditure: disadvantaged schools19 gain
more from extra resources in English, but less in Science and Maths; pupils eligible for free schools meals (FSM) gain more in English and Maths, but less in Science; there is a stronger effect of expenditure on high-ability students in all subjects.
Levačić et al. (2005) ask whether attainment in Key Stage 3 (KS3) exams, taken in state schools in England when pupils are aged 13–14, is affected by the level of school
resources. They attempt to overcome the problem of endogeneity of school resources by looking at the political affiliation of the local authority. They argue that political affiliation affects the financing of schools but is not related to the characteristics of pupils and parents. Under these assumptions, political affiliation can therefore be used to isolate the effect of resources on attainment. Using this strategy, the authors find that spending £100 more per pupil raises pupil attainment at KS3 by 0.04 of a Key Stage level, while reducing the school PTR by one pupil raises pupil attainment by 0.1 of a level in Maths and 0.12 of a level in Science, but there are no significant effects for English. They conclude that
19
additional spending to reduce the student–teacher ratio is more effective than an increase in general expenditure. Focusing on subgroups of the student population, they find that those in the middle of the ability distribution, and those in the highest ability quintile who are eligible for FSM, gain more from an increase in school resources.
Jenkins, Levačić and Vignoles (2006) ask whether attainment at GCSE is affected by the level of school resources. They use the same strategy as Levačić et al. described above (using the political affiliation of the LA to isolate the effect of school resources). They also find that reducing the school PTR is more effective than increasing the general spending on the school, although the effect of reducing the PTR from current levels by one pupil over the five-year duration of secondary school is very small (at most 1.2 GCSE grades) and would require spending around £127 extra per annum per pupil. They find that students from the bottom 60% of the prior achievement distribution gain more from an increase in the school’s resources, but that there was no significant difference in the impact between those who were eligible for FSM and those who were not.
The Excellence in Cities (EiC) programme was an initiative launched under the Labour government in 1999 that aimed to alleviate poor student attainment in disadvantaged urban areas. It is therefore highly relevant to a discussion of the pupil premium. EiC gives extra funding to schools in the programme, but also has additional aims such as
encouraging cooperation between schools in the dissemination of knowledge. Machin, McNally and Meghir (2004) evaluate whether student attainment in Maths and English at KS3 improved as a result of EiC, and also look at the impact of EiC on unauthorised absences from school. Their method matches schools that received the extra funding with similar schools that did not. Comparing the attainment in the ‘treatment’ and
‘comparison’ groups gives a reliable estimate for the impact of EiC. The authors find that attainment in Maths increased in schools in the EiC programme, but their results were less statistically significant for English. The average effect of EiC was an increase in Maths attainment of about 0.5 to 0.8 of a percentile. There was also a significant reduction in unauthorised absences: the number of half-days missed decreased by 30%.
This evidence gives encouraging signs for the benefits of increasing school resources. The impacts following the EiC programme cannot be interpreted as the direct result of an increase in funds, however. This is because the additional expenditure was tied to many strands of the project, such as investment in Learning Mentors, Learning Support Units and a Gifted and Talented Programme within the schools, as well as capital investment in ‘City Learning Centres’ to promote school and community learning. A pupil premium, by contrast, would be applicable to all schools (not just urban ones) and funding is unlikely to be tied to any particular interventions.