Statistical
Release
24th May 2012
Coverage: England
Theme: Children, Education and Skills
OSR 09/2012
Issued by
Department for Education Sanctuary Buildings Great Smith Street London SW1P 3BT
Telephone: Press Office
020 7925 6789
Public Enquiries
0870 000 2288
Statistician
Emily Uttley 0114 274 2442
info@education.gsi.gov.uk
Internet
http://www.education.gov.u k/rsgateway/DB/STR/d001 064/index.shtml
NEET Statistics - Quarterly Brief – Quarter 1 2012 May 2012
Introduction
This note sets out the available statistics on young people not in education, employment or training (NEET) and young people not in education or training (NET) from three data sources:
i) Statistical First Release (SFR)
These are the authoritative national estimates of NEET and NET rates. They are published annually in the ‘Participation in Education, Training and
Employment by 16-18 Year Olds in England’ SFR. These data are only available annually and cannot be disaggregated to sub-national levels.
ii) Quarterly Labour Force Survey (LFS)
Analysis of the LFS allows in-year estimates to be made of NEET and NET trends as well as estimates for other age groups, including 16-24, 18-24 and 19-24. The quarterly LFS estimates cannot be directly compared with the headline SFR series which is based on more detailed but less timely data.
The most recent LFS based estimates for NEET are from Quarter 1 2012 which are shown in following table.
Table: NEET rates for different age cohorts
Quarter
1 2010
Quarter 1 2011
Quarter 1 2012
% point change from Q1 2011 to Q1 2012
Age 16 5.0% 5.0% 6.1% +1.1
Age 17 8.8% 8.0% 9.0% +1.0
Age 18 16.6% 12.0% 14.3% +2.3
Age 16-18 10.1% 8.3% 9.8% +1.5
Age 19-24 17.8% 18.5% 18.5% 0.0
Age 16-24 15.4% 15.3% 15.8% +0.5
Source: Labour Force Survey Quarter 1
iii) Local Authorities’ Client Caseload Information System (CCIS).
CCIS is the management information data that results from the duty for all Local Authorities to track the activity of young people aged 16-19 years old resident in their area. Data can be aggregated to provide estimates for regions within England.
The data from all three sources cover England.
Section 1- Trends. Focuses on the key trends in the NEET and NET data series for 16-18 year olds.
Section 2-Methodology and Notes. Explains the methodology used to derive the different series, and gives guidance on their usage.
1. Trends
Historical Context
Understanding the historical trends in NEET rates is an important part of placing current performance in perspective. In order to do so, we have to use historical LFS data that is not directly comparable with any other series in this note, and so should be used as context only. Unfortunately, due to data issues, estimates for 1986 and 1987 are unavailable. The chart below also shows the NEET SFR measure for comparison.
The current proportion of young people aged 16-18 who are NEET is much lower than in the 1980s, and has declined since a recent peak in 2005.
Chart 1: NEET historical series for 16-18 year olds
0% 2% 4% 6% 8% 10% 12% 14% 16% 18% 20% E nd 19 84 E nd 19 85 E nd 19 86 E nd 19 87 E nd 19 88 E nd 19 89 E nd 19 90 E nd 19 91 E nd 19 92 E nd 19 93 E nd 19 94 E nd 19 95 E nd 19 96 E nd 19 97 E nd 19 98 E nd 19 99 E nd 20 00 E nd 20 01 E nd 20 02 E nd 20 03 E nd 20 04 E nd 20 05 E nd 20 06 E nd 20 07 E nd 20 08 E nd 20 09 E nd 20 10 E nd 20 11
a. NEET SFR measure b. NEET Quarterly LFS
Source: Statistical First Release (SFR) ‘Participation in Education, Training and Employment by 16-18 Year Olds in England’ and analysis of Labour Force Survey (LFS).
Note on LFS estimates:
Annual data sets are used for 1984 to 1991. Quarter 4 data is used from 1992 onwards.
Between 1992 and 1994 the data does not exclude individuals answering yes to the qulnow variable, and between 1995 and 1999 individuals sampled in December were not asked the qulnow variable. This may mean that between 1992 and 1999 the proportion NEET is very slightly over-estimated.
a. NEET SFR series (last updated June 2011)
The Department’s Statistical First Release (SFR) ‘Participation in Education, Training and Employment by 16-18 Year Olds in England’ is the primary source of national data on 16-18 year olds NEET.
The latest SFR NEET rate for 16-18 year olds, at end 2010, was 7.3 percent; the lowest level since consistent records began in 1994. This was partially due to the first year-on-year increase in the employment rate for 16-18 year olds not in education or training since 2007. Participation in education and training continued to rise: between 2002 and 2010 participation in education and training amongst 16-18 year olds rose every year, causing the size of the NET group to fall from 25.0% to 15.6%.
Chart 2: a. NEET SFR series, age 16-18 0% 2% 4% 6% 8% 10% 12% E n d 19 99 E n d 20 00 E n d 20 01 E n d 20 02 E n d 20 03 E n d 20 04 E n d 20 05 E n d 20 06 E n d 20 07 E n d 20 08 E n d 20 09 E n d 20 10
Source Statistical First Release (SFR) ‘Participation in Education, Training and Employment by 16-18 Year Olds in England’
b. NEET quarterly LFS series (last updated May 2012)
We can monitor trends in NEET rates between the publications of the SFR series using quarterly LFS data.
The trend data for 16-18 year olds shows seasonal patterns that reflect the academic year: lower rates in autumn (Quarter 4, October to December) followed by a gradual rise in spring and early summer (Quarters 1 & 2, January to June) with a peak in late summer (Quarter 3, July to September).
Chart 3: b. NEET Quarterly LFS Series, age 16-18
0% 2% 4% 6% 8% 10% 12% 14% 16% Q 4 2 005 Q 1 2 006 Q 2 2 006 Q 3 2 006 Q 4 2 006 Q 1 2 007 Q 2 2 007 Q 3 2 007 Q 4 2 007 Q 1 2 008 Q 2 2 008 Q 3 2 008 Q 4 2 008 Q 1 2 009 Q 2 2 009 Q 3 2 009 Q 4 2 009 Q 1 2 010 Q 2 2 010 Q 3 2 010 Q 4 2 010 Q 1 2 011 Q 2 2 011 Q 3 2 011 Q 4 2 011 Q 1 2 012
a. NEET SFR series b. NEET Quarterly LFS
- Bars around data points indicate approximate 95% confidence intervals
Source: Quarterly Labour Force Survey
The latest data show that the proportion of 16-18 year olds NEET increased by 1.5 percentage points, to 9.8% in the first quarter of 2012, compared to the first quarter of 2011. This increase is statistically significant.
The proportion of 16-18 year olds NET was stable between Quarter 1 2011 and Quarter 1 2012 (see section 1.e.). As such we can explain the increase in the proportion of 16-18 year olds NEET by a falling employment rate for young people not in education and training over that period – it fell from 50% to 41%, a decrease that is statistically significant.
There is some evidence for an increasing seasonality in the NEET data. Comparing Q4 troughs to the following Q3 peak (and so, roughly, the same cohort of young people), the difference averaged 3.0 percentage points from 2001 to 2009, with a range of 2.5-3.5 percentage points. From Q4 2009 to Q3 2010 the difference was 4.5 percentage points, increasing further from Q4 2010 to Q3 2011 to 5.4 percentage points.
c. Regional NEET (last updated April 2012)
The regional picture on 16-18 NEET is taken from Local Authorities’ Client Caseload Information System(CCIS).
CCIS data indicates that the northern regions have higher NEET rates, i.e. Yorkshire and Humberside, North West and North East, within England. In comparison, London and East Midlands have the lowest NEET rates.
Note that CCIS data tend to show a lower percentage NEET than either the SFR or LFS data sources.
Chart 4: c. Regional NEET, age 16-18 Nov 2011 - Jan 2012 av e rage
0% 1% 2% 3% 4% 5% 6% 7% 8% 9% 10%
South East
London East of England
South West
West Midlands
East Midlands
Yorks & Humber
North West
North East
Source: Client Caseload Information System
d. NET SFR series (last updated June 2011)
When looking at NEET data, it is also important to contextualise it with data on the proportion of young people not in education or training (NET). These data are also taken from the SFR ‘Participation in Education, Training and Employment by 16-18 Year Olds in England’.
Chart 5: d. NET SFR s eries , age 16-18
0% 5% 10% 15% 20% 25% 30%
End 1999
End 2000
End 2001
End 2002
End 2003
End 2004
End 2005
End 2006
End 2007
End 2008
End 2009
End 2010
Source: Statistical First Release (SFR) ‘Participation in Education, Training and Employment by 16-18 Year Olds in England’
The latest data, for end 2010, showed the lowest level of the SFR NET rate for 16-18 year olds since consistent records began in 1994, and the eighth successive annual fall since 2002.
e. NET quarterly LFS series (last updated May 2012)
As with the NEET data, we can look at the in-year NET trend data using the quarterly LFS. The same seasonal pattern to the NET figures exists as in the NEET series.
The proportion of 16-18 year olds NET remained stable at 16.6% in the first quarter of 2012; it decreased by less than 0.1 percentage points, compared to the first quarter of 2011.
Chart 6: e. NET Quarterly LFS series, age 16-18
0% 5% 10% 15% 20% 25% 30% 35%
Q
4 2005 Q1 2006 Q2 2006 Q3 2006 Q4 2006 Q1 2007 2 2007Q Q3 2007 Q4 2007 Q1 2008 Q2 2008 Q3 2008 Q4 2008 Q1 2009 Q2 2009 Q3 2009 Q4 2009 Q1 2010 Q2 2010 3 2010Q Q4 2010 Q1 2011 Q2 2011 Q3 2011 Q4 2011 Q1 2012
- Bars around data points indicate approximate 95% confidence intervals
d. NET SFR series
e. NET Quarterly LFS series
2. Methodology and Notes
a. NEET and NET SFR series
Description These data give the definitive measures for 16-18 NEET and NET rates in England.
Uses These series should be used as the national time series for 16-18 year olds NEET and NET in England. The NET series should be used as context for any NEET data.
Geographical Coverage England
Age coverage Academic age 16 to 18
Published source Statistical First Release (SFR) ‘Participation in Education, Training and Employment by 16-18 Year Olds in England’ Primary sources The Schools' Census
Pupil Level Annual Schools’ Census The Individualised Learner Record (ILR) Higher Education Statistics Agency (HESA).
Higher Education Students Early Statistics (HESES) Labour Force Survey
Mid-year estimates and projections of population from the Office for National Statistics (ONS) and the Government Actuary's Department (GAD).
Last period covered End 2010 Last published June 2011 Next published June 2012
b. NEET and NET quarterly LFS series
Description These series are quarterly estimates of NEET and NET amongst young people from the LFS. It is not directly comparable with the SFR measure.
Uses These series provide more timely data on the recent trends in NEET and NET since the last SFR. Trends should be assessed by comparing the current quarter with the same quarter in the previous year to account for seasonal effects. Quarter on quarter changes, i.e. Quarter 4 to Quarter 1, should not be quoted. The NET series should be used as context for any NEET data.
Geographical coverage England
Age coverage Academic age 16 to 24
Published source Quarterly Labour Force Survey Primary sources Quarterly Labour Force Survey Last Period Covered Quarter 1 2012
c. Regional NEET
Description This series is a 3 month average snapshot estimate of the regional NEET rate taken from the Local Authority Client Caseload
Information System (CCIS) data. It is neither directly comparable with the LFS nor the SFR series due to the use of ‘currency’ rules. The activity status of young people in education or employment is not actively checked every month, but has a shelf life depending on the type of educational course or the nature of the employment. For young people whose currency is lapsed a historical assumption is made on the proportion NEET, taking into account their
previously reported activity.
Full details are published in a technical specification available here: NCCIS management information requirement
The combination of both factors leads to estimates of NEET in the CCIS data that tend to be lower than those estimated from the LFS or those reported in the annual Statistical First Release (SFR). Uses This series shows the data, aggregated in regions, used by Local
Authorities to inform local activity and target setting. Geographical Coverage England
Age coverage Academic age 16 to 18 (previously calendar age)
Published source Management information published on the DfE website as policy data: 16- to 18-year-olds NEET
Primary sources Client Caseload Information System (CCIS) Last Period Covered November 2011 – January 2012 average. Last published April 2012
d. Equivalent statistics from the Welsh Assembly Government, Scottish Government and the Office for National Statistics (ONS)
Welsh Assembly Government (WG) Scottish Government (SG) Office for National Statistics
(ONS) 1. Annual SFR statistics produced in a
method analogous to the DfE annual SFR.
1. Statistics based on the Annual Population Survey (APS).
2. Statistics based on the Annual Population Survey (APS). Definition of NEET corresponds to that used in the DfE NEET Quarterly Brief
2. Annual school leaver statistics Description
3. Pupil destinations based on Careers Wales Survey.
3. Combination of DWP benefits data and school leaver
destinations
Monthly Labour Force Survey (LFS) statistics for young people not in full-time education and not in employment -Table 14 from the Labour Market Statistics bulletin.
1. Regarded as the definitive measure of headline NEET estimates in Wales.
1. National estimates of NEET.
2. Timely data; regional or single-age estimates based on averaging 3 years of data.
2. Proportion of young people in 'positive destinations'. The complement is roughly equivalent to NEET, but will include some young people in part-time education.
Uses
3. Local area estimates of NEET. 3. Local area estimates of NEET.
Part of wider labour market statistics; rolling 3-month average both adjusted and not seasonally-adjusted; roughly equivalent to NEET but will include some young people in part-time education.
Geographical Coverage
Wales Scotland United Kingdom (UK)
Age coverage Academic age 16-18, 19-24 (SFR);
academic age 16-18, 19-24 (APS); interviews in October following Year 11 (Careers Wales)
Actual age 16-19. Actual age 16-17 and 18-24.
1. Welsh Government | Participation of Young People in Education and the Labour Market, 2009 and 2010 (provisional)
1. Local Area Labour Markets in Scotland: Statistics from the Annual Population Survey 2009
2. Young People Not in Education, Employment or Training (NEET), Year to 30 September 2011
2. Summary statistics for attainment, leaver destinations and school meals, No. 1: 2011 Edition
Published source
3. Pupil Destinations from Schools in Wales, 2011
3. More Choices More Chances
3. Tables
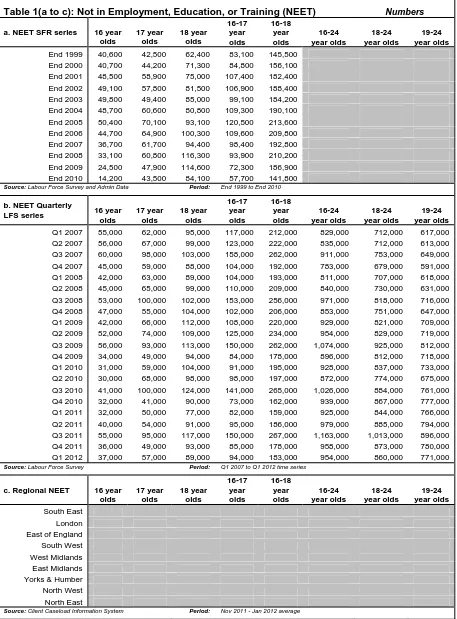
Table 1(a to c): Not in Employment, Education, or Training (NEET) Numbers
a. NEET SFR series 16 year olds
17 year olds
18 year olds
16-17 year olds
16-18 year olds
16-24 year olds
18-24 year olds
19-24 year olds
End 1999 40,600 42,500 62,400 83,100 145,500 End 2000 40,700 44,200 71,300 84,800 156,100 End 2001 48,500 58,900 75,000 107,400 182,400 End 2002 49,100 57,800 81,500 106,900 188,400 End 2003 49,800 49,400 85,000 99,100 184,200 End 2004 48,700 60,600 80,800 109,300 190,100 End 2005 50,400 70,100 93,100 120,500 213,600 End 2006 44,700 64,900 100,300 109,600 209,800 End 2007 36,700 61,700 94,400 98,400 192,800 End 2008 33,100 60,800 116,300 93,900 210,200 End 2009 24,500 47,900 114,600 72,300 186,900 End 2010 14,200 43,500 84,100 57,700 141,800
Source: Labour Force Survey and Admin Data Period: End 1999 to End 2010
b. NEET Quarterly
LFS series 16 year olds
17 year olds
18 year olds
16-17 year olds
16-18 year olds
16-24 year olds
18-24 year olds
19-24 year olds
Q1 2007 55,000 62,000 95,000 117,000 212,000 829,000 712,000 617,000 Q2 2007 56,000 67,000 99,000 123,000 222,000 835,000 712,000 613,000 Q3 2007 60,000 98,000 103,000 158,000 262,000 911,000 753,000 649,000 Q4 2007 45,000 59,000 88,000 104,000 192,000 783,000 679,000 591,000 Q1 2008 42,000 63,000 89,000 104,000 193,000 811,000 707,000 618,000 Q2 2008 45,000 65,000 99,000 110,000 209,000 840,000 730,000 631,000 Q3 2008 53,000 100,000 102,000 153,000 256,000 971,000 818,000 716,000 Q4 2008 47,000 55,000 104,000 102,000 206,000 853,000 751,000 647,000 Q1 2009 42,000 66,000 112,000 108,000 220,000 929,000 821,000 709,000 Q2 2009 52,000 74,000 109,000 125,000 234,000 954,000 829,000 719,000 Q3 2009 56,000 93,000 113,000 150,000 262,000 1,074,000 925,000 812,000 Q4 2009 34,000 49,000 94,000 84,000 178,000 896,000 812,000 718,000 Q1 2010 31,000 59,000 104,000 91,000 195,000 928,000 837,000 733,000 Q2 2010 30,000 68,000 98,000 98,000 197,000 872,000 774,000 675,000 Q3 2010 41,000 100,000 124,000 141,000 265,000 1,026,000 884,000 761,000 Q4 2010 32,000 41,000 90,000 73,000 162,000 939,000 867,000 777,000 Q1 2011 32,000 50,000 77,000 82,000 159,000 925,000 844,000 766,000 Q2 2011 40,000 54,000 91,000 95,000 186,000 979,000 885,000 794,000 Q3 2011 55,000 95,000 117,000 150,000 267,000 1,163,000 1,013,000 896,000 Q4 2011 36,000 49,000 93,000 85,000 178,000 958,000 873,000 780,000 Q1 2012 37,000 57,000 89,000 94,000 183,000 954,000 860,000 771,000
Source: Labour Force Survey Period: Q1 2007 to Q1 2012 time series
c. Regional NEET 16 year olds
17 year olds
18 year olds
16-17 year olds
16-18 year olds
16-24 year olds
18-24 year olds
19-24 year olds
South East
London
East of England
South West
West Midlands
East Midlands
Yorks & Humber
North West
North East
Source: Client Caseload Information System Period: Nov 2011 - Jan 2012 average
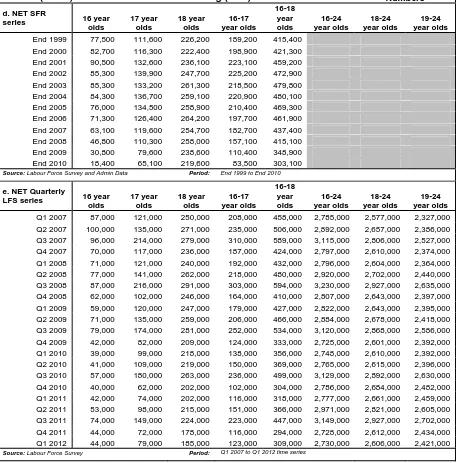
[image:9.595.58.515.140.759.2]Table 2 (d to e): Not in Education and Training (NET) Numbers
d. NET SFR
series 16 year olds
17 year olds
18 year olds
16-17 year olds
16-18 year olds
16-24 year olds
18-24 year olds
19-24 year olds
End 1999 77,500 111,600 226,200 189,200 415,400
End 2000 82,700 116,300 222,400 198,900 421,300
End 2001 90,500 132,600 236,100 223,100 459,200
End 2002 85,300 139,900 247,700 225,200 472,900
End 2003 85,300 133,200 261,300 218,500 479,800
End 2004 84,300 136,700 259,100 220,900 480,100
End 2005 76,000 134,500 258,900 210,400 469,300
End 2006 71,300 126,400 264,200 197,700 461,900
End 2007 63,100 119,600 254,700 182,700 437,400
End 2008 46,800 110,300 258,000 157,100 415,100
End 2009 30,800 79,600 238,600 110,400 348,900
End 2010 18,400 65,100 219,600 83,500 303,100 Source: Labour Force Survey and Admin Data Period: End 1999 to End 2010
e. NET Quarterly
LFS series 16 year olds
17 year olds
18 year olds
16-17 year olds
16-18 year olds
16-24 year olds
18-24 year olds
19-24 year olds
Q1 2007 87,000 121,000 250,000 208,000 458,000 2,785,000 2,577,000 2,327,000 Q2 2007 100,000 135,000 271,000 235,000 506,000 2,892,000 2,657,000 2,386,000 Q3 2007 96,000 214,000 279,000 310,000 589,000 3,115,000 2,806,000 2,527,000 Q4 2007 70,000 117,000 236,000 187,000 424,000 2,797,000 2,610,000 2,374,000 Q1 2008 71,000 121,000 240,000 192,000 432,000 2,796,000 2,604,000 2,364,000 Q2 2008 77,000 141,000 262,000 218,000 480,000 2,920,000 2,702,000 2,440,000 Q3 2008 87,000 216,000 291,000 303,000 594,000 3,230,000 2,927,000 2,635,000 Q4 2008 62,000 102,000 246,000 164,000 410,000 2,807,000 2,643,000 2,397,000 Q1 2009 59,000 120,000 247,000 179,000 427,000 2,822,000 2,643,000 2,395,000 Q2 2009 71,000 135,000 259,000 206,000 466,000 2,884,000 2,678,000 2,418,000 Q3 2009 79,000 174,000 281,000 252,000 534,000 3,120,000 2,868,000 2,586,000 Q4 2009 42,000 82,000 209,000 124,000 333,000 2,725,000 2,601,000 2,392,000 Q1 2010 39,000 99,000 218,000 138,000 356,000 2,748,000 2,610,000 2,392,000 Q2 2010 41,000 109,000 219,000 150,000 369,000 2,765,000 2,615,000 2,396,000 Q3 2010 57,000 180,000 263,000 236,000 499,000 3,129,000 2,892,000 2,630,000 Q4 2010 40,000 62,000 202,000 102,000 304,000 2,786,000 2,684,000 2,482,000 Q1 2011 42,000 74,000 202,000 116,000 318,000 2,777,000 2,661,000 2,459,000 Q2 2011 53,000 98,000 215,000 151,000 366,000 2,971,000 2,821,000 2,605,000 Q3 2011 74,000 149,000 224,000 223,000 447,000 3,149,000 2,927,000 2,702,000 Q4 2011 44,000 72,000 178,000 116,000 294,000 2,728,000 2,612,000 2,434,000 Q1 2012 44,000 79,000 185,000 123,000 309,000 2,730,000 2,606,000 2,421,000
Source: Labour Force Survey Period: Q1 2007 to Q1 2012 time series
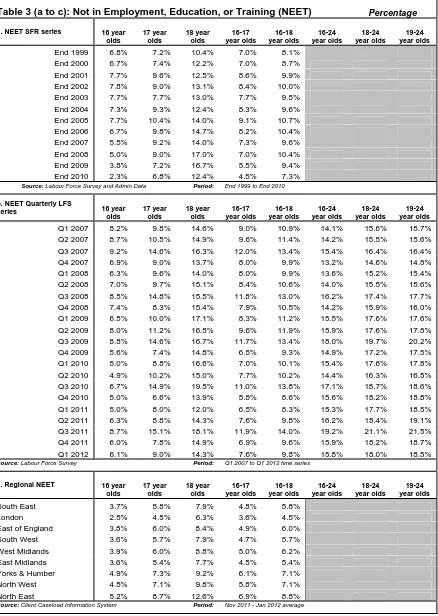
[image:10.595.59.515.138.601.2]Table 3 (a to c): Not in Employment, Education, or Training (NEET) Percentage
a. NEET SFR series 16 year olds
17 year olds
18 year olds
16-17 year olds
16-18 year olds
16-24 year olds
18-24 year olds
19-24 year olds End 1999 6.8% 7.2% 10.4% 7.0% 8.1%
End 2000 6.7% 7.4% 12.2% 7.0% 8.7%
End 2001 7.7% 9.6% 12.5% 8.6% 9.9%
End 2002 7.8% 9.0% 13.1% 8.4% 10.0%
End 2003 7.7% 7.7% 13.0% 7.7% 9.5%
End 2004 7.3% 9.3% 12.4% 8.3% 9.6%
End 2005 7.7% 10.4% 14.0% 9.1% 10.7%
End 2006 6.7% 9.8% 14.7% 8.2% 10.4%
End 2007 5.5% 9.2% 14.0% 7.3% 9.6%
End 2008 5.0% 9.0% 17.0% 7.0% 10.4%
End 2009 3.8% 7.2% 16.7% 5.5% 9.4%
End 2010 2.3% 6.8% 12.4% 4.5% 7.3% Source: Labour Force Survey and Admin Data Period: End 1999 to End 2010
b. NEET Quarterly LFS
series 16 year
olds
17 year olds
18 year olds
16-17 year olds
16-18 year olds
16-24 year olds
18-24 year olds
19-24 year olds Q1 2007 8.2% 9.8% 14.6% 9.0% 10.9% 14.1% 15.6% 15.7% Q2 2007 8.7% 10.5% 14.9% 9.6% 11.4% 14.2% 15.5% 15.6% Q3 2007 9.2% 14.6% 16.3% 12.0% 13.4% 15.4% 16.4% 16.4% Q4 2007 6.9% 9.0% 13.7% 8.0% 9.9% 13.2% 14.6% 14.8% Q1 2008 6.3% 9.6% 14.0% 8.0% 9.9% 13.6% 15.2% 15.4% Q2 2008 7.0% 9.7% 15.1% 8.4% 10.6% 14.0% 15.5% 15.6% Q3 2008 8.5% 14.8% 15.5% 11.8% 13.0% 16.2% 17.4% 17.7% Q4 2008 7.4% 8.3% 15.4% 7.9% 10.5% 14.2% 15.9% 16.0% Q1 2009 6.5% 10.0% 17.1% 8.3% 11.2% 15.5% 17.6% 17.6% Q2 2009 8.0% 11.2% 16.5% 9.6% 11.9% 15.9% 17.6% 17.8% Q3 2009 8.8% 14.6% 16.7% 11.7% 13.4% 18.0% 19.7% 20.2% Q4 2009 5.6% 7.4% 14.8% 6.5% 9.3% 14.9% 17.2% 17.5% Q1 2010 5.0% 8.8% 16.6% 7.0% 10.1% 15.4% 17.6% 17.8% Q2 2010 4.9% 10.2% 15.0% 7.7% 10.2% 14.4% 16.3% 16.5% Q3 2010 6.7% 14.9% 19.5% 11.0% 13.8% 17.1% 18.7% 18.6% Q4 2010 5.0% 6.6% 13.9% 5.8% 8.6% 15.6% 18.2% 18.8% Q1 2011 5.0% 8.0% 12.0% 6.5% 8.3% 15.3% 17.7% 18.5% Q2 2011 6.3% 8.8% 14.3% 7.6% 9.8% 16.2% 18.4% 19.1% Q3 2011 8.7% 15.1% 18.1% 11.9% 14.0% 19.2% 21.1% 21.5% Q4 2011 6.0% 7.8% 14.9% 6.9% 9.6% 15.9% 18.2% 18.7% Q1 2012 6.1% 9.0% 14.3% 7.6% 9.8% 15.8% 18.0% 18.5%
Source: Labour Force Survey Period: Q1 2007 to Q1 2012 time series
c. Regional NEET 16 year olds
17 year olds
18 year olds
16-17 year olds
16-18 year olds
16-24 year olds
18-24 year olds
19-24 year olds South East 3.7% 5.8% 7.9% 4.8% 5.8%
London 2.5% 4.5% 6.3% 3.6% 4.5%
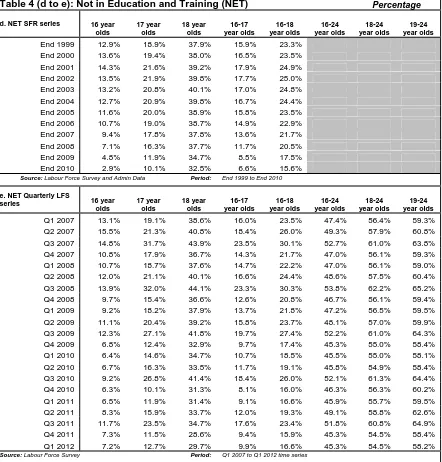
[image:11.595.65.503.123.739.2]Table 4 (d to e): Not in Education and Training (NET) Percentage
d. NET SFR series 16 year olds
17 year olds
18 year olds
16-17 year olds
16-18 year olds
16-24 year olds
18-24 year olds
19-24 year olds End 1999 12.9% 18.9% 37.9% 15.9% 23.3%
End 2000 13.6% 19.4% 38.0% 16.5% 23.5%
End 2001 14.3% 21.6% 39.2% 17.9% 24.9%
End 2002 13.5% 21.9% 39.8% 17.7% 25.0%
End 2003 13.2% 20.8% 40.1% 17.0% 24.8%
End 2004 12.7% 20.9% 39.8% 16.7% 24.4%
End 2005 11.6% 20.0% 38.9% 15.8% 23.5%
End 2006 10.7% 19.0% 38.7% 14.9% 22.9%
End 2007 9.4% 17.8% 37.8% 13.6% 21.7%
End 2008 7.1% 16.3% 37.7% 11.7% 20.5%
End 2009 4.8% 11.9% 34.7% 8.5% 17.5%
End 2010 2.9% 10.1% 32.5% 6.6% 15.6% Source: Labour Force Survey and Admin Data Period: End 1999 to End 2010
e. NET Quarterly LFS
series 16 year
olds
17 year olds
18 year olds
16-17 year olds
16-18 year olds
16-24 year olds
18-24 year olds
19-24 year olds Q1 2007 13.1% 19.1% 38.6% 16.0% 23.5% 47.4% 56.4% 59.3% Q2 2007 15.5% 21.3% 40.8% 18.4% 26.0% 49.3% 57.9% 60.8% Q3 2007 14.8% 31.7% 43.9% 23.5% 30.1% 52.7% 61.0% 63.8% Q4 2007 10.8% 17.9% 36.7% 14.3% 21.7% 47.0% 56.1% 59.3% Q1 2008 10.7% 18.7% 37.6% 14.7% 22.2% 47.0% 56.1% 59.0% Q2 2008 12.0% 21.1% 40.1% 16.6% 24.4% 48.6% 57.5% 60.4% Q3 2008 13.9% 32.0% 44.1% 23.3% 30.3% 53.8% 62.2% 65.2% Q4 2008 9.7% 15.4% 36.6% 12.6% 20.8% 46.7% 56.1% 59.4% Q1 2009 9.2% 18.2% 37.9% 13.7% 21.8% 47.2% 56.5% 59.5% Q2 2009 11.1% 20.4% 39.2% 15.8% 23.7% 48.1% 57.0% 59.9% Q3 2009 12.3% 27.1% 41.8% 19.7% 27.4% 52.2% 61.0% 64.3% Q4 2009 6.8% 12.4% 32.9% 9.7% 17.4% 45.3% 55.0% 58.4% Q1 2010 6.4% 14.6% 34.7% 10.7% 18.5% 45.5% 55.0% 58.1% Q2 2010 6.7% 16.3% 33.5% 11.7% 19.1% 45.8% 54.9% 58.4% Q3 2010 9.2% 26.8% 41.4% 18.4% 26.0% 52.1% 61.3% 64.4% Q4 2010 6.3% 10.1% 31.3% 8.1% 16.0% 46.3% 56.3% 60.2% Q1 2011 6.5% 11.9% 31.4% 9.1% 16.6% 45.9% 55.7% 59.5% Q2 2011 8.3% 15.9% 33.7% 12.0% 19.3% 49.1% 58.8% 62.6% Q3 2011 11.7% 23.5% 34.7% 17.6% 23.4% 51.8% 60.8% 64.9% Q4 2011 7.3% 11.5% 28.6% 9.4% 15.9% 45.3% 54.5% 58.4% Q1 2012 7.2% 12.7% 29.7% 9.9% 16.6% 45.3% 54.5% 58.2%
Source: Labour Force Survey Period: Q1 2007 to Q1 2012 time series
Additional tables are published with this brief – these show a regional breakdown of the quarterly NEET statistics for 16-24, 18-24 and 19-24 year olds, and time-series data from 2001. Please see the DfE Q1
[image:12.595.62.504.131.593.2]