Page 1 of 81
Forecasting Child Poverty in Scotland
A report for the Scottish Government by
Howard Reed, Landman Economics and Graham Stark, Virtual Worlds Research
Page 2 of 81
Table of Contents
Acknowledgements ... 5
Chapter 1. Introduction ... 6
1.1 Outline of the report ... 6
1.2 The Child Poverty (Scotland) Act 2017 ... 7
1.3 The Welfare Reform and Work Act 2016 ... 7
1.4 Reductions in the generosity of social security payments ... 8
1.5 Universal Credit ... 8
1.6 Devolved Social Security Powers ... 8
1.7 Devolved Income Tax Powers ... 9
1.8 Trends in population and employment ... 10
Demographics ... 10
The Economy ... 14
Chapter 2. Methodology ... 17
2.1 Microsimulation of household net incomes ... 17
2.2 Survey data... 18
The Family Resources Survey (FRS) ... 18
Understanding Society ... 19
2.3 Reweighting and uprating the data ... 20
2.4 Forecasting the child poverty measures ... 20
Measure 1: relative child poverty... 21
Measure 2: absolute child poverty ... 21
Measure 3: combined low income and material deprivation ... 21
Measure 4: persistent child poverty ... 23
2.5 Policy scenarios ... 24
Scenario (a): uprating only ... 24
Scenario (b): Westminster reforms ... 24
Scenario (c): Westminster plus Scotland reforms ... 24
2.6 Robustness analysis ... 25
Variant scenarios ... 25
Page 3 of 81
Chapter 3. Results... 26
3.1 Headline child poverty measures ... 26
3.2 The impact of UK and Scottish Government policies on child poverty: scenario comparisons ... 28
The role of the Scottish tax and social security reforms in explaining trends in forecast child poverty ... 29
3.3 Confidence intervals for measures 3 and 4 ... 33
3.4 Child poverty by family composition, number of children and employment status 36 Lone parents and couples with children ... 36
Number of children in household... 40
Employment Status ... 43
3.5 Robustness analysis ... 46
Varying population growth assumptions ... 46
Varying employment growth assumptions ... 47
Varying wage growth assumptions ... 48
Other robustness checks ... 50
Comparison with IFS findings ... 51
Summary of results of robustness analysis ... 53
Chapter 4. Conclusions ... 54
References ... 56
Appendix 1. Reweighting the Family Resources Survey: Sources and Methods ... 60
Reweighting ... 61
Forecast Data Sources ... 61
Population Forecasts ... 62
Household Composition ... 62
Employment and Unemployment ... 63
An Example ... 63
2016 - Based Scottish Projections ... 66
Final Weighting Target List ... 67
Appendix 2: The IPPR/Resolution Foundation/Landman Economics tax-transfer model ... 70
Overview ... 70
Page 4 of 81
Reforms modelled ... 71
Modelling partial take-up ... 72
The take-up algorithm ... 72
Take-up of Universal Credit ... 75
Simulating changes in child poverty rates ... 75
Appendix 3. Movements into and out of poverty as a result of the planned Scottish reforms ... 77
Page 5 of 81
Acknowledgements
The authors would like to thank Andrew White and Emma Congreve from the Scottish Government for their comments and advice throughout the programme of research which produced this report and for their comments on draft versions of this report. We would also like to thank attendees at a seminar at the Scottish Government offices in November 2017 for their comments and feedback on the draft results.
Data from the Family Resources Survey and Understanding Society are Crown
Page 6 of 81
Chapter 1. Introduction
Landman Economics and Virtual Worlds were commissioned by the Scottish
Government to produce four sets of projections for child poverty in Scotland, required for the Child Poverty (Scotland) Act (Scottish Parliament 2017b), which includes a set of child poverty targets to be achieved by 2030. This report describes the methods we used to forecast child poverty and gives details of our results.
1.1 Outline of the report
This introductory chapter sets out the background to our work. We discuss the Child Poverty (Scotland) Act, and also recent developments in the UK Government’s welfare reforms, as well as recent tax and social security measures announced by the Scottish Government which may have an impact on child poverty in Scotland. We then briefly discuss the key demographic and economic trends in Scotland and the UK.
Chapter 2 discusses our methods. We describe the four child poverty measures contained in the Child Poverty (Scotland) Act and explain how we model them using a microsimulation model (the Landman Economics/IPPR/Resolution Foundation tax-transfer model) and a large-sample dataset (the Family Resources Survey). Chapter 3 presents our results. As we discuss below, the Act sets a number of ambitious targets for reducing measured child poverty. Even without the already
Page 7 of 81
1.2 The Child Poverty (Scotland) Act 2017
The Child Poverty (Scotland) Act places a duty on the Scottish Government to ensure that four child poverty targets are met during the 2030/31 financial year1. The four targets are:
1. Less than 10% of children living in relative poverty; 2. Less than 5% of children living in absolute poverty;
3. Less than 5% of children living in combined low income and material deprivation; and
4. Less than 5% of children living in persistent poverty.
All four measures are based on After Housing Costs (AHC) disposable income. The Act was passed unanimously by the Scottish Parliament on 8th November 2017 (Parliament 2017a; Southwick and Hutchison 2017).
Chapter 2 below discusses these four poverty measures more fully, and our approach to measuring and forecasting them.
1.3 The Welfare Reform and Work Act 2016
The Child Poverty (Scotland) Act was in part a response to the UK Government’s repeal of significant parts of the Child Poverty Act 2010 (DWP 2010), which it replaced with the Welfare Reform and Work Act 2016 (DWP 2016a). That legislation replaced the four income-based targets of the Child Poverty Act with poverty measures based on worklessness and educational attainment2. The Scottish Government states in the policy memorandum accompanying the Child Poverty (Scotland) Act that it:
Fundamentally disagrees with this approach: in particular, the removal of income-based targets, and the use of alternative measures that do not take income into account. In the Scottish Government’s view, this represents a shift towards characterising poverty as a lifestyle choice rather than addressing the social and economic drivers that cause
people to fall into or remain in poverty3.
1
Scottish Parliament 2017b, Explanatory Notes, page 2
2
Scottish Parliament 2017b, Policy Memorandum, pages 1-2
3
Page 8 of 81
1.4 Reductions in the generosity of social security payments
The UK Government’s July 2015 Budget also announced several changes to the social security system which are forecast to have a significant impact on child poverty in the UK (including Scotland). The most important of these in terms of the number of people affected and the overall size of the reduction in social security spending as a result of the reforms are:
A freeze in the nominal level of most social security benefits and tax credits received by working age families for four years, starting in 2016-17. These include Child Benefit, Jobseekers Allowance, and most parameters of tax credits and Universal Credit.4.
The limiting of premia for children in Housing Benefit, tax credits and Universal Credit to a maximum of two children only for new claimants – with support also not available for most third and subsequent children born after April 2017 for existing claimants.
The abolition of the Work-Related Activity Premium for Employment and Support Allowance claimants from 2017 onwards.
1.5 Universal Credit
A further important driver is the gradual introduction of Universal Credit (UC) (DWP 2013), which is intended to replace the current system of tax credits and most means-tested benefits with a single unified system. In most cases UC is less generous than the benefits and tax credits it replaces (Browne, Hood and Joyce 2016). The introduction of UC has been extremely fraught (Timmins 2016) and national roll-out of the policy is well behind the UK Government’s original schedule, but has now been accelerated (Gauke, 2017).
1.6 Devolved Social Security Powers
Following the 2014 Independence Referendum, the Smith Commission:
Recommended that the Scottish Parliament be given autonomy to determine the structure and value of a range of powers over disability,
4
Page 9 of 81
as well as the power to make administrative changes to Universal Credit and to vary the housing cost element. It also recommended that the Scottish Parliament be given powers to create new benefits in areas
of devolved responsibility, and top-up reserved ones.
(Scottish Government 2016)
In the wake of the Scotland Act 2016, which devolved further powers over part of the social security system to Scotland, the measures that the Scottish Government has introduced, or is planning to introduce, include:
Introducing a new Social Security Agency (Scottish Government 2017a);
Increasing the weekly payment of Carers’ Allowance to the level of Jobseekers’ Allowance for a single adult – an increase from £62.70 to £73.10 at current (2017/18) rates (Scottish Government 2017b);
A new Best Start Grant which replaces the Sure Start Maternity Grant (SSMG), which is a grant for new mothers in low income families. Since 2010 the SSMG has been paid only for the first child in a low-income family. The Best Start Grant pays qualifying families £600 on the birth of their first child (compared with £500 for the SSMG) and £300 on the birth of any subsequent children. Qualifying families also receive £250 when each child begins nursery, and a further £250 when they start school.
1.7 Devolved Income Tax Powers
The Scotland Act 2016 also enabled the Scottish Government to set its own income tax rates and bands on non-savings and non-dividend income. Table 1.1 shows the new rates which will apply for the 2018/19 tax year in Scotland and compares them with the rates which remain in place in the rest of the UK.
Table 1.1. Income tax marginal rates in Scotland and England/Wales: 2018-19
Income tax marginal rate (%)
Gross income level Scotland England/Wales
£11,850-£13,850 19 20
£13,850-£24,000 20 20
£24,000-£43,430 21 20
£43,430-£46,350 41 20
£46,350-£150,000 41 40
Page 10 of 81
The new Scottish rates of income tax result in a tax cut for people in Scotland earning between £11,850 and £26,000 per year compared to the system in place in the rest of the UK; this tax cut is worth a maximum of £20 per taxpayer annually. Above £26,000 annual gross income, the increase in marginal rates (and setting the higher rate threshold at £43,430 in Scotland rather than £46,350 in the rest of the UK) results in higher income tax payments, the extra revenue from which is being reinvested into public services to offset the impact of the UK Government’s cuts to the Scottish
Government’s budget settlement (Scottish Government, 2018). It should be noted that the impacts of the reinvestment of additional tax revenues into public spending are not captured in the modelling used in this report (except where the additional revenue is being used to increase social security payments, as in the reforms to Carers Allowance and the introduction of the Best Start Grant).
Important as the Scottish Government’s new tax and social security measures are, we show in Chapter 3 that their effects are relatively minor compared to the UK
Government cuts that have already happened or are in the pipeline.
1.8 Trends in population and employment
Demographics
As well as changes to the tax and social security system, the extent of child poverty depends also on demographics and the state of the economy.
Appendix 1 below discuss how we use economic and demographic forecasts in our microsimulation work. Here we briefly note two things.
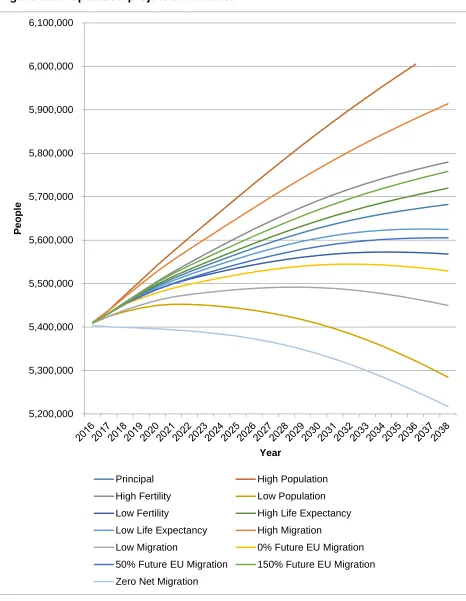
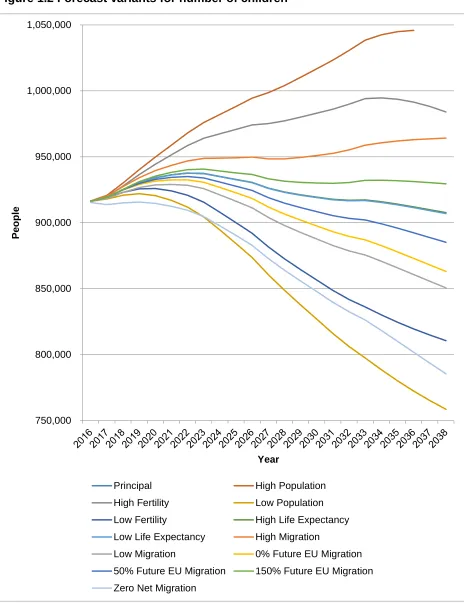
Firstly, political events, especially Brexit, mean that there is a higher than usual level of uncertainty about the path of the Scottish population and the Scottish economy. Figures 1.1 and 1.2 below illustrate this; they show the range of official population forecasts for Scotland, for all people (Figure 1.1) and children only (Figure 1.2)5. Differing
assumptions about fertility, life expectancy and, in particular, inward migration mean that by the end of our forecast period there is a range of 700,000 between the highest and lowest official forecast for total population, and over a quarter of a million for children. The wide range of forecasts is reflected in the robustness analysis of the results in Section 3.5 of this report where using different sets of population forecasts produces a bigger variation in projected child poverty rates than for any of the other forecast parameters (for example earnings or employment).
5
Page 11 of 81
Figure 1.1. Population projection variants
5,200,000 5,300,000 5,400,000 5,500,000 5,600,000 5,700,000 5,800,000 5,900,000 6,000,000 6,100,000
P
e
op
le
Year
Principal High Population High Fertility Low Population Low Fertility High Life Expectancy Low Life Expectancy High Migration
Page 12 of 81
Figure 1.2 Forecast variants for number of children
750,000 800,000 850,000 900,000 950,000 1,000,000 1,050,000
P
e
op
le
Year
Principal High Population High Fertility Low Population Low Fertility High Life Expectancy Low Life Expectancy High Migration
Page 13 of 81
[image:13.612.86.528.203.529.2]Secondly, although we have put a lot of effort into capturing their effects accurately, in practice our results are not primarily driven by demographics or the projected state of the economy. Figures 1.3 and 1.4 below show projections for numbers of children (by age group and gender) and for employment and unemployment levels, for the baseline and one pessimistic projection (zero net migration from the EU post-Brexit).
Figure 1.3. Projected numbers of children, adults, and employment, baseline scenario 100,000 200,000 300,000 400,000 500,000 600,000 700,000 800,000 900,000 1,000,000 20 16 20 17 20 18 20 19 20 20 20 21 20 22 20 23 2 0 2 4 20 25 20 26 20 27 20 28 20 29 20 30 20 31 20 32 20 33 20 34 20 35 2 0 3 6 20 37 20 38 P o p u latio n Year
Population 0-15 Population 16-64
Page 14 of 81
Figure 1.4. Projected numbers of children, adults and employment, pessimistic scenario
Although the Scottish population is clearly ageing (especially in the pessimistic
scenario), the ratio of working-age adults to children is forecast to be reasonably stable even in the pessimistic case.
The Economy
The Scottish Fiscal Commission (SFC) is now responsible for producing independent forecasts for Scotland. SFC produced their first forecast for the Scottish economy in December 2017 (SFC 2017), and we take our projections for the paths of earnings and employment from there. Since (as discussed below), our poverty lines are calculated using data for the UK as a whole, we also use UK-wide data from the corresponding Office for Budget Responsibility (OBR) forecast (OBR 2017) to provide projections for the paths of earnings and employment for the rest of the UK.
As shown in Table 1.2 below, the SFC forecast paints a picture of relatively sluggish growth in both output per head and employment.
100,000 200,000 300,000 400,000 500,000 600,000 700,000 800,000 900,000 1,000,000 20 16 20 17 20 18 20 19 20 20 20 21 20 22 2 0 2 3 20 24 20 25 20 26 20 27 20 28 20 29 20 30 20 31 20 32 20 33 20 34 20 35 20 36 2 0 3 7 20 38 P o p u latio n Year
Population 0-15 Population 16-64
Page 15 of 81
Table 1.2. SFC Scottish Growth Predictions: Headline Numbers
2017 2018 2022
Growth (%) 0.4 0.7 1.1
Productivity Growth (%) 0.2 0.5 1.0 Wage Growth (Nominal) (%) 2.0 2.3 3.1 Employment Growth(%) 1.3 0.6 0.1 Source: SFC (2017), p7
This is true also of the OBR forecast for the whole UK, as shown in Table 1.3 below, which compares the SFC Scottish forecast with the OBR UK-wide one for the early years of our simulation period. Both Scotland and the UK are forecast to have historically slow growth, but the forecast UK growth is slightly higher6. However, the forecast divergence in growth between Scotland and the rest of the UK could be significant for our study because the poverty lines used in our poverty measures7 increase with UK income (DWP 2016b), and therefore slower growth in Scotland compared to the rest of the UK could cause measured relative poverty in Scotland to increase even if there was nothing else going on, due to slower real income growth causing more households to fall below a relative poverty line which is calculated based on UK-wide household incomes8. As discussed in Chapter 3, however, using OBR's and SFC's central projections, this effect appears to be small9.
6
Possible reasons for slow growth in the UK economy as a whole include the collapse in productivity growth following the 2008-09 recession, a forecast decline in immigration post Brexit, shocks from Brexit itself, and secular changes such as the increasing share of service industries and the rise of the 'gig economy'.
7
Except absolute poverty (measure 2), since the poverty line there does not move as median income changes over our simulation period.
8
One interesting reason for the divergence between the OBR and SFC forecasts that could be relevant to us is that OBR continue to use the ONS central population forecast, which does not assume any impact of Brexit, whereas the SFC one uses one of the NRS's pessimistic forecasts, which assumes a fall of 50% in EU net migration.
9 The results in Chapter 3 contain a robustness check – running the child poverty projections using the
Page 16 of 81
Table 1.3. Comparison of SFC Scottish economy forecasts with OBR UK economy forecasts
2016 2017 2018 2019 2020 2021 2022
GDP OBR 1.8 1.5 1.4 1.3 1.3 1.5 1.6
SFC 0.4 0.7 0.7 0.9 0.6 0.9 1.1 GDP per capita OBR 1.0 0.9 0.8 0.7 0.7 0.9 1.0 SFC -0.1 0.3 0.3 0.6 0.3 0.6 0.9 Employment (millions) OBR 31.7 32.1 32.3 32.4 32.5 32.6 32.7
SFC 2.6 2.6 2.7 2.7 2.7 2.7 2.7 Real hourly wages OBR 1.7 0.3 -0.1 0.7 0.6 1.0 1.0 SFC 2.1 -0.3 0.1 0.5 0.6 0.8 1.1 Nominal annual earnings OBR 2.8 2.3 2.3 2.3 2.6 3.0 3.1 SFC 3.2 2.0 2.2 2.4 2.6 2.8 3.1
Source: SFC (2018) for Scottish economy forecasts, OBR (2017) for UK economy forecasts.10
10
Page 17 of 81
Chapter 2. Methodology
2.1 Microsimulation of household net incomes
Our approach for forecasting child poverty over the years to 2030/31 relies on using a microsimulation model to estimate household net incomes under three different policy scenarios (as explained in Section 2.6 below). We use the IPPR/Resolution
Foundation/Landman Economics tax-transfer model11 (referred to hereafter in this
report as the “tax-transfer model”, or the abbreviation TTM) to model the effects of reforms to the tax and social security system in Scotland and the rest of the UK. Broadly, the following parts of the system are modelled:
Income tax;
National Insurance Contributions (NICs);
Council Tax and Council Tax-related benefits (including the Council Tax Reduction scheme in Scotland);
Means-tested and non-means tested benefits;
Tax credits;
Universal Credit, which is currently being rolled out to all families in the UK and replacing tax credits and most means-tested benefits.
In addition to this, the analysis also models the introduction of the National Living Wage (NLW) – an above-inflation increase in the minimum wage for employees aged 25 and over, introduced in 2015 and uprated every April since then, with the stated intention of increasing to 60 percent of median earnings by 2020.
The TTM is a microsimulation model which uses data from the UK Family Resources Survey (FRS) (discussed further in Section 2.2 below). It calculates net incomes for households (and benefit units within households, and individuals within benefit units) given a set of tax-transfer parameters, and for a given tax year (e.g. 2017-18). The parameters are held in files in spreadsheet format; a set of parameters can describe the
11
Page 18 of 81
actual tax-transfer system in place at a given time, or a simulated system with one or more reforms implemented (for example, an increase in income tax rates).
The model takes account of all the reforms to the tax and social security system in Scotland and other countries of the UK that can be modelled using the information in the FRS data. The model also takes account of partial take-up of means-tested benefits, tax credits and Universal Credit. Not everybody who is eligible for particular means-tested social security payments based on their circumstances in the FRS data actually claims those payments, and it is important for the modelling to control for this where possible12. Appendix 2 contains more detail on these features of the TTM.
The model is fundamentally static in that it does not attempt to model the effect of reforms to taxes or transfer payments on people’s behaviour; the analyses in this report assume that behaviour is unchanged in response to policy changes. However, the algorithm used to reweight the FRS data for years between 2017/18 and 2030/31 (discussed in more detail in Section 2.4 below) does take forecasts of increased employment in Scotland (and the rest of the UK) into account.
The TTM has been used for analysis of the impact of reforms to tax and social security on child poverty rates in the UK before – for example in an analysis of the impact of increased employment on child poverty by 2020 for the Social Mobility and Child Poverty Commission (Reed and Portes 2014a), cumulative impact assessments of Budget and Spending Review policy decisions by the UK Government for the Equality and Human Rights Commission (Reed and Portes, 2014b and 2018) and an analysis of the impact of various policy choices on the welfare state for inequality and poverty in 2030 (Harrop and Reed, 2015). It is a model with a proven track record for realistic poverty forecasts.
2.2 Survey data
The Family Resources Survey (FRS)
The FRS is an annual survey of around 20,000 households per year in the UK, collected on a tax-year basis13. The most recent release of FRS at the time of writing this report was 2015-1614; the 2015-16 dataset contains 2,704 households from Scotland, 13,840
12
The impact of assuming 100% take-up of means-tested social security payments on the result is tested in Chapter 3 as a robustness check.
13 The Family Resources Survey and the Living Costs and Food Survey are both ‘repeated
cross-sectional’ surveys rather than panel surveys; they interview a new set of households each year rather than conducting repeat interviews with the same set of households over a number of years.
14
Page 19 of 81
households from England, 1,930 households from Northern Ireland and 848 households from Wales.
The FRS is generally acknowledged to be the best source of data on individual, family and household gross incomes and disposable incomes (incomes after payment of direct taxes and transfer payments) in the UK. For this reason, the FRS is used for the UK Government’s statistical publication on the income distribution Households Below Average Income (HBAI) (DWP 2017b) and also the Scottish Government’s own
publication Poverty and Income Inequality in Scotland (Scottish Government, 2017d). The FRS is also suitable for microsimulation modelling of changes in taxes and transfer payments in response to policy reforms as it contains individual, family and household attribute variables which establish eligibility to many elements of the tax and transfer payment system (e.g. age, single/couple and/or marital status, number of children in the family, housing tenure type, and so on). The FRS also contains information on housing costs and childcare arrangements and expenditure (but not expenditure on other goods and services).
Because of the relatively small sample size for the FRS in Scotland, our calculations of child poverty for this project use a pooled dataset of four years (2012/13, 2013/14, 2014/15 and 2015/16). This gives a total sample size of 13,337 Scottish households out of 92,501 UK households (excluding a small number of households dropped from the dataset which the UK Government uses for HBAI because of incomplete or poor quality data).
Understanding Society
In order to forecast persistent poverty, it is necessary to use a panel dataset where the same households and individuals are interviewed repeatedly (e.g. on an annual basis). FRS is a cross-sectional dataset and so cannot be used in isolation to produce
persistent poverty forecasts. The best source of panel data on household incomes is Understanding Society (USoc). This is a panel survey of around 25,000 households which has been running since 2009; 6 waves of data are now available, with the most recent interviews in 2015-16. The DWP and Scottish Government have both produced experimental statistics on persistent poverty using the USoc data (DWP 2017c; Scottish Government 2017e).
Page 20 of 81
2.3 Reweighting and uprating the data
The pooled FRS dataset for the four years 2012-13 through to 2015-16 needs to be adjusted for each of the forecast years (2016-1715 through to 2030-31) so that, for each forecast year, the dataset better resembles forecasts of what the population and the distribution of earnings and other gross incomes in future years. This project uses two techniques16 to adjust the FRS dataset so that it better resembles the population profile and earnings distribution in future years:
1. Re-weighting. Survey datasets such as the FRS contain weights that are inversely related to the probability of a given household being selected in a random sample; for example, if lone parent households are less likely than average to respond to the FRS questionnaire (or to be contacted by FRS
interviewers in the first place), lone parent households will tend to have a higher-than-average weight in the survey. These weights ‘gross up’ to the totals of each type of household in the UK population. By varying the weights it is possible to transform the FRS data so that it more closely resembles forecasts of the demographic structure of the population in future years.
2. Uprating. If we expect earnings or other economic variables (such as housing costs) to rise or fall in real terms, the recorded values of these variables in the FRS data can be adjusted before carrying out the calculations in the TTM. Appendix 1 gives a detailed account of the re-weighting and uprating methods used to adjust the FRS data to forecast the demographic structure and economic variables in Scotland (and the rest of the UK) over the forecast period.
2.4 Forecasting the child poverty measures
This section gives an overview of the methods required for forecasting each of the four child poverty measures specified in the Child Poverty (Scotland) Act 2017.
15
Although the 2016-17 tax year is in the past, because the most recent FRS data currently available is 2015-16, for the purposes of the empirical analysis in this report, 2016-17 (and 2017-18) are forecast years rather than historical years.
16 A third technique – artificial ageing – was considered for use in this project but rejected as too
Page 21 of 81
Measure 1: relative child poverty
The forecast for this measure in each target year (between 2016/17 and 2030/31) is calculated as follows:
i. The pooled FRS data for the years 2012/13 to 2015/16 are reweighted and uprated to the target year according to economic projections for employment and earnings growth, and growth of gross incomes from other sources (e.g.
investment, property etc). More detail on the reweighting and uprating procedures is given in Appendix 1;
ii. The relevant tax-benefit parameters for the target year are applied (see Section 2.5 on ‘policy scenarios’ below);
iii. Median household AHC (equivalised) net incomes are calculated at a UK-wide level, taking simulated weights for the target year into account;
iv. The child poverty rate is calculated based on 60% of the AHC poverty line.
Measure 2: absolute child poverty
The method for Measure 2 is exactly the same as for Measure 1 except that the poverty line in step (iii) is the 2010-11 median income level, uprated for inflation17 to the target year.
Measure 3: combined low income and material deprivation
The forecasting of poverty measure 3 requires additional assumptions compared to measures 1 and 2 because measure 3 depends in part on material deprivation and this cannot be forecast directly using the tax-transfer model in the way that disposable income can. Instead, we estimate a simulated deprivation score for the FRS subsample of households with children in the target year.
The following procedure is used to estimate a simulated material deprivation score for each household with children in the FRS:
17
Page 22 of 81
1) Pooling data from the FRS for 2010-1118 through to 2015-16;
2) A regression of household deprivation score against variables including: i. household demographics (e.g. number of children in various age
groups, number of single and couple adults); ii. region;
iii. housing tenure;
iv. household earned income; v. household investment income;
vi. household income from transfer payments (e.g. benefits, tax credits);
vii. employment status.
3) Based on the regression coefficients (plus a randomly generated error term for each household) and the forecast values of the explanatory variables for the target year (some are time invariant such as household demographics, whereas others change between the base year and the target year, such as household incomes), a simulated deprivation score is predicted for each household in the target year.
4) The proportion of households with a deprivation score of over 25 is calculated (based on the simulated sample weights for the target year) – this is the forecast of material deprivation in the FRS for the target year.
5) Forecast material deprivation is combined with a variant of the forecast of low income from Measure 1 above (using a higher poverty line, of 70% of median equivalised AHC income) to produce the forecast of combined low income and material deprivation which is Measure 3.
Note that this procedure can be repeated a larger number of times with differently randomly generated errors to build up a distribution of simulated forecasts. In Chapter 3 we use this technique to produce statistical confidence intervals for the estimates of Measure 3 over the forecast period.
18
Page 23 of 81
Measure 4: persistent child poverty
The method for estimating persistent child poverty is similar to the method for
forecasting material deprivation used for measure 3 above, but there is an additional complication because the persistent child poverty measure uses Understanding Society (USoc) data rather than FRS.
Bearing this in mind, the forecast of persistent poverty proceeds as follows: 1. A pooled USoc dataset from waves 3 to 6 is used;
2. For households in waves 3 to 6, a (probit) regression of persistent child poverty is estimated (defined as child poverty in at least 3 of the last 4 years) against
variables including:
i. household demographics (e.g. number of children in various age groups, number of single and couple adults);
ii. region;
iii. housing tenure;
iv. household earned income; v. household investment income;
vi. household income from transfer payments (e.g. benefits, tax credits);
vii. employment status.
3. The probability of being in persistent poverty is predicted using the FRS sample for the target year, based on the regression coefficients from the USoc
regression (plus a randomly generated error term for each household) and the forecast values of the explanatory variables for the target year
4. The proportion of households in persistent poverty in the FRS is calculated (based on the simulated sample weights for the target year). This is our estimate of measure 4.
Page 24 of 81
2.5 Policy scenarios
The four child poverty measures are estimated for three different policy scenarios. Each of these scenarios uses the actual tax and social security systems in place in Scotland and the rest of the UK for years up to and including the current tax year (2017/18). After 2017/18, the three scenarios make different assumptions about the future parameters of the tax and social security system, as follows:
Scenario (a): uprating only
Scenario (a) assumes that the 2017-18 tax and social security system is kept in place and simply uprated for future years using the default uprating assumptions (‘triple lock’ uprating for the state pension and Consumer Prices Index uprating for other benefits, tax credits, and tax and National Insurance thresholds). None of the further reforms or changes scheduled to take effect after 2017/18 – for example the roll-out of Universal Credit, and the continuation of the working-age social security uprating freeze for two more years – are implemented.
Scenario (b): Westminster reforms
Scenario (b) includes reforms announced by the UK Government which are scheduled to come into effect after 2017/18, but does not include reforms announced by the Scottish Government (the changes to income tax rates in Scotland scheduled for 2018/19, the increase in Carers’ Allowance to the level of Jobseekers’ Allowance, and the Best Start Grant).
Scenario (c): Westminster plus Scotland reforms
Scenario (c) includes the reforms announced by the UK Government plus the reforms announced by the Scottish Government detailed above.
Page 25 of 81
2.6 Robustness analysis
Variant scenarios
It is useful and instructive to re-calculate the child poverty measures using variations to many of the assumptions on the macroeconomy, demographic structure, and some of the key assumptions underlying the microsimulation modelling of household net incomes using the TTM. With this in mind, Chapter 3 of the report includes some
analysis of variants to the child poverty estimates produced using the following variants to the modelling methodology:
Varying the population forecasts for the Scottish economy;
Varying the forecasts for employment growth in the Scottish economy; Zero real wage growth;
Wage growth lower than forecast (e.g. 0.5 percentage points per year lower);
Wage growth higher than forecast (e.g. 0.5 percentage points per year lower);
No reweighting (essentially stripping out all the reweighting assumptions after 2017-18);
Using OBR forecasts across the whole UK economy (including Scotland);
Using a longer transition period for the roll-out of Universal Credit;
Assuming 100% take-up of means-tested social security payments.
Comparison with IFS results
Page 26 of 81
Chapter 3. Results
3.1 Headline child poverty measures
Figure 3.1 shows the results for the proportion of children in poverty under each of the four featured measures, starting with 2015/16 (the most recent year for which published child poverty statistics were available at the time or writing) and ending in 2030/31. Note that these headline measures are based on scenario (c) (where all the planned UK Government and Scottish Government tax and social security reforms are implemented over the forecast period). Measure 1 (relative child poverty) is shown in blue, Measure 2 (absolute child poverty) in red, Measure 3 (combined material deprivation and below 70% of median AHC income) in grey, and Measure 4 (persistent poverty) in yellow. Figure 3.1 shows that the relative child poverty rate (Measure 1) is forecast to rise sharply between 2015/16 and the current tax year, 2017/18 (from 26.5 per cent to just under 31 per cent). A further sharp increase is forecast between 2017/18 and 2020/21, to 34.5 per cent. After this, during the 2020s, relative child poverty is forecast to
continue increasing, but at a slower rate, before levelling out at just under 38 per cent from 2027/28 onwards.
The absolute child poverty measure (Measure 2) begins to rise sharply after 2016/17, rising from just over 25 per cent in 2016/17 to just under 32 per cent in 2019/20. After this, absolute poverty rises more slowly before levelling off at just over 33 per cent in 2021/22, and then gradually falling over the rest of the 2020s before reaching 31.6 per cent in 2030/31 – around the same level it is forecast to be at in 2019/20.
Measure 3 (combined material deprivation and low income) is forecast to rise from just over 14 per cent in 2016/17 to 16 per cent in 2019/20, and then rises less quickly over the early 2020s before levelling off at around 16.5 per cent in 2023/24. It is then forecast to stay at around this level for the rest of the 2020s.
Measure 4 (persistent poverty) is projected to rise from just under 13 per cent in 2015/16 to 15.5 per cent in 2026/27 before levelling off at around this level for the rest of the forecast period.
Page 27 of 81
Figure 3.1. Headline child poverty rate forecasts, Scotland, scenario (c), 2015/16 to 2030/31
Source: calculations based on outputs from tax-transfer model using FRS pooled dataset 2012/13 to 2015/16
Figure 3.2 shows the same headline results as Figure 3.1 but expressed in terms of the forecast number of children in poverty rather than the forecast poverty rate. Because projections for the growth of population of children in Scotland show almost no increase over the forecast period as a whole (a projected population of 1.079 million in both 2015/16 and 2030/31, with a maximum population of 1.089 million in the mid-2020s), the pattern of increases in child poverty looks almost identical in Figure 3.2 compared to Figure 3.1. For this reason, all subsequent graphs in this report use child poverty rates rather than absolute numbers in poverty.
0% 5% 10% 15% 20% 25% 30% 35% 40%
2015/16 2017/18 2019/20 2021/22 2023/24 2025/26 2027/28 2029/30
c
hild
po
v
e
rt
y
r
a
te
Page 28 of 81
Figure 3.2. Headline forecast numbers of children in poverty, Scotland, scenario (c), 2015/16 to 2030/31
Source: calculations based on outputs from tax-transfer model using FRS pooled dataset 2012/13 to 2015/16
3.2 The impact of UK and Scottish Government policies on child poverty:
scenario comparisons
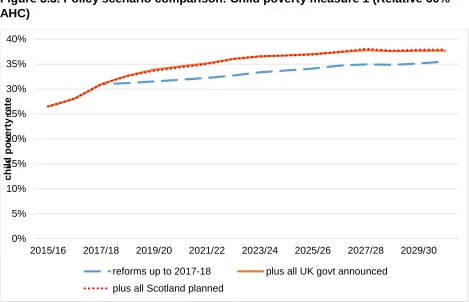
Analysing the difference between forecast child poverty rates under the scenarios (a), (b) and (c) outlined in Section 2.6 is useful for providing more information about what the drivers of the forecast increase in poverty are. Figure 3.3 shows a comparison of the forecasts for child poverty measure 1 (relative poverty) under the three scenarios;
a) The 2017-18 system with no further reforms, uprated for inflation;
b) Scenario (a) plus subsequent announced UK Government tax and social security reforms;
c) Scenario (b) plus subsequent announced Scottish Government tax and social security reforms.
Figure 3.3 shows that the announced UK government reforms after 2017-18 (the orange line) result in a substantial further increase in relative child poverty compared to
scenario (a) where the subsequent UK reforms are not implemented (the blue dashed line). This reflects the impact of the freeze on the uprating of working age social security
0 50,000 100,000 150,000 200,000 250,000 300,000 350,000 400,000 450,000
2015/16 2020/21 2025/26 2030/31
Page 29 of 81
benefits, in particular. One of the reasons that relative poverty starts to increase at a faster rate after 2016/17 is the impact of the social security uprating freeze, combined with relatively high inflation in the wake of the EU referendum vote in June 2016 (for example CPI was running at 2.7% in January 2018, compared to a Bank of England target of 2 per cent) (ONS 2018). Other policies, such as the introduction of the two-child limit for Housing Benefit, tax credits and Universal Credit in April 2017, are also contributing factors to the measured increase in Scenario (b). When UK Government-mandated reforms for 2018/19 and subsequent years are stripped out, relative poverty still increases, but does so at a much slower rate; by 2020/21, relative poverty is forecast to be just under 32 per cent in scenario (a), compared to 34.5 per cent in scenario (b).
The role of the Scottish tax and social security reforms in explaining trends
in forecast child poverty
Comparing scenario (b) with scenario (c), we see that the Scottish Government’s planned tax and social security reforms have a very limited impact on relative child poverty. Across the whole forecast period, the divergence between forecast child
poverty in scenario (b) and scenario (c) is always within the statistical margin of error for the forecast. In other words, there is no statistically significant impact of the Scottish Government’s reforms. This section analyses why the forecast impacts of the reforms are so small.
In the case of the increase in Carers’ Allowance, the smallness of the effect is because the measure does not affect enough households with children to cause any measurable impact on child poverty19. And while the Best Start Grant is received by a far higher proportion of families with children – and low-income families with children, in particular – than Carers’ Allowance, the additional payments from the grant – expressed in weekly terms – are not large enough to make an appreciable difference to the poverty rate. The changes to income tax from 2018/19 onwards affect a much larger proportion of the Scottish population than either the increase in Carers’ Allowance or the introduction of the Best Start Grant. However, the maximum gain from the reduction in the rate of income tax to 19% on the first £2,000 of taxable income is £20 per year, or just under 40 pence per week. Even in a household with two earners in the relevant gross income bracket, this is not a large enough sum by itself to result in a statistically significant reduction in child poverty. Meanwhile, the increase of 1% in marginal income tax rates above £24,000 per year gross income results in additional tax payments for people earning above £26,000 per year, but in most cases households with one or more
19
Page 30 of 81
earners in this income bracket are above the relative (and absolute) poverty lines and so the increase in tax does not have any impact on poverty.
[image:30.612.72.541.209.511.2]Appendix 3 presents results from an analysis of the number of children in households in the 4-year pooled Scottish FRS sample who move out of, or into, relative AHC poverty as a result of the Scottish reforms. The results show that the number of children moving into or out of poverty is extremely small in any given part of the forecast period.
Figure 3.3. Policy scenario comparison: Child poverty measure 1 (Relative 60% AHC)
Source: calculations based on outputs from tax-transfer model using FRS pooled dataset 2012/13 to 2015/16
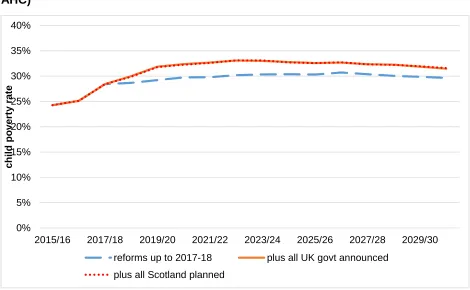
Figure 3.4 shows the comparison of policy scenarios for child poverty measure 2 (absolute poverty). Once again, comparing scenarios (a) and (b) shows major
differences in the forecast path for child poverty in Scotland. In scenario (a), where the effects of future planned UK Government reforms are not included, absolute child poverty rises fairly slowly, to just over 30 per cent by 2022/23, then begins to fall from 2026/27 onwards. By contrast, in scenario (b) there is a much faster increase in absolute poverty after 2017/18, to 33 per cent by 2022/23. As with the relative poverty measure, the additional impact of the Scottish Government’s planned reforms on
0% 5% 10% 15% 20% 25% 30% 35% 40%
2015/16 2017/18 2019/20 2021/22 2023/24 2025/26 2027/28 2029/30
child
p
o
v
er
ty
r
ate
Page 31 of 81
[image:31.612.71.541.155.445.2]absolute child poverty in scenario (c) compared to (b) is very minor; they result in no statistically significant change in child poverty rates over the forecast period.
Figure 3.4. Policy scenario comparison: Child poverty measure 2 (Absolute 60% AHC)
Source: calculations based on outputs from tax-transfer model using FRS pooled dataset 2012/13 to 2015/16
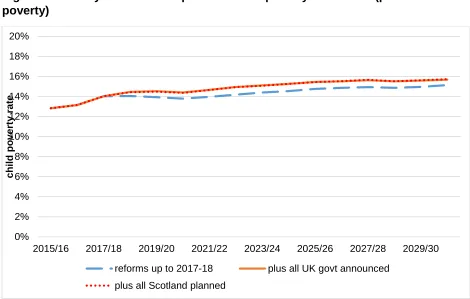
Figure 3.5 shows the policy scenario comparison for measure 3 (combined material deprivation and low income). The inclusion of UK Government planned reforms relative to a scenario of no further reforms after 2017-18 (scenario (b) compared to scenario (a)) shows a smaller percentage difference for measure 3 than either measure 1 or 2, but this is not surprising given that measure 3 starts from a lower percentage of children in poverty in 2015/16 (around 14 per cent compared to 24 per cent for measure 2 and 26 per cent for measure 1). A scenario of ‘no further reforms’ here leads to a gradual increase in the combined material deprivation and low income rate, from just under 15 per cent in 2017/18 to just over 15.5 percent by 2025/26. By comparison, when planned UK Government reforms are included, the poverty rate under measure 3 is around 1 percentage point higher. Including the Scottish Government’s planned tax and social
0% 5% 10% 15% 20% 25% 30% 35% 40%
2015/16 2017/18 2019/20 2021/22 2023/24 2025/26 2027/28 2029/30
child
p
o
v
er
ty
r
ate
Page 32 of 81
[image:32.612.73.541.166.445.2]security reforms makes almost no difference to measured child poverty under this measure20.
Figure 3.5. Policy scenario comparison: Child poverty measure 3 (Combined material deprivation and low income)
Source: calculations based on outputs from tax-transfer model using FRS pooled dataset 2012/13 to 2015/16
Finally in this section, Figure 3.6 shows the comparison of policy scenarios under measure 4 (the persistent poverty measure). Interestingly the planned UK Government reforms make slightly less difference to the child poverty rate using measure 4 than they do using measure 3, at least in the early years of the forecast. The forecast persistent poverty rate rises from 14 per cent in 2017/18 to 15 per cent by 2029/30 in scenario (a), compared to just over 15.5 per cent in scenario (b). This may be because low income in any given year of the FRS is less strongly related to the probability of being in persistent poverty (based on the regression coefficients from the Understanding Society data) than
20
It should be noted that one of the objectives of the Best Start Grant is to incentivise families to spend on certain child-related items, some of which are part of the questions used in the FRS to measure material deprivation. Thus, it is possible that the introduction of the Best Start Grant could result in reduced poverty under Measure 3 due to a decrease in measured material deprivation. The modelling used in this report is unable to capture this effect, however.
0% 2% 4% 6% 8% 10% 12% 14% 16% 18% 20%
2015/16 2017/18 2019/20 2021/22 2023/24 2025/26 2027/28 2029/30
child
p
o
v
er
ty
r
ate
Page 33 of 81
it is to the probability of being in material deprivation (based on the coefficients from the FRS regression on the determinants of material deprivation). Comparison of the results for scenario (b) and (c) show that the Scotland-specific reforms to tax and social
[image:33.612.70.540.174.473.2]security have essentially no impact on forecast poverty rates under this measure.
Figure 3.6. Policy scenario comparison: Child poverty measure 4 (persistent poverty)
Source: calculations based on outputs from tax-transfer model using FRS pooled dataset 2012/13 to 2015/16 and regression modelling using Understanding Society data Waves 3 to 6
3.3 Confidence intervals for measures 3 and 4
As explained in Section 2.3 above, the estimates for poverty measures 3 and 4 are subject to greater uncertainty than measures 1 and 2 because material deprivation and persistent poverty cannot be calculated directly using the output from the tax-transfer microsimulation model but have to be estimated using regression predictions based on the net income estimates from the model combined with coefficients from an FRS regression of the likelihood of material deprivation based on observable characteristics (for measure 3) and a USoc regression of the likelihood of persistent poverty based on
0% 2% 4% 6% 8% 10% 12% 14% 16% 18% 20%
2015/16 2017/18 2019/20 2021/22 2023/24 2025/26 2027/28 2029/30
child
p
o
v
er
ty
r
ate
Page 34 of 81
observable characteristics (for measure 4). Each set of regression predictions uses a set of randomly drawn error terms for the FRS data when predicting the likelihood of each FRS household being in material deprivation or persistent poverty. By using a large number of random draws and recalculating poverty measures 3 and 4 for each draw it is possible to build up a distribution of estimated poverty rates for each year. Figure 3.7 shows the upper and lower 95% confidence intervals21 for poverty measure 3 based on this repeated random draw process (sometimes known as “Monte Carlo
simulation”). Roughly speaking, the upper and lower confidence intervals are around 1 percentage point above and below the central estimate, respectively. Thus, measure 3 is relatively tightly estimated, despite the inherent uncertainty in forecasting material deprivation given that it cannot be modelled directly using standard microsimulation techniques. The forecast increase in the central estimate of combined poverty and material deprivation from around 13.5 per cent in 2015/16 to around 15.5 percent by 2024/25 is statistically significant22 even taking into account the uncertainties introduced by the estimation procedure.
21
Intuitively, this means that there is a 95% chance that the true value is somewhere between our upper and lower limits. See Giles (2011) for more detail on this.
22
Page 35 of 81
Figure 3.7. Confidence intervals, estimates of poverty measure 3 (combined material deprivation and relative poverty)
Source: Monte Carlo simulations based on outputs from tax-transfer model using FRS pooled dataset 2012/13 to 2015/16
Figure 3.8 shows upper and lower confidence intervals for poverty measure 4 in the same way. The confidence intervals are slightly wider than for measure 3 on average, perhaps reflecting the additional uncertainty introduced by using two datasets –
Understanding Society and the FRS – for the estimate of persistent poverty. However, the increase in measure 4 is still statistically significant even after taking uncertainties based on the regression prediction into account.
0% 2% 4% 6% 8% 10% 12% 14% 16% 18% 20%
2015/16 2017/18 2019/20 2021/22 2023/24 2025/26 2027/28 2029/30
child
p
o
v
er
ty
r
ate
Page 36 of 81
Figure 3.8. Confidence intervals, estimates of poverty measure 4 (persistent poverty)
Source: calculations based on outputs from tax-transfer model using FRS pooled dataset 2012/13 to 2015/16 and regression results from Understanding Society Waves 3 to 6
3.4 Child poverty by family composition, number of children and
employment status
This section breaks the results for the whole population of Scottish households with children (shown in Section 3.1 above) down into different household types to show trends for lone parent families compared to couples with children, households with different numbers of children, and the number of adults in work in the family (and whether they are in part-time or full-time work).
Lone parents and couples with children
Figure 3.9 shows trends in the four child poverty measures for children in lone parent families, while Figure 3.10 shows the equivalent trends for children in two-parent families. The two Figures are drawn on the same scale to allow an easy comparison of
0% 2% 4% 6% 8% 10% 12% 14% 16% 18%
2015/16 2017/18 2019/20 2021/22 2023/24 2025/26 2027/28 2029/30
child
p
o
v
er
ty
r
ate
Page 37 of 81
the results. Figure 3.9 shows very substantial projected increases for lone parents in relative poverty (measure 1) and absolute poverty (measure 2) between 2016/17 and 2021/22. In just one year – 2016/17 to 2017/18 – relative child poverty for lone parents jumps by over 8 percentage points (from just over 39 per cent to just under 48 per cent). Reaching just over 56 per cent by 2022/23, it is then forecast to carry on rising through most of the 2020s before levelling off at around 60 per cent in 202/28. Over the total forecast period relative poverty for lone parents grows by around 23 percentage points, while absolute poverty grows by around 17 percentage points. Absolute poverty for lone parents peaks just above 52 per cent in 2026/27, falling slightly after that. Combined material deprivation and low income poverty and persistent poverty show smaller (but still substantial rises) over the forecast period – the former goes from just over 28 per cent in 2015/16 to around 33.5 per cent by 2023/24, while the latter increases from 17.5 per cent in 2015/16 to around 23.5 per cent by 2030/31.
For children in couple families, the increases in relative and absolute poverty are not as large as for children in lone parent families, although still substantial. Relative poverty increases by just 6 percentage points between 2015/16 and 2023/24, peaking at 29.3 per cent in 2027/28. Absolute poverty increases by just over 5 percentage points to 26 per cent by 2022/23 before falling back under 24 per cent by the end of the forecast period. Interestingly, the increase in poverty under both these measures is smoother for children in couple families, whereas the trends for children in lone parents show a much sharper increase between 2016/17 and 2019/20 – driven by the cuts to social security benefits and tax credits, and the introduction of Universal Credit, over this period. Trends in measure 3 (combined material deprivation and low income) and measure 4 (persistent poverty) show less of an increase for children in couple families than for lone parents. In fact, for measure 3 there is only a slight increase – by half of one percentage point between 2016/17 and 2021/22 – and by 2030/31 poverty on this measure is
Page 38 of 81
Figure 3.9. Child poverty rate forecasts: lone parent families
Source: calculations based on outputs from tax-transfer model using FRS pooled dataset 2012/13 to 2015/16
0% 10% 20% 30% 40% 50% 60% 70%
2015/16 2017/18 2019/20 2021/22 2023/24 2025/26 2027/28 2029/30
Child pov
e
rt
y
r
a
te
Page 39 of 81
Figure 3.10. Child poverty rate forecasts: couples with children
Source: calculations based on outputs from tax-transfer model using FRS pooled dataset 2012/13 to 2015/16
0% 10% 20% 30% 40% 50% 60% 70%
2015/16 2017/18 2019/20 2021/22 2023/24 2025/26 2027/28 2029/30
Child pov
e
rt
y
r
a
te
Page 40 of 81
Number of children in household
Figures 3.11, 3.12 and 3.13 show trends in child poverty rates for children in families with one child, two children and three children respectively. The results for children in families with one child and two children show a reasonably similar pattern. Relative poverty increases from around 25 per cent to just under 31 per cent for children in families with one child, and from just over 22 per cent to 29 per cent for children in families with two children, over the forecast period. Meanwhile, absolute poverty rises by 3.5 percentage points before peaking at just under 27 per cent in 2020/21 for children in families with one child, and rises by just under 5 percentage points before peaking at 25 per cent in 2019/20 for children in families with two children. Absolute poverty falls by just over 2 percentage points over the 2020s for both groups.
Meanwhile, combined poverty and material deprivation, and persistent poverty, both increase slightly for both groups over the forecast period.
The pattern for children in families with three or more children looks very different, with much more striking increases in poverty on all four measures. Relative poverty is forecast to increase very quickly from 33 per cent in 2015/16 to over 50 percent by 2022/23, with a further increase to 53 percent by 2027/28. Absolute poverty is forecast to increase from around 30 percent in 2015/16 to peak at over 47 percent in 2023/24, falling back only slightly to 46 percent by 2030/31. Combined material deprivation and low income is forecast to rise from around 22.5 percent in 2016/17 to 26 per cent by 2022/23, while persistent poverty is forecast to rise from just under 20 per cent at the start of the forecast period to 28 per cent by 2027/18.
The main reason why child poverty is forecast to rise so much more for children in families with three or more children is because of the social security reforms coming into force from 2016/17 onwards. The restriction of financial assistance in Housing Benefit, tax credits and Universal Credit to the first two children only for new claims – and many existing claims – from 2017 onwards, leads to a substantial fall in net income for
families with three or more children, as shown by Reed and Portes (2018). The four-year freeze on uprating for most family social security benefits also has a very substantial impact on larger families who claim larger amounts of means-tested
Page 41 of 81
Figure 3.11. Child poverty rate forecasts: families with one child
Source: calculations based on outputs from tax-transfer model using FRS pooled dataset 2012/13 to 2015/16
0% 10% 20% 30% 40% 50% 60%
2015/16 2017/18 2019/20 2021/22 2023/24 2025/26 2027/28 2029/30
Child pov
e
rt
y
r
a
te
Page 42 of 81
Figure 3.12. Child poverty rate forecasts: families with two children
Source: calculations based on outputs from tax-transfer model using FRS pooled dataset 2012/13 to 2015/16
0% 10% 20% 30% 40% 50% 60%
2015/16 2017/18 2019/20 2021/22 2023/24 2025/26 2027/28 2029/30
Ch
ild p
o
v
er
ty
r
ate
Page 43 of 81
Figure 3.13. Child poverty rate forecasts: families with three or more children
Source: calculations based on outputs from tax-transfer model using FRS pooled dataset 2012/13 to 2015/16
Employment Status
Figure 3.14 shows child poverty rate forecasts (for measure 1, the relative AHC poverty rate, only) for families disaggregated by the employment status of the adult(s) in the family. There is a substantial variation both in the measured poverty rates for children in families with different employment status and in the forecast growth of poverty in the years up to 2030/31.
Starting at the top of the Figure, the poverty rate for children in families where no adult is in paid work is already high (at 56 per cent) in 2015/16. Between 2016/17 and
2018/19 in particular, there is a very substantial increase in child poverty for children in this group, up to over 79 per cent by 2018/19 – an increase of 23 percentage points in two years. This is driven by the substantial cuts to social security benefits and tax
credits and the introduction of Universal Credit which is rolled out by 2018/19 under our default assumptions. After 2018/19, child poverty for children in households where no adult is in paid work continues to increase (albeit more slowly), reaching over 91 per cent by 2027/28. This is a striking result – by the late 2020s, over nine in every ten
0% 10% 20% 30% 40% 50% 60%
2015/16 2017/18 2019/20 2021/22 2023/24 2025/26 2027/28 2029/30
Ch
ild p
o
v
er
ty
r
ate
Page 44 of 81
children in families where no adult is in paid work is forecast to be in relative poverty, compared with just over half in 2015/16.
The blue line shows trends in child poverty for children in families where there is no adult in full-time paid work , but one or two adults in part-time paid work. Many of these families are lone parent families with the lone parent in part-time paid work. In 2015/16 the relative child poverty rate for children in this group is just over 39 per cent. The rate rises to 46 per cent by 2017/18 and then more slowly over the rest of the forecast period, reaching 57 per cent by 2028/29.
The yellow line shows child poverty for children in couple families where one partner is working full time and the other partner is not in paid work. Child poverty for children in this group initially rises from just over 29 per cent in 2015/16 to 36 per cent in 2017/18 before falling back to 31 per cent in 2018/19 (a fall which seems to be related to the roll-out of Universal Credit, which is relatively generous for low-income single earner
families23). However, poverty then rises relatively steeply for children in this group from 2019/20 onwards, reaching 48 per cent by 2030/31.
The green line shows relative poverty for children in families where one or more of the adults is full-time self-employed. Poverty for this group is just over 28 per cent in 2017/18, with a substantial jump in forecast child poverty to 33 per cent in 2018/19 followed by a shallower increase over the 2020s, reaching 38 per cent by 2027/28. The jump in forecast child poverty between 2017/18 and 2018/19 for this group appears to be caused by the introduction of Universal Credit, which is considerably less generous for low-income self-employed people due to the “minimum income floor” used in the income assessment, which treats most self-employed people as having gross earnings equivalent to 30 hours’ work per week at the minimum wage even if their earnings are less than this (Dellot, 2017).
Finally, trends in relative child poverty for couples with one adult in full-time paid work and one in part-time paid work (the grey line) and families where all the adults are in full-time paid work (the red line) look similar. There is a rise in forecast child poverty of around 6 percentage points for children in families where all adults work full-time and 7 percentage points for children in couples with one adult working part-time and one full-time. The rise in child poverty for these groups is relatively smooth, and they have the lowest forecast increase (in percentage points) of any of the groups analysed by employment status in this graph. To a large extent this reflects the fact that families in this group are less reliant on social security benefits, tax credits and Universal Credit than any of the other groups. Also, with a relatively high proportion of their net income from earnings, they are able largely to keep pace with upward trends in the relative
23
Page 45 of 81
[image:45.612.73.541.147.540.2]poverty line (as a result of forecast real earnings growth over the 2020s) and so poverty is not forecast to increase that much for these groups.
Figure 3.14. Child poverty rate forecasts: families by employment status
Source: calculations based on outputs from tax-transfer model using FRS pooled dataset 2012/13 to 2015/16
0% 10% 20% 30% 40% 50% 60% 70% 80% 90% 100%
2015/16 2017/18 2019/20 2021/22 2023/24 2025/26 2027/28 2029/30
Child pov
e
rt
y
r
a
te
Page 46 of 81
3.5 Robustness analysis
This section presents the results of our robustness analysis of the results in this report. We vary some of the key parameters in the simulations and show how these variations affect the headline poverty results. The results in this section refer to child poverty measure 1 (relative poverty); we also present results in Appendix 4 for child poverty measure 2 (absolute poverty).
Varying population growth assumptions
Figure 3.15 presents our headline poverty forecast (as shown in Figure 3.1 above) under the heading ‘central scenario’. The green dotted line ‘low pop growth’ shows the impact on the forecast poverty rate of using population forecasts from the Scottish Government which use lower projections for fertility, life expectancy and migration, whereas the red dotted ‘high pop’ growth line uses higher projections for fertility, life expectancy and migration. Meanwhile, the yellow dotted ‘zero net migration’ line uses a forecast where fertility and life expectancy are in line with the central scenario but net migration is set to zero.
The results show that higher population growth leads to an increase in the forecast poverty rate, with the gap between the central scenario and the high population
Page 47 of 81
Figure 3.15. Impact of different population growth assumptions on child poverty measure 1
Source: calculations based on outputs from tax-transfer model using FRS pooled dataset 2012/13 to 2015/16
Varying employment growth assumptions
Figure 3.16 shows the impact of assuming that employment growth in the Scottish economy will be higher or lower than in the central forecast. The green dotted line labelled ‘high employment’ shows results for a scenario where employment is 10% higher than in the central scenario with all other simulation parameters unchanged, while the red dotted line labelled ‘low employment’ shows results for a scenario where employment is 10% lower than in the central scenario. The results show that varying the employment rate has only a minor impact on measured poverty rates; the effect is a maximum of about 0.5 percentage points in either direction. It should be noted that these forecasts assume that the composition of additional employment (in terms of the demographic characteristics of the additional people entering employment in the high employment scenario, or leaving employment in the low employment scenario) is similar to the overall profile of employment in the Scottish economy. Varying this assumption might lead to larger shifts in child poverty as a result of increased or decreased
employment (for example, research by Reed and Portes, 2014, for the Social Mobility and Child Poverty Commission found that forecasts of the UK child poverty rate in 2020
20% 25% 30% 35% 40% 45%
2015 2016 2017 2018 2019 2020 2021 2022 2023 2024 2025 2026 2027 2028 2029 2030
Child pov
e
rt
y
r
a
te
Page 48 of 81
[image:48.612.71.539.160.451.2]were fairly sensitive to assumptions about increased employment for subgroups of the household population with relatively high child poverty rates, such as lone parents).
Figure 3.16. Impact of different employment growth assumptions on child poverty measure 1
Source: calculations based on outputs from tax-transfer model using FRS pooled dataset 2012/13 to 2015/16
Varying wage growth assumptions
Figure 3.17 shows the impact of assuming higher or wages across the UK economy (including Scotland) compared to the central scenario. The green dotted line labelled ‘high wage growth’ shows results for a scenario where wage growth is 0.5 percentage points per year above the central forecast, while the red dotted line ‘low wage growth’ shows results for a scenario where wage growth is 0.5 percentage points per year below the central forecast. The yellow dotted line ‘zero wage growth’ shows a scenario where there is no average wage growth (in real terms) for the rest of the forecast period after 2017-18.
Figure 3.17 shows that assuming lower wage growth leads to a decrease in forecast child poverty while assuming higher wage growth leads to an increase. This is a
well-20% 25% 30% 35% 40% 45%
2015 2016 2017 2018 2019 2020 2021 2022 2023 2024 2025 2026 2027 2028 2029 2030
Child pov
e
rt
y
r
a
te
Page 49 of 81
[image:49.612.67.542.261.572.2]known finding from previous analysis of child poverty statistics; give