School Census Results, 2013
SDR 109/2013 11 July 2013
This Statistical First Release is based upon information collected by the Schools’ Census in January 2013. It
reports information for the number of pupils by age, gender, free school meal eligibility, ethnicity and
special educational needs, together with information on the number of schools, teachers and support staff.
In addition, from January 2013, class size data has been incorporated into the Pupil Level Annual School
Census. The results are published here in tables 17 and 18. These data were previously collected in
September and published as a separate statistical release. This release also includes a new category of
schools – Middle Schools – covering both primary and secondary years. There are currently 4 middle
schools in Wales.
The tables provide all Wales information for each category listed, plus a breakdown to local authority (LA)
level for schools, pupils, teachers and support staff.
Key results from the January 2013 school census
Schools and pupils (Tables 1-6)
•
In January 2013 there were 20 nursery, 1,374 primary, 4 middle schools, 216 secondary schools and 42
special schools. Of these, 452 primary, 2 middle and 53 secondary schools were classified as Welsh
medium. There were 68 independent schools, 2 more than in January 2012. Overall, there were 42
fewer LA maintained schools than at January 2012.
•
The
total number of pupils (headcount) in LA maintained nursery, primary, middle, secondary and
special schools was 464,868, a fall of 1,075 pupils (0.2 per cent) since January 2012.
Chart 1: Number of pupils, by age group, in maintained
schools
0 50,000 100,000 150,000 200,000 250,000
'00 '01 '02 '03 '04 '05 '06 '07 '08 '09 '10 '11 '12 '13
N
um
be
r of
pupils
Under 5 5 to 10 11 to 15 16 & over
•
The numbers of pupils aged
11 to 15 increased from 2000
to 2004 and have decreased
year on year since then.
•
The numbers of pupils aged 5
to 10 have increased to 195,604
in 2013 compared to 193,374 in
2012. Prior to 2011, they had
been decreasing year on year
since 2000.
•
The numbers of pupils aged
under 5 have been increasing
since 2006.
1
Statistician:
Stephen Hughes
Tel:
029 2082 5060
Email:
Teachers and support staff (Tables 7-10)
•
There were 24,770.6 full-time equivalent (FTE) qualified teachers in LA maintained schools, an
increase of 169.8 (0.7 per cent) over the year and the first increase since 2009.
•
The pupil teacher ratio for all LA maintained schools was 18.2 compared with 18.4 in 2012.
•
There were 23,546.8 support staff (FTE) in LA maintained schools, an increase of 1,252.3 staff in the
last year and continuing the trend of recent years. The introduction of the Foundation Phase and the
Teacher Workload Agreement are the two main drivers behind the increase in support staff.
Free school meals (Table 11)
Chart 2: Percentage of pupils known to be eligible for free
school meals
•
The percentage of pupils
known to be eligible for free
school meals in primary,
middle, secondary and special
schools has fluctuated over the
last decade, generally
decreasing from 2004 to 2008
and then increasing year on
year to 2011. There was a
slight decrease from 2011 to
2012 and a very slight increase
from 2012 to 2013.
0 5 10 15 20 25
'04 '05 '06 '07 '08 '09 '10 '11 '12 '13
%
of
e
ligible
pupils
All ages Aged 5-15
•
The percentage of pupils of compulsory school age in LA maintained schools known to be eligible for
free school meals in 2013 was 19.5 per cent – up from 19.3 per cent in 2012.
Ethnicity (Table 12)
•
In LA maintained schools 90.9 per cent of pupils (aged 5 and over) were classified as White British,
8.3 per cent were of minority ethnic origin and 0.7 per cent were unknown or not stated.
Pupils with Special Educational Needs (SEN) (Tables 13-16)
•
In January 2013 13,104 pupils in primary, middle, secondary and special schools had statements of
SEN, 322 less pupils than in January 2012.
•
In primary, middle, secondary and special schools, 2.7 per cent of pupils had statements of SEN and a
further 19.6 per cent of pupils had special educational needs but no statement.
•
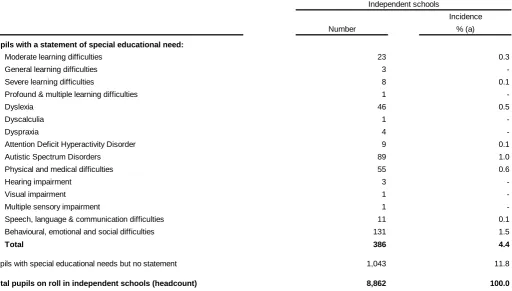
In the
Independent
sector 4.4 per cent of pupils had statements of SEN and a further 11.8 per cent of
pupils had special needs but no statement.
Class size (Tables 17 & 18)
3
Contents
Page
Schools and Pupils
Table 1
Number of schools, by local authority, January 2013
4
Table 2
Welsh medium schools and pupils, by local authority, January 2013
5
Table 3
Number of pupils, by age group, in maintained schools
5
Table 4
Number of pupils, full-time and part-time, by age and sex, in maintained schools,
January 2013
6
Table 5
Pupil numbers, by local authority, January 2013
7
Table 6
Full-time equivalent pupils, by local authority, January 2013
7
Teachers and support staff
Table 7
Number of qualified teachers, by local authority, January 2013
8
Table 8
Full-time equivalent qualified teachers, by local authority, January 2013
9
Table 9
Pupil teacher ratios within schools, by local authority, January 2013
10
Table 10
Full-time equivalent support staff, by local authority, January 2013
10
Free school meals
Table 11
Pupils known to be eligible for free meals in maintained schools
11
Ethnicity
Table 12
Number of pupils aged 5 or over, by ethnic background, January 2013
12
Pupils with Special Educational Needs (SEN)
Table 13
Pupils with special educational needs in independent schools, by major need,
January 2013
13
Table 14
Pupils with a statement of special educational needs in maintained schools, by
type of school and major need, January 2013
14
Table 15
Pupils with a special educational need but no statement, in maintained schools,
by type of school and major need, January 2013
15
Table 16
All pupils with special educational needs in maintained schools, by type of school
and major need, January 2013
16
Class Size
Table 17
Infant class sizes in primary and middle schools
18
Table 18
Junior class sizes in primary and middle schools
19
Schools and Pupils
•
The local authority with the most
schools
was Rhondda Cynon Taf with 135, and the local authority
with the fewest was Blaenau Gwent with 30 schools. (
Table 1
)
•
Gwynedd had the most
Welsh medium primary schools
with 101, and the local authority with the
fewest was Blaenau Gwent with 1 school. Gwynedd had the most
Welsh medium secondary schools
with 13, and there were 4 local authorities with no Welsh medium secondary schools: Merthyr Tydfil,
Blaenau Gwent, Monmouthshire and Newport. (
Table 2
)
•
Of the
pupils aged under 5
in maintained schools in Wales, the majority of them were attending school
on a full time basis. (
Table 4
)
•
In the ten years to 2010, the total
number of pupils in primary schools
in Wales had decreased
year-on-year, but there have been increases each year from January 2011, representing the first increase in the
sector since 1998. (
Table 3
)
•
The
number of pupils
in each local authority ranged between 9,198 in Merthyr Tydfil, to 53,777 in
Cardiff. (
Table 5
)
•
The number of
full-time equivalent pupils in schools
was highest in Cardiff at 51,544.0 pupils and
lowest in Merthyr Tydfil at 9,077.0 pupils. (
Table 6
)
•
The numbers of pupils aged 5 and under have been increasing since 2006 while those of pupils aged
5-10 have been increasing since 2011. The increase in pupil numbers of these two age groups suggests that
the overall pupil numbers in Wales will start increasing in the near future and thereby reverse the long
term downward trend.
Table 1: Number of schools, by local authority, January 2013
Nursery Primary Middle Secondary Special Total Independent All schools
Isle of Anglesey 0 48 0 5 1 54 1 55
Gwynedd 0 102 0 14 2 118 3 121
Conwy 0 59 0 7 1 67 2 69
Denbighshire 0 47 1 7 2 57 4 61
Flintshire 1 71 0 12 2 86 2 88
Wrexham 1 59 0 9 1 70 3 73
Powys 0 88 0 13 3 104 7 111
Ceredigion 0 51 1 6 0 58 1 59
Pembrokeshire 0 61 0 8 1 70 4 74
Carmarthenshire 1 105 0 14 2 122 8 130
Swansea 0 80 0 14 2 96 5 101
Neath Port Talbot 0 68 0 11 3 82 0 82
Bridgend 1 50 0 9 2 62 4 66
The Vale of Glamorgan 3 48 0 8 3 62 3 65
Rhondda Cynon Taf 2 110 1 18 4 135 1 136
Merthyr Tydfil 3 23 0 4 1 31 0 31
Caerphilly 0 75 0 14 1 90 1 91
Blaenau Gwent 0 25 1 3 1 30 0 30
Torfaen 2 29 0 7 1 39 0 39
Monmouthshire 0 31 0 4 1 36 7 43
Newport 3 48 0 8 1 60 1 61
Cardiff 3 96 0 21 7 127 11 138
Wales 20 1,374 4 216 42 1,656 68 1,724
Wales – January 2012 22 1,412 . 221 43 1,698 66 1,764
Wales – January 2011 23 1,435 . 222 43 1,723 66 1,789
Wales – January 2010 25 1,462 . 223 43 1,753 64 1,817
Wales – January 2009 28 1,478 . 223 44 1,773 60 1,833
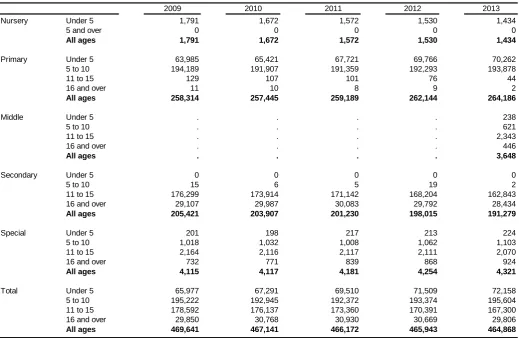
Table 3: Number of pupils, by age group, in maintained schools (a)
Table 2: Welsh medium schools and pupils, by local authority, January 2013
5
Schools Pupils Schools Pupils Schools Pupils
Isle of Anglesey 47 5,325 0 0 4 3,156
Gwynedd 101 9,558 0 0 13 6,069
Conwy 25 2,262 0 0 2 1,444
Denbighshire 18 2,228 0 0 3 3,102
Flintshire 5 845 0 0 1 559
Wrexham 7 1,470 0 0 1 757
Powys 23 3,025 0 0 4 2,368
Ceredigion 45 3,562 1 1,082 5 2,537
Pembrokeshire 19 2,870 0 0 1 1,011
Carmarthenshire 74 9,456 0 0 6 5,560
Swansea 11 2,911 0 0 2 1,480
Neath Port Talbot 11 2,158 0 0 1 993
Bridgend 4 1,090 0 0 1 532
The Vale of Glamorgan 7 1,615 0 0 1 813
Rhondda Cynon Taf 16 4,775 1 552 3 2,613
Merthyr Tydfil 2 577 0 0 0 0
Caerphilly 11 2,745 0 0 1 1,378
Blaenau Gwent 1 294 0 0 0 0
Torfaen 3 785 0 0 1 976
Monmouthshire 2 310 0 0 0 0
Newport 3 614 0 0
Cardiff 17 4,717 0 0
Wales 452 63,192 2 1,634
Wales – January 2012 461 62,446 . .
Wales – January 2011 467 61,073 . .
Wales – January 2010 476 60,318 . .
Wales – January 2009 487 59,989 . .
(a) Primary schools include Welsh Medium, Dual stream and Transitional schools. (b) Include Welsh medium and Bilingual schools.
Primary (a) Middle (b) Secondary (b)
0 0 3 2,344 53 37,692 56 41,262 56 41,764 58 43,432 55 41,916
2009 2010 2011 2012 2013
Nursery Under 5 1,791 1,672 1,572 1,530 1,434
5 and over 0 0 0 0 0
All ages 1,791 1,672 1,572 1,530 1,434
Primary Under 5 63,985 65,421 67,721 69,766 70,262
5 to 10 194,189 191,907 191,359 192,293 193,878
11 to 15 129 107 101 76 44
16 and over 11 10 8 9 2
All ages 258,314 257,445 259,189 262,144 264,186
Middle Under 5 . . . . 238
5 to 10 . . . . 621
11 to 15 . . . . 2,343
16 and over . . . . 446
All ages . . . . 3,648
Secondary Under 5 0 0 0 0 0
5 to 10 15 6 5 19 2
11 to 15 176,299 173,914 171,142 168,204 162,843
16 and over 29,107 29,987 30,083 29,792 28,434
All ages 205,421 203,907 201,230 198,015 191,279
Special Under 5 201 198 217 213 224
5 to 10 1,018 1,032 1,008 1,062 1,103
11 to 15 2,164 2,116 2,117 2,111 2,070
16 and over 732 771 839 868 924
All ages 4,115 4,117 4,181 4,254 4,321
Total Under 5 65,977 67,291 69,510 71,509 72,158
5 to 10 195,222 192,945 192,372 193,374 195,604
11 to 15 178,592 176,137 173,360 170,391 167,300
16 and over 29,850 30,768 30,930 30,669 29,806
All ages 469,641 467,141 466,172 465,943 464,868
2 and
under 3 4 5 6 7 8 9 10 11 12 13 14 15 16 17 18 19+ All ages
Nursery:
Full-time Boys 34 114 12 0 0 0 0 0 0 0 0 0 0 0 0 0 0 0 160
Girls 28 130 3 0 0 0 0 0 0 0 0 0 0 0 0 0 0 0 161
Part-time Boys 153 427 2 0 0 0 0 0 0 0 0 0 0 0 0 0 0 0 582
Girls 121 410 0 0 0 0 0 0 0 0 0 0 0 0 0 0 0 0 531
Total 336 1,081 17 0 0 0 0 0 0 0 0 0 0 0 0 0 0 0 1,434
Primary:
Full-time Boys 425 3,881 17,989 17,343 16,933 16,797 16,424 16,051 15,778 27 0 0 1 0 0 0 0 0 121,649
Girls 406 3,646 17,204 16,616 16,203 15,995 15,477 15,360 14,898 15 0 0 0 0 1 0 1 0 115,822
Part-time Boys 2,359 11,259 48 1 0 0 0 1 0 0 0 0 0 0 0 0 0 0 13,668
Girls 2,290 10,713 42 1 0 0 0 0 0 0 1 0 0 0 0 0 0 0 13,047
Total 5,480 29,499 35,283 33,961 33,136 32,792 31,901 31,412 30,676 42 1 0 1 0 1 0 1 0 264,186
Middle:
Full-time Boys 2 17 54 43 40 56 43 66 59 222 229 203 213 205 82 62 5 0 1,601
Girls 5 22 48 47 54 37 70 42 64 239 245 246 266 275 147 141 9 0 1,957
Part-time Boys 3 37 0 0 0 0 0 0 0 0 0 0 0 0 0 0 0 0 40
Girls 19 31 0 0 0 0 0 0 0 0 0 0 0 0 0 0 0 0 50
Total 29 107 102 90 94 93 113 108 123 461 474 449 479 480 229 203 14 0 3,648
Secondary:
Full-time Boys 0 0 0 0 0 0 0 0 0 15,860 16,094 16,612 17,082 17,645 7,125 5,558 704 34 96,714
Girls 0 0 0 0 0 0 0 0 2 15,056 15,380 15,907 16,379 16,828 7,805 6,554 548 106 94,565
Part-time Boys 0 0 0 0 0 0 0 0 0 0 0 0 0 0 0 0 0 0 0
Girls 0 0 0 0 0 0 0 0 0 0 0 0 0 0 0 0 0 0 0
Total 0 0 0 0 0 0 0 0 2 30,916 31,474 32,519 33,461 34,473 14,930 12,112 1,252 140 191,279
Special:
Full-time Boys 4 23 92 96 115 112 147 134 156 249 284 298 335 347 242 198 153 0 2,985
Girls 1 9 44 36 52 54 62 75 64 97 101 114 109 135 119 95 117 0 1,284
Part-time Boys 3 24 3 0 0 0 0 0 0 0 0 0 1 0 0 0 0 0 31
Girls 3 16 2 0 0 0 0 0 0 0 0 0 0 0 0 0 0 0 21
Total 11 72 141 132 167 166 209 209 220 346 385 412 445 482 361 293 270 0 4,321
Total 5,856 30,759 35,543 34,183 33,397 33,051 32,223 31,729 31,021 31,765 32,334 33,380 34,386 35,435 15,521 12,608 1,537 140 464,868
[image:6.595.31.803.58.482.2](a) Age as at 31 August 2012
Table 5: Pupil numbers, by local authority, January 2013
Nursery Primary Middle Secondary Special Total Independent All schools
Isle of Anglesey 0 5,508 0 3,977 73 9,558 105 9,663
Gwynedd 0 9,676 0 7,345 130 17,151 365 17,516
Conwy 0 8,694 0 7,209 167 16,070 801 16,871
Denbighshire 0 8,093 500 6,792 245 15,630 417 16,047
Flintshire 54 13,480 0 9,997 220 23,751 27 23,778
Wrexham 49 12,315 0 6,577 264 19,205 23 19,228
Powys 0 10,350 0 8,304 294 18,948 458 19,406
Ceredigion 0 4,636 1,082 3,826 0 9,544 7 9,551
Pembrokeshire 0 10,328 0 7,704 137 18,169 219 18,388
Carmarthenshire 81 15,127 0 11,775 117 27,100 748 27,848
Swansea 0 21,056 0 13,883 163 35,102 391 35,493
Neath Port Talbot 0 12,213 0 8,100 196 20,509 0 20,509
Bridgend 30 12,416 0 9,608 426 22,480 409 22,889
The Vale of Glamorgan 253 11,998 0 9,448 252 21,951 200 22,151
Rhondda Cynon Taf 63 21,810 552 16,168 480 39,073 1 39,074
Merthyr Tydfil 148 5,296 0 3,606 148 9,198 0 9,198
Caerphilly 0 16,787 0 11,794 124 28,705 129 28,834
Blaenau Gwent 0 5,812 1,514 2,350 98 9,774 0 9,774
Torfaen 141 8,092 0 7,174 91 15,498 0 15,498
Monmouthshire 0 6,625 0 5,020 45 11,690 1,494 13,184
Newport 272 13,545 0 10,493 129 24,439 614 25,053
Cardiff 343 30,329 0 20,129 522 51,323 2,454 53,777
Wales 1,434 264,186 3,648 191,279 4,321 464,868 8,862 473,730
Wales – January 2012 1,530 262,144 . 198,015 4,254 465,943 8,929 474,872
Wales – January 2011 1,572 259,189 . 201,230 4,181 466,172 9,088 475,260
Wales – January 2010 1,672 257,445 . 203,907 4,117 467,141 9,222 476,363
Wales – January 2009 1,791 258,314 . 205,421 4,115 469,641 9,302 478,943
Maintained schools
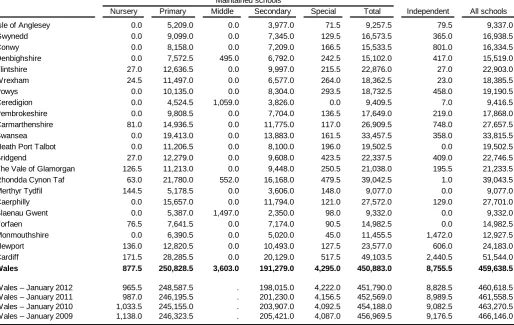
Table 6: Full-time equivalent pupils, by local authority, January 2013
FTE
Nursery Primary Middle Secondary Special Total Independent All schools
Isle of Anglesey 0.0 5,209.0 0.0 3,977.0 71.5 9,257.5 79.5 9,337.0
Gwynedd 0.0 9,099.0 0.0 7,345.0 129.5 16,573.5 365.0 16,938.5
Conwy 0.0 8,158.0 0.0 7,209.0 166.5 15,533.5 801.0 16,334.5
Denbighshire 0.0 7,572.5 495.0 6,792.0 242.5 15,102.0 417.0 15,519.0
Flintshire 27.0 12,636.5 0.0 9,997.0 215.5 22,876.0 27.0 22,903.0
Wrexham 24.5 11,497.0 0.0 6,577.0 264.0 18,362.5 23.0 18,385.5
Powys 0.0 10,135.0 0.0 8,304.0 293.5 18,732.5 458.0 19,190.5
Ceredigion 0.0 4,524.5 1,059.0 3,826.0 0.0 9,409.5 7.0 9,416.5
Pembrokeshire 0.0 9,808.5 0.0 7,704.0 136.5 17,649.0 219.0 17,868.0
Carmarthenshire 81.0 14,936.5 0.0 11,775.0 117.0 26,909.5 748.0 27,657.5
Swansea 0.0 19,413.0 0.0 13,883.0 161.5 33,457.5 358.0 33,815.5
Neath Port Talbot 0.0 11,206.5 0.0 8,100.0 196.0 19,502.5 0.0 19,502.5
Bridgend 27.0 12,279.0 0.0 9,608.0 423.5 22,337.5 409.0 22,746.5
The Vale of Glamorgan 126.5 11,213.0 0.0 9,448.0 250.5 21,038.0 195.5 21,233.5
Rhondda Cynon Taf 63.0 21,780.0 552.0 16,168.0 479.5 39,042.5 1.0 39,043.5
Merthyr Tydfil 144.5 5,178.5 0.0 3,606.0 148.0 9,077.0 0.0 9,077.0
Caerphilly 0.0 15,657.0 0.0 11,794.0 121.0 27,572.0 129.0 27,701.0
Blaenau Gwent 0.0 5,387.0 1,497.0 2,350.0 98.0 9,332.0 0.0 9,332.0
Torfaen 76.5 7,641.5 0.0 7,174.0 90.5 14,982.5 0.0 14,982.5
Monmouthshire 0.0 6,390.5 0.0 5,020.0 45.0 11,455.5 1,472.0 12,927.5
Newport 136.0 12,820.5 0.0 10,493.0 127.5 23,577.0 606.0 24,183.0
Cardiff 171.5 28,285.5 0.0 20,129.0 517.5 49,103.5 2,440.5 51,544.0
Wales 877.5 250,828.5 3,603.0 191,279.0 4,295.0 450,883.0 8,755.5 459,638.5
Wales – January 2012 965.5 248,587.5 . 198,015.0 4,222.0 451,790.0 8,828.5 460,618.5
Wales – January 2011 987.0 246,195.5 . 201,230.0 4,156.5 452,569.0 8,989.5 461,558.5
Wales – January 2010 1,033.5 245,155.0 . 203,907.0 4,092.5 454,188.0 9,082.5 463,270.5
Wales – January 2009 1,138.0 246,323.5 . 205,421.0 4,087.0 456,969.5 9,176.5 466,146.0
Maintained schools
[image:7.595.35.550.430.755.2]Teachers and support staff
•
The
number of teachers
in maintained schools in each local authority ranged between 3,089 in Cardiff,
to 514 in Merthyr Tydfil. (
Table 7
)
•
The number of
full-time equivalent qualified teachers in schools
was highest in Cardiff at 2,769.6
teachers and lowest in Merthyr Tydfil at 486.6 teachers. (
Table 8
)
•
Ceredigion had the lowest primary
pupil teacher ratio
at 17.5, and Torfaen had the highest at 23.6. The
lowest secondary pupil teacher ratio was also in Ceredigion at 14.1, and the highest was in Swansea at
17.5. (
Table 9
)
•
The
pupil teacher ratio
is highest in primary schools at 20.7 and lowest in special schools at 6.7. (
Table 9
)
•
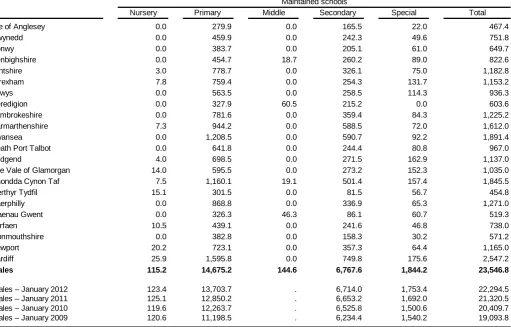
The number of
full-time equivalent support staff in schools
was highest in Cardiff at 2,547.2 support
staff, and lowest in Merthyr Tydfil at 454.8 support staff. (
Table 10
)
•
The introduction of the Foundation Phase and the Teacher Workload Agreement are the two main
drivers behind the increase in support staff. (
Table 10
)
Table 7: Number of qualified teachers, by local authority, January 2013
Nursery Primary Middle Secondary Special Total Independent All schools
Isle of Anglesey 0 281 0 260 15 556 10 566
Gwynedd 0 524 0 515 19 1,058 54 1,112
Conwy 0 476 0 479 25 980 135 1,115
Denbighshire 0 436 36 459 37 968 57 1,025
Flintshire 2 693 0 667 37 1,399 9 1,408
Wrexham 3 656 0 445 29 1,133 12 1,145
Powys 0 607 0 575 49 1,231 84 1,315
Ceredigion 0 298 68 294 0 660 4 664
Pembrokeshire 0 567 0 488 23 1,078 32 1,110
Carmarthenshire 4 878 0 786 23 1,691 116 1,807
Swansea 0 1,008 0 851 33 1,892 59 1,951
Neath Port Talbot 0 601 0 540 34 1,175 0 1,175
Bridgend 3 588 0 625 49 1,265 68 1,333
The Vale of Glamorgan 11 633 0 595 54 1,293 55 1,348
Rhondda Cynon Taf 7 1,033 43 1,016 63 2,162 2 2,164
Merthyr Tydfil 10 270 0 217 17 514 0 514
Caerphilly 0 765 0 731 24 1,520 14 1,534
Blaenau Gwent 0 303 92 155 14 564 0 564
Torfaen 4 347 0 447 13 811 0 811
Monmouthshire 0 348 0 322 12 682 206 888
Newport 6 655 0 649 25 1,335 62 1,397
Cardiff 17 1,566 0 1,403 103 3,089 292 3,381
Wales 67 13,533 239 12,519 698 27,056 1,271 28,327
Wales – January 2012 73 13,451 . 12,651 694 26,869 1,284 28,153
Wales – January 2011 72 13,399 . 12,935 702 27,108 1,309 28,417
Wales – January 2010 78 13,582 . 13,102 673 27,435 1,297 28,732
Wales – January 2009 82 13,726 . 13,219 675 27,702 1,267 28,969
Table 8: Full-time equivalent qualified teachers, by local authority, January 2013
FTE
Nursery Primary Middle Secondary Special Total Independent All schools
Isle of Anglesey 0.0 254.3 0.0 241.7 14.0 510.1 9.0 519.0
Gwynedd 0.0 458.9 0.0 479.6 18.6 957.1 48.3 1,005.4
Conwy 0.0 420.0 0.0 453.8 23.9 897.7 123.0 1,020.7
Denbighshire 0.0 382.5 28.6 420.4 32.8 864.3 54.9 919.2
Flintshire 1.0 614.2 0.0 611.5 32.9 1,259.6 8.6 1,268.2
Wrexham 2.6 579.2 0.0 413.5 27.7 1,023.0 10.9 1,034.0
Powys 0.0 525.8 0.0 529.1 44.0 1,098.9 63.3 1,162.2
Ceredigion 0.0 259.2 62.0 272.2 0.0 593.4 3.5 596.9
Pembrokeshire 0.0 488.4 0.0 456.8 20.7 966.0 25.4 991.4
Carmarthenshire 4.0 779.5 0.0 730.7 23.0 1,537.2 101.6 1,638.8
Swansea 0.0 901.2 0.0 793.3 29.8 1,724.2 47.4 1,771.6
Neath Port Talbot 0.0 544.2 0.0 511.3 30.6 1,086.1 0.0 1,086.1
Bridgend 2.0 548.8 0.0 592.8 46.4 1,190.0 56.7 1,246.7
The Vale of Glamorgan 9.4 562.8 0.0 568.5 46.8 1,187.5 44.1 1,231.6
Rhondda Cynon Taf 6.6 977.5 41.2 964.3 58.0 2,047.6 2.0 2,049.6
Merthyr Tydfil 10.0 252.3 0.0 207.2 17.0 486.6 0.0 486.6
Caerphilly 0.0 711.3 0.0 690.0 20.2 1,421.5 9.3 1,430.8
Blaenau Gwent 0.0 280.6 90.9 148.0 14.0 533.5 0.0 533.5
Torfaen 4.0 324.2 0.0 421.7 12.0 761.9 0.0 761.9
Monmouthshire 0.0 305.4 0.0 307.9 11.4 624.7 194.2 818.9
Newport 5.2 599.1 0.0 604.9 21.0 1,230.3 57.8 1,288.1
Cardiff 13.4 1,375.2 0.0 1,288.0 92.9 2,769.6 247.9 3,017.5
Wales 58.3 12,144.6 222.7 11,707.2 637.7 24,770.6 1,108.1 25,878.7
Wales – January 2012 63.6 12,026.2 . 11,868.3 642.6 24,600.7 1,096.2 25,696.9
Wales – January 2011 62.7 11,998.7 . 12,144.7 648.2 24,854.4 1,117.3 25,971.7
Wales – January 2010 68.6 12,206.6 . 12,379.0 632.3 25,286.6 1,109.5 26,396.0
Wales – January 2009 73.9 12,342.5 . 12,515.0 630.6 25,562.0 1,097.2 26,659.2
Maintained schools
Table 9: Pupil teacher ratios within schools, by local authority, January 2013
Nursery Primary Middle Secondary Special Total Independent All schools
Isle of Anglesey . 20.5 . 16.5 5.1 18.1 8.9 18.0
Gwynedd . 19.8 . 15.3 7.0 17.3 7.5 16.8
Conwy . 19.4 . 15.9 7.0 17.3 6.5 16.0
Denbighshire . 19.8 17.3 16.2 7.4 17.5 7.6 16.9
Flintshire 27.4 20.6 . 16.3 6.5 18.2 3.1 18.1
Wrexham 9.4 19.8 . 15.9 9.5 17.9 2.1 17.8
Powys . 19.3 . 15.7 6.7 17.0 7.2 16.5
Ceredigion . 17.5 17.1 14.1 . 15.9 2.0 15.8
Pembrokeshire . 20.1 . 16.9 6.6 18.3 8.6 18.0
Carmarthenshire 20.3 19.2 . 16.1 5.1 17.5 7.4 16.9
Swansea . 21.5 . 17.5 5.4 19.4 7.6 19.1
Neath Port Talbot . 20.6 . 15.8 6.4 18.0 . 18.0
Bridgend 13.4 22.4 . 16.2 9.1 18.8 7.2 18.2
The Vale of Glamorgan 13.4 19.9 . 16.6 5.4 17.7 4.4 17.2
Rhondda Cynon Taf 9.6 22.3 13.4 16.8 8.3 19.1 . 19.0
Merthyr Tydfil 14.5 20.5 . 17.4 8.7 18.7 . 18.7
Caerphilly . 22.0 . 17.1 6.0 19.4 13.9 19.4
Blaenau Gwent . 19.2 16.5 15.9 7.0 17.5 . 17.5
Torfaen 19.1 23.6 . 17.0 7.5 19.7 . 19.7
Monmouthshire . 20.9 . 16.3 3.9 18.3 7.6 15.8
Newport 26.0 21.4 . 17.3 6.1 19.2 10.5 18.8
Cardiff 12.8 20.6 . 15.6 5.6 17.7 9.8 17.1
Wales 15.1 20.7 16.2 16.3 6.7 18.2 7.9 17.8
Wales – January 2012 15.2 20.7 . 16.7 6.6 18.4 8.1 17.9
Wales – January 2011 15.7 20.5 . 16.6 6.4 18.2 8.0 17.8
Wales – January 2010 15.1 20.1 . 16.5 6.5 18.0 8.2 17.6
Wales – January 2009 15.4 20.0 . 16.4 6.5 17.9 8.4 17.5
Maintained schools
Table 10: Full-time equivalent support staff, by local authority, January 2013
FTE
Nursery Primary Middle Secondary Special Total
Isle of Anglesey 0.0 279.9 0.0 165.5 22.0 467.4
Gwynedd 0.0 459.9 0.0 242.3 49.6 751.8
Conwy 0.0 383.7 0.0 205.1 61.0 649.7
Denbighshire 0.0 454.7 18.7 260.2 89.0 822.6
Flintshire 3.0 778.7 0.0 326.1 75.0 1,182.8
Wrexham 7.8 759.4 0.0 254.3 131.7 1,153.2
Powys 0.0 563.5 0.0 258.5 114.3 936.3
Ceredigion 0.0 327.9 60.5 215.2 0.0 603.6
Pembrokeshire 0.0 781.6 0.0 359.4 84.3 1,225.2
Carmarthenshire 7.3 944.2 0.0 588.5 72.0 1,612.0
Swansea 0.0 1,208.5 0.0 590.7 92.2 1,891.4
Neath Port Talbot 0.0 641.8 0.0 244.4 80.8 967.0
Bridgend 4.0 698.5 0.0 271.5 162.9 1,137.0
The Vale of Glamorgan 14.0 595.5 0.0 273.2 152.3 1,035.0
Rhondda Cynon Taf 7.5 1,160.1 19.1 501.4 157.4 1,845.5
Merthyr Tydfil 15.1 301.5 0.0 81.5 56.7 454.8
Caerphilly 0.0 868.8 0.0 336.9 65.3 1,271.0
Blaenau Gwent 0.0 326.3 46.3 86.1 60.7 519.3
Torfaen 10.5 439.1 0.0 241.6 46.8 738.0
Monmouthshire 0.0 382.8 0.0 158.3 30.2 571.2
Newport 20.2 723.1 0.0 357.3 64.4 1,165.0
Cardiff 25.9 1,595.8 0.0 749.8 175.6 2,547.2
Wales 115.2 14,675.2 144.6 6,767.6 1,844.2 23,546.8
Wales – January 2012 123.4 13,703.7 . 6,714.0 1,753.4 22,294.5
Wales – January 2011 125.1 12,850.2 . 6,653.2 1,692.0 21,320.5
Wales – January 2010 119.6 12,263.7 . 6,525.8 1,500.6 20,409.7
Wales – January 2009 120.6 11,198.5 . 6,234.4 1,540.2 19,093.8
[image:10.595.40.552.431.758.2]Free school meals (FSM)
•
The
number of pupils eligible for free meals
has increased from 82,543 pupils in January 2012 to 83,498
pupils in January 2013.
•
Since 2008, the
percentage of compulsory aged school pupils known to be eligible for free meals
has
increased year on year with the exception of 2011 and 2012 when there was a slight decrease. The
overall increasing trend may be related to that seen in the number of claimants of Jobseeker’s Allowance
in Wales, which is one of the criteria for eligibility for free meals (more information can be seen in the
Key Quality Information at the back of this release).
•
The percentage of pupils known to be eligible for free meals was highest in special schools at 42.1 per
cent. (
Table 11
)
Table 11: Pupils known to be eligible for free meals in maintained schools (a)
Number Per Cent Number Per Cent Number Per Cent Number Per Cent Number Per Cent Number Per Cent
All pupils:
2009 170 9.5 44,083 17.1 . . 30,426 14.8 1,543 37.5 76,222 16.2
2010 159 9.5 47,212 18.3 . . 31,737 15.6 1,641 39.9 80,749 17.3
2011 143 9.1 50,560 19.5 . . 32,314 16.1 1,789 42.8 84,806 18.2
2012 133 8.7 49,391 18.8 . . 31,276 15.8 1,743 41.0 82,543 17.7
2013 106 7.4 50,056 18.9 557 15.3 30,962 16.2 1,817 42.1 83,498 18.0
Aged 5-15:
2009 . . 36,525 18.8 . . 28,713 16.3 1,257 39.5 66,495 17.8
2010 . . 38,665 20.1 . . 29,805 17.1 1,321 42.0 69,791 18.9
2011 . . 40,422 21.1 . . 30,247 17.7 1,404 44.9 72,073 19.7
2012 . . 39,656 20.6 . . 29,252 17.4 1,357 42.8 70,265 19.3
2013 . . 40,135 20.7 508 17.1 28,835 17.7 1,415 44.6 70,893 19.5
(a)At January each year.
All Schools Nursery schools Primary Schools Middle schools Secondary Schools Special Schools
Ethnicity
•
Of the
total number of pupils aged 5 or over
at primary, middle, secondary and special schools in
Wales, over 9 in 10 pupils were classed as White British.
•
The
percentage of pupils
whose ethnic background was classified as minority ethnic origin was slightly
higher in primary schools than in secondary or special schools.
•
Of the
pupils whose ethnic background was classified as Black
, 80.3 per cent of them were classified
as Black African.
•
Of the
pupils whose ethnic background was classified as Asian
, 20.9 per cent of them were classified
as Indian, 32.7 per cent as Pakistani, and 35.4 per cent as Bangladeshi.
(Table 12)
Table 12: Number of pupils aged 5 or over, by ethnic background, January 2013
Per Per Per Per Per
cent cent cent cent cent
Ethnic background Number (a) Number (a) Number (a) Number (a) Number (a)
White 179,164 92.4 3,303 96.9 179,104 93.6 3,785 92.4 365,356 93.0
White British 174,538 90.0 3,208 94.1 175,679 91.8 3,731 91.1 357,156 90.9
Traveller of Irish Heritage 240 0.1 0 0.0 94 0.0 11 0.3 345 0.1
Gypsy/ Roma 334 0.2 0 0.0 176 0.1 6 0.1 516 0.1
Any other White background 4,052 2.1 95 2.8 3,155 1.6 37 0.9 7,339 1.9
Mixed 4,869 2.5 29 0.9 3,811 2.0 99 2.4 8,808 2.2
White and Black Caribbean 1,069 0.6 5 0.1 993 0.5 15 0.4 2,082 0.5
White and Black African 628 0.3 2 0.1 411 0.2 11 0.3 1,052 0.3
White and Asian 1,127 0.6 4 0.1 867 0.5 18 0.4 2,016 0.5
Any other mixed background 2,045 1.1 18 0.5 1,540 0.8 55 1.3 3,658 0.9
Asian 4,599 2.4 12 0.4 3,583 1.9 82 2.0 8,276 2.1
Indian 1,072 0.6 6 0.2 644 0.3 9 0.2 1,731 0.4
Pakistani 1,479 0.8 0 0.0 1,187 0.6 38 0.9 2,704 0.7
Bangladeshi 1,551 0.8 5 0.1 1,348 0.7 29 0.7 2,933 0.7
Any other Asian background 497 0.3 1 0.0 404 0.2 6 0.1 908 0.2
Black 1,525 0.8 4 0.1 1,301 0.7 45 1.1 2,875 0.7
Black Caribbean 90 0.0 0 0.0 111 0.1 0 0.0 201 0.1
Black African 1,241 0.6 3 0.1 1,025 0.5 39 1.0 2,308 0.6
Any other Black background 194 0.1 1 0.0 165 0.1 6 0.1 366 0.1
Chinese 311 0.2 5 0.1 346 0.2 5 0.1 667 0.2
Any other ethnic group 2,166 1.1 30 0.9 1,726 0.9 29 0.7 3,951 1.0
Total with valid category 192,634 99.3 3,383 99.2 189,871 99.3 4,045 98.7 389,933 99.3
Unknown or not stated 1,290 0.7 27 0.8 1,408 0.7 52 1.3 2,777 0.7
All pupils 193,924 100.0 3,410 100.0 191,279 100.0 4,097 100.0 392,710 100.0
(a) Of all pupils aged 5 or over.
•
22.4 per cent of
all pupils at primary, middle, secondary and special schools
in Wales have some form
of special educational need; 12.3 per cent of the pupils with special educational needs have statements
of SEN.
(Table 14)
•
All
pupils at special schools
have some form of special educational need; 93.9 per cent of these pupils
with SEN have statements of SEN. Of the pupils
with special educational needs, the most common
major need was severe learning difficulties, representing 31.2 per cent all pupils with some form of SEN.
(Table 14 & Table 15)
•
21.5 per cent of
pupils at primary schools
have some form of special educational need; 6.7 per cent of
these pupils with SEN have statements of SEN. Of the pupils
with special educational needs, the most
common major need was moderate learning difficulties, representing 28.1 per cent of pupils with some
form of SEN.
(Table 14 & Table 15)
13
Special educational needs (SEN)
•
16.1 per cent of
pupils at independent schools
have some form of special educational need; 27.0 per
cent of these pupils with SEN have statements of SEN. Of the pupils with statements of special
educational needs, 33.9 per cent had behavioural, emotional and social difficulties as their major need,
23.1 per cent of pupils had autistic spectrum disorders and 14.2 per cent of pupils had physical and
medical difficulties as their major need. (
Table 13
)
[image:13.595.40.553.433.724.2]•
21.7 per cent of
pupils at secondary schools
have some form of special educational need; 11.4 per cent
of these pupils with SEN have statements of SEN. Of the pupils with special educational needs, the
most common major need was moderate learning difficulties, representing 30.2 per cent of all pupils
with some form of SEN.
(Table 14 & Table 15)
Table 13: Pupils with special educational needs in independent schools, by major need, January
2013
Incidence % (a) 23 0.3 3 -8 0.1 1 -46 0.5 1 -4 -9 0.1 89 1.0 55 0.6 3 -1 -1 -11 0.1 131 1.5 386 4.4 043 11.8 ,862 100.0 pendent schools. ndependent schools NumberPupils with a statement of special educational need:
Moderate learning difficulties
General learning difficulties
Severe learning difficulties
Profound & multiple learning difficulties
Dyslexia
Dyscalculia
Dyspraxia
Attention Deficit Hyperactivity Disorder
Autistic Spectrum Disorders
Physical and medical difficulties
Hearing impairment Visual impairment
Multiple sensory impairment
Speech, language & communication difficulties
Behavioural, emotional and social difficulties
Total
Pupils with special educational needs but no statement 1,
Total pupils on roll in independent schools (headcount) 8
Table 14: Pupils with a statement of special educational needs in maintained schools, by type of school and major need, January 2013
Total
Incidence Placement Incidence Placement Incidence Placement Incidence Placement
Major need Number % (a) % (b) Number % (a) % (b) Number % (a) % (b) Number % (a) % (b) Number
Moderate learning difficulties 513 0.2 4.0 33 0.9 0.3 871 0.5 6.8 494 11.4 3.9 1,911
General learning difficulties 62 - 0.5 4 0.1 - 111 0.1 0.9 2 - - 179
Severe learning difficulties 259 0.1 2.0 9 0.2 0.1 243 0.1 1.9 1,298 30.0 10.2 1,809
Profound & multiple learning difficulties 109 - 0.9 1 - - 61 - 0.5 451 10.4 3.5 622
Dyslexia 49 - 0.4 3 0.1 - 368 0.2 2.9 3 0.1 - 423
Dyscalculia 0 0.0 0.0 0 0.0 0.0 6 - - 0 0.0 0.0 6
Dyspraxia 7 - 0.1 2 0.1 - 19 - 0.1 3 0.1 - 31
Attention Deficit Hyperactivity Disorder 48 - 0.4 3 0.1 - 64 - 0.5 13 0.3 0.1 128
Autistic Spectrum Disorders 762 0.3 6.0 20 0.5 0.2 905 0.5 7.1 963 22.3 7.6 2,650
Physical and medical difficulties 529 0.2 4.2 7 0.2 0.1 405 0.2 3.2 184 4.3 1.4 1,125
Hearing impairment 175 0.1 1.4 2 0.1 - 151 0.1 1.2 14 0.3 0.1 342
Visual impairment 96 - 0.8 1 - - 106 0.1 0.8 13 0.3 0.1 216
Multiple sensory impairment 9 - 0.1 1 - - 4 - - 11 0.3 0.1 25
Speech, language & communication 860 0.3 6.8 10 0.3 0.1 859 0.4 6.8 193 4.5 1.5 1,922
difficulties
Behavioural, emotional and social 321 0.1 2.5 19 0.5 0.1 572 0.3 4.5 417 9.7 3.3 1,329
difficulties
Total 3,799 1.4 29.9 115 3.2 0.9 4,745 2.5 37.3 4,059 93.9 31.9 12,718
(a) Incidence of pupils - the number of pupils expressed as a proportion of the total number of pupils on roll within EACH school type.
(b) Placement of pupils - the number of pupils expressed as a proportion of the total number of pupils within each SEN grouping in Primary, Middle, Secondary and Special schools combined. e.g. Number of pupils with a statement of SEN of moderate learning difficulties divided by the total number of pupils with a statement of SEN in Primary+Middle+Secondary+Special schools.
Table 15: Pupils with a special educational need but no statement, in maintained schools, by type of school and major need, January 2013
Total
Incidence Placement Incidence Placement Incidence Placement Incidence Placement
Major need Number % (a) % (b) Number % (a) % (b) Number % (a) % (b) Number % (a) % (b) Number
Moderate learning difficulties 15,478 5.9 17.0 90 2.5 0.1 11,708 6.1 12.9 56 1.3 0.1 27,332
General learning difficulties 13,491 5.1 14.8 133 3.6 0.1 7,225 3.8 7.9 3 0.1 - 20,852
Severe learning difficulties 457 0.2 0.5 0 0.0 0.0 144 0.1 0.2 51 1.2 0.1 652
Profound & multiple learning difficulties 109 - 0.1 0 0.0 0.0 20 - - 21 0.5 - 150
Dyslexia 2,612 1.0 2.9 260 7.1 0.3 5,866 3.1 6.5 0 0.0 0.0 8,738
Dyscalculia 175 0.1 0.2 38 1.0 - 263 0.1 0.3 0 0.0 0.0 476
Dyspraxia 199 0.1 0.2 2 0.1 - 305 0.2 0.3 0 0.0 0.0 506
Attention Deficit Hyperactivity Disorder 391 0.1 0.4 3 0.1 - 462 0.2 0.5 2 - - 858
Autistic Spectrum Disorders 789 0.3 0.9 2 0.1 - 725 0.4 0.8 57 1.3 0.1 1,573
Physical and medical difficulties 1,801 0.7 2.0 20 0.5 - 1,357 0.7 1.5 2 - - 3,180
Hearing impairment 1,018 0.4 1.1 14 0.4 - 698 0.4 0.8 0 0.0 0.0 1,730
Visual impairment 351 0.1 0.4 3 0.1 - 270 0.1 0.3 0 0.0 0.0 624
Multiple sensory impairment 17 - - 0 0.0 0.0 22 - - 1 - - 40
Speech, language & communication 10,034 3.8 11.0 69 1.9 0.1 1,787 0.9 2.0 13 0.3 - 11,903
difficulties
Behavioural, emotional and social 6,194 2.3 6.8 71 1.9 0.1 5,948 3.1 6.5 54 1.2 0.1 12,267
difficulties
Total 53,116 20.1 58.4 705 19.3 0.8 36,800 19.2 40.5 260 6.0 0.3 90,881
(a) Incidence of pupils - the number of pupils expressed as a proportion of the total number of pupils on roll within EACH school type.
(b) Placement of pupils - the number of pupils expressed as a proportion of the total number of pupils within each SEN grouping in Primary, Middle, Secondary and Special schools combined. e.g. Number of pupils with a statement of SEN of moderate learning difficulties divided by the total number of pupils with a statement of SEN in Primary+Middle+Secondary+Special schools.
Middle
Primary Secondary Special
Total
Incidence Placement Incidence Placement Incidence Placement Incidence Placement
Major need Number % (a) % (b) Number % (a) % (b) Number % (a) % (b) Number % (a) % (b) Number
Moderate learning difficulties 15,991 6.1 15.4 123 3.4 0.1 12,579 6.6 12.1 550 12.7 0.5 29,243
General learning difficulties 13,553 5.1 13.1 137 3.8 0.1 7,336 3.8 7.1 5 0.1 - 21,031
Severe learning difficulties 716 0.3 0.7 9 0.2 - 387 0.2 0.4 1,349 31.2 1.3 2,461
Profound & multiple learning difficulties 218 0.1 0.2 1 - - 81 - 0.1 472 10.9 0.5 772
Dyslexia 2,661 1.0 2.6 263 7.2 0.3 6,234 3.3 6.0 3 0.1 - 9,161
Dyscalculia 175 0.1 0.2 38 1.0 - 269 0.1 0.3 0 0.0 0.0 482
Dyspraxia 206 0.1 0.2 4 0.1 - 324 0.2 0.3 3 0.1 - 537
Attention Deficit Hyperactivity Disorder 439 0.2 0.4 6 0.2 - 526 0.3 0.5 15 0.3 - 986
Autistic Spectrum Disorders 1,551 0.6 1.5 22 0.6 - 1,630 0.9 1.6 1,020 23.6 1.0 4,223
Physical and medical difficulties 2,330 0.9 2.2 27 0.7 - 1,762 0.9 1.7 186 4.3 0.2 4,305
Hearing impairment 1,193 0.5 1.2 16 0.4 - 849 0.4 0.8 14 0.3 - 2,072
Visual impairment 447 0.2 0.4 4 0.1 - 376 0.2 0.4 13 0.3 - 840
Multiple sensory impairment 26 - - 1 - - 26 - - 12 0.3 - 65
Speech, language & communication 10,894 4.1 10.5 79 2.2 0.1 2,646 1.4 2.6 206 4.8 0.2 13,825
difficulties
Behavioural, emotional and social 6,515 2.5 6.3 90 2.5 0.1 6,520 3.4 6.3 471 10.9 0.5 13,596
difficulties
Total 56,915 21.5 54.9 820 22.5 0.8 41,545 21.7 40.1 4,319 100.0 4.2 103,599
Total number of pupils on roll 264,186 3,648 191,279 4,321 463,434
(a) Incidence of pupils - the number of pupils expressed as a proportion of the total number of pupils on roll within EACH school type.
(b) Placement of pupils - the number of pupils expressed as a proportion of the total number of pupils within each SEN grouping in Primary, Middle, Secondary and Special schools combined. e.g. Number of pupils with a statement of SEN of moderate learning difficulties divided by the total number of pupils with a statement of SEN in Primary+Middle+Secondary+Special schools.
[image:16.595.34.795.53.311.2]Primary Middle Secondary Special
17
Class sizes
•
The January 2013 PLASC count was the first time class size data has been collected from schools,
replacing the annual local authority collection in September. The timing of these different collections is
significant here as the January pupil cohort would be greater than the September one. Care should be
taken when comparing data from these two collections.
•
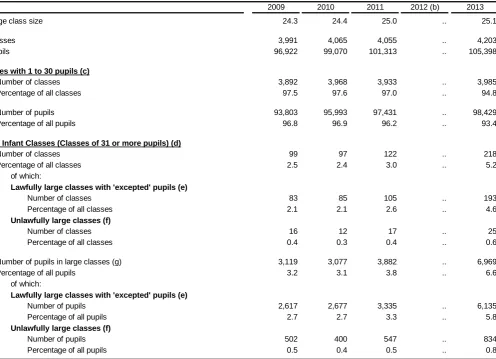
6.6 per cent of pupils (6,969) were in infant classes of over 30 pupils, up from 3.8 per cent in September
2011. (Table 17)
•
218 infant classes (5.2 per cent) in Wales had more than 30 pupils, with 193 of these classes having
permissible exceptions. This is more than at September 2011 when 122 classes (3.0 per cent) had over 30
pupils, of which 105 had permissible exceptions. (Table 17)
•
5.9 per cent of Key Stage 2 classes (308) were regarded as large classes and had a total of 9,770 pupils
(7.7 per cent of all pupils). This is more than at September 2011 when 257 classes (5.1 per cent) were
considered large and they had a total of 8,175 pupils (6.6 percent of all pupils). (Table 18)
Table 17: Infant class sizes in primary and middle schools (a)
2009 2010 2011 2012 (b) 2013
24.3 24.4 25.0 .. 25.1
3,991 4,065 4,055 .. 4,203
96,922 99,070 101,313 .. 105,398
3,892 3,968 3,933 .. 3,985
97.5 97.6 97.0 .. 94.8
93,803 95,993 97,431 .. 98,429
96.8 96.9 96.2 .. 93.4
99 97 122 .. 218
2.5 2.4 3.0 .. 5.2
Number of classes 83 85 105 .. 193
Percentage of all classes 2.1 2.1 2.6 .. 4.6
Number of classes 16 12 17 .. 25
Percentage of all classes 0.4 0.3 0.4 .. 0.6
3,119 3,077 3,882 .. 6,969
3.2 3.1 3.8 .. 6.6
Number of pupils 2,617 2,677 3,335 .. 6,135
Percentage of all pupils 2.7 2.7 3.3 .. 5.8
Number of pupils 502 400 547 .. 834
Percentage of all pupils 0.5 0.4 0.5 .. 0.8
(a)
(b) No data collection in September 2012. (c)
(d)
(e)
(f) Classes of 31 or more, excluding those large classes engaged in an excepted activity. (g) Includes all pupils in large classes, including those with excepted activity.
Both infant and junior classes with one teacher are allowed to have more than 30 children in very specific circumstances. These are called exceptions. Exception categories for infant classes are defined in the Schedule to the Education (Infant Class Sizes) (Wales) Regulations 1998, as amended by the Education (Infant Class Sizes) (Wales) (Amendment) Regulations 2009. Exception categories for junior classes are not set out in regulations but are enforced as part of the data collection.
Includes only those classes where there are pupils who have been admitted as exceptions making the class size within the legal limit of 30 pupils or less.
of which:
Lawfully large classes with 'excepted' pupils (e)
Unlawfully large classes (f)
The Schools Standards and Framework Act 1998 and associated regulations placed a statutory duty on local authorities and governing bodies to limit the size of Reception classes to 30 from 1999; Reception and Year 1 classes from 2000 and Reception, Year 1 and Year 2 from 2001. Mixed year or mixed Key Stage classes are subject to the limit, where the majority of the class is made up of pupils in the appropriate year groups; this includes mixed nursery/reception classes. In this table, where a class has more than one teacher the number of pupils divided by the number of teachers determines if the size is over 30.
At January each year. At September each year prior to 2013. Class sizes prior to 2012 relate to Key Stage 1 whereas those after 2012 relate to Foundation Phase. Includes Middle schools from 2013.
Lawfully large classes with 'excepted' pupils (e)
Unlawfully large classes (f)
Number of pupils in large classes (g) Percentage of all pupils
Large Infant Classes (Classes of 31 or more pupils) (d)
Number of classes Percentage of all classes
of which: Number of classes Percentage of all classes
Number of pupils Percentage of all pupils Average class size
All classes All pupils
Classes with 1 to 30 pupils (c)
Table 18: Junior class sizes in primary and middle schools (a)
2009 2010 2011 2012 (b) 2013
24.8 24.7 24.9 .. 24.5
5,121 5,038 4,994 .. 5,208
126,786 124,533 124,491 .. 127,560
4,949 4,802 4,737 .. 4,900
96.6 95.3 94.9 .. 94.1
121,333 117,059 116,316 .. 117,790
95.7 94.0 93.4 .. 92.3
172 236 257 .. 308
3.4 4.7 5.1 .. 5.9
Number of classes 113 135 153 .. 255
Percentage of all classes 2.2 2.7 3.1 .. 4.9
Number of classes 59 101 104 .. 53
Percentage of all classes 1.2 2.0 2.1 .. 1.0
5,453 7,474 8,175 .. 9,770
4.3 6.0 6.6 .. 7.7
Number of pupils 3,565 4,257 4,845 .. 8,082
Percentage of all pupils 2.8 3.4 3.9 .. 6.3
Number of pupils 1,888 3,217 3,330 .. 1,688
Percentage of all pupils 1.5 2.6 2.7 .. 1.3
(a) At January each year. At September each year prior to 2013. Includes Middle schools from 2013. (b) No data collection in September 2012.
(c)
(d)
(e) Classes of 31 or more, excluding those large classes engaged in an excepted activity. (f) Includes all pupils in large classes, including those with excepted activity.
Includes only those classes where there are pupils who have been admitted as exceptions making the class size within the legal limit of 30 pupils or less.
of which:
Large classes with 'excepted' pupils (d)
Large classes without 'excepted' pupils (e)
Both infant and junior classes with one teacher are allowed to have more than 30 children in very specific circumstances. These are called exceptions. Exception categories for infant classes are defined in the Schedule to the Education (Infant Class Sizes) (Wales) Regulations 1998, as amended by the Education (Infant Class Sizes) (Wales) (Amendment) Regulations 2009. Exception categories for junior classes are not set out in regulations but are enforced as part of the data collection. In this table, where a class has more than one teacher the number of pupils divided by the number of teachers determines if the size is over 30.
Large classes with 'excepted' pupils (d)
Large classes without 'excepted' pupils (e)
Number of pupils in large classes (f) Percentage of all pupils
Large Junior Classes (Classes of 31 or more pupils) (c)
Number of classes Percentage of all classes
of which: Number of classes Percentage of all classes
Number of pupils Percentage of all pupils Average class size
All classes All pupils
Classes with 1 to 30 pupils
Key Quality Information
Coverage
The data in this release relates to all maintained and independent schools in Wales.
Status
Schools’ data are derived from the Pupil Level Annual School Census (PLASC) returns and STATS 1
returns supplied by schools open on Census day in January each year. The returns are authorised by
headteachers and validated by Local Authorities.
Timeliness
The data in this release relate to the position on Tuesday 15 January 2013.
Source of data
Pupil Level Annual School Census (PLASC) / School Census (STATS1 Return)
PLASC is an electronic collection of pupil and school level data provided by all maintained schools in
January each year. Schools record data on pupils and the school throughout the year in their Management
Information System (MIS) software. This data is collated into an electronic PLASC return and submitted to
the Welsh Government through DEWi, a secure online data transfer system developed by the Welsh
Government. Various stages of automated validation and sense-checking are built into the process to
ensure a high quality of data to inform policy making and funding.
From January 1994 independent schools in Wales complete a STATS1 return which replaced Form 101A
(school census return for independent schools prior to January 1994).
Class Size Data
: The January 2013 PLASC count was the first time class size data had been collected from
schools, replacing the annual local authority collection in September. Care should be taken when
comparing data from these two collections. The following are points to bear in mind when comparing the
most recent data with earlier years.
•
Pupils are leaving and joining part way through the academic year
•
Data is now collected through the management information system of a school rather than a
spreadsheet completed by a local authority
•
Any intake in January may affect class sizes
•
This is the first year class size data has been collected through PLASC, and data quality may
improve in future years as schools better understand the process.
The final September primary class size data can be found here:
Class Sizes in Primary Schools, September 2011
Definitions
Full-time equivalent (FTE):
•
FTE pupil numbers count part-time pupils as 0.5.
•
FTE of part-time teachers expresses the teachers’ service in hours as a proportion of a school week:
32.5 hours for maintained schools and 26 hours for independent schools.
Pupil Teacher Ratio (PTR):
calculated by dividing the FTE number of pupils by the FTE number of
qualified teachers (head teachers, acting head teachers, assistant head teachers, deputy heads and other
qualified teachers).
21
the guarantee element of State Pension Credit. They are also eligible if their parents are in receipt of Income
Related Employment and Support Allowance (IR). Employment and Support Allowance is an integrated
contributory and income related allowance and replaced, for new claimants, Incapacity and Income
Support, where it is paid on the grounds of incapacity and sickness. Children who receive Income Support
or Income Based Jobseeker’s Allowance in their own right are also eligible to receive free school meals.
Children whose families are in receipt of Child Tax Credit, providing they are not entitled to Working Tax
Credit, and have an annual income, as assessed by HM Revenue & Customs that does not exceed £16,190
are also eligible for free school meals.
Special educational needs
:
for further information please see these guidance notes.
Ethnic background
:
please see these guidance notes for further information on categories and data
collection methods.
Welsh medium schools: for further information please see these guidance notes.
Rounding:
In tables where figures have been rounded to the nearest final digit there may be an apparent
discrepancy between the sum of the constituent items and the total as shown.
Symbols:
The following symbols have been used throughout the publication:
.. not
available
. not
applicable
- the data item is not exactly zero but less than 0.05
Comparability: Other countries’ releases
Attached is the latest available release for England, published on 20 June 2013:
Schools, Pupils and their Characteristics, January 2013
Scotland publishes some data on pupils as part of a larger publication on schools. Their latest release was
published on 11 December 2012:
Summary Statistics for Schools in Scotland, No. 3 2012 Edition
Scotland also publishes some data on school meals as part of a different publication. Their latest release was
published on 25 June 2012:
Summary statistics for attainment, leaver destinations and healthy living, No. 2: 2012 Edition
The latest available release for Northern Ireland, published on 13 May 2013, can be found here:
Enrolments at schools and in funded pre-school education in Northern Ireland 2012/13 (Revised)
Related data for Wales
This release shows final data at Wales level for 2009 - 2013.
The previous census data published were for 2012, in the form of a Statistical First Release:
Schools Census Results, 2012, published on 11 July 2012.
The Welsh Government also releases teacher data
from a different source
(the STATS 3 return) in the form
of a Statistical First Release:
Teachers in service, vacancies and sickness absence: January 2013, published on 20 June 2013.
Since the above release is from a different source, figures may not match, and therefore caution should be taken when
making comparisons.
Who are the key users of this data?
These statistics are used both within and outside the Welsh Government. Some of the key users are:
•
Ministers and the Members Research Service in the National Assembly for Wales;
•
The Department for Education and Skills in the Welsh Government;
•
Other areas of the Welsh Government;
•
The research community;
•
Students, academics and universities;
•
Individual citizens and private companies.
What are the data used for?
These statistics are used in a variety of ways. Some examples of these are:
•
resource allocation in the Welsh Local Government Finance Settlement and the Better Schools Fund;
•
advice to Ministers;
•
the all-Wales education core data packs (the replacement for the National Pupil Database);
•
local authority and school comparisons and benchmarks;
•
to inform the education policy decision-making process in Wales including school reorganisation;
•
to inform ESTYN during school inspections;
•
the education domain of the Welsh Index of Multiple Deprivation;
•
as a basis for School Banding;
•
to assist in research in educational attainment.