JOURNAL OFVIROLOGY, June 2005, p. 7570–7596 Vol. 79, No. 12 0022-538X/05/$08.00⫹0 doi:10.1128/JVI.79.12.7570–7596.2005
Copyright © 2005, American Society for Microbiology. All Rights Reserved.
Predicting Coding Potential from Genome Sequence: Application to
Betaherpesviruses Infecting Rats and Mice†
Luciano Brocchieri,
1* Thomas N. Kledal,
2‡ Samuel Karlin,
1and Edward S. Mocarski
2*
Department of Mathematics1and Department of Microbiology & Immunology,2
Stanford University, Stanford, California 94305
Received 9 December 2004/Accepted 25 February 2005
Prediction of protein-coding regions and other features of primary DNA sequence have greatly contributed to experimental biology. Significant challenges remain in genome annotation methods, including the identifi-cation of small or overlapping genes and the assessment of mRNA splicing or unconventional translation signals in expression. We have employed a combined analysis of compositional biases and conservation to-gether with frame-specific GⴙC representation to reevaluate and annotate the genome sequences of mouse and rat cytomegaloviruses. Our analysis predicts that there are at least 34 protein-coding regions in these genomes that were not apparent in earlier annotation efforts. These include 17 single-exon genes, three new exons of previously identified genes, a newly identified four-exon gene for a lectin-like protein (in rat cytomegalovirus), and 10 probable frameshift extensions of previously annotated genes. This expanded set of candidate genes provides an additional basis for investigation in cytomegalovirus biology and pathogenesis.
Sequence analysis has been crucial to understanding the biology of cytomegalovirus (CMV) as well as other herpesvi-ruses (13, 30). Human CMV is an important pathogen, causing neurological damage following congenital infection (37) as well as opportunistic infections in immunocompromised indi-viduals. Models of human CMV pathogenesis and immune control have employed related betaherpesviruses that naturally infect guinea pigs (42), rats (8), and mice (21, 25). The initial annotation of a laboratory-propagated human CMV strain, AD169 (10), predicted 194 unique open reading frames (ORFs). Following this report, reevaluation of genome organization has occurred through correction of errors in the AD169 strain sequence (12, 31, 35, 43), recognition of mRNA splicing events (15, 39), and empirical identification of genes that had escaped annotation (3, 24, 26). The human CMV sequence has been updated through analyses of additional strains (9, 16, 17, 33) as well as by comparison to rhesus CMV (20) and chimpanzee CMV (14) genome sequences. Several revisions of the full genome complement of natural CMV have resulted from these studies. The number of genes in human CMV was estimated to range from under 150 to over 200 genes, and the current esti-mate of 165 genes is considered reasonable (16). Different estimates depend on the information considered, including ho-mology with other genes in available databases, codon bias, preservation of known protein motifs, and the presence of transcription signals (13, 32).
The annotated human CMV (HCMV) genome sequence
has formed a basis for comparisons to other betaherpesviruses. Murine CMV (MCMV) (40) and rat CMV (RCMV) (45) re-tain obvious sequence homologs of about 80 HCMV ORFs, or roughly 50% of the annotated genes in these viruses. Non-CMV betaherpesviruses infecting humans, such as herpesvirus 6 (19) and herpesvirus 7 (36), as well as those infecting lower primates, such as herpesvirus tupaia (2), retain similar core sets of ORFs. Approximately 40 of these 80 betaherpesvirus-specific ORFs are shared with all mammalian and avian her-pesviruses (13) and are considered to be herpesvirus common. Despite obvious levels of divergence in the betaherpesviruses, common biological characteristics have emerged from studies of viruses infecting laboratory animals, and these have helped us to define immune control by the host and immune escape by the virus and to accumulate a myriad of additional basic infor-mation on replication, pathogenesis, and latency (25, 28–30, 41). Prediction of the protein-coding potential of genomes is by nature provisional. In particular, herpesviruses and other eu-karyotic viruses have been difficult to annotate accurately using conventional criteria, as evidenced by the recognition of addi-tional genes as well as the elimination of ORFs found to be spurious based on additional investigation. For example, evi-dence suggests that the commonly employed limitations of ORF length (ⱖ100 codons) and maximum ORF overlap (⬍60%) lead to the exclusion of known CMV gene products, such as the multiply spliced immunomodulatory function, viral interleukin 10 (24, 26), and the 73-amino-acid herpesvirus-conserved smallest capsid protein (18). Similarly, recent efforts to identify structural proteins in MCMV have also resulted in several revisions to genome annotation (23). In addition to the small sizes of ORFs, biologically relevant events that may con-found conventional annotation methods include posttranscrip-tional modification, mRNA splicing, alternate translation ini-tiation sites, and stop codon suppression. Finally, automated annotation procedures may also be confounded due to unrec-ognized errors in underlying sequencing. Current limitations of analysis might be overcome by new approaches that are less * Corresponding author. Mailing address for Luciano Brocchieri:
Department of Mathematics, Stanford University, Stanford, CA 94305-2125. Phone: (650) 723-2221. Fax: (650) 725-2040. E-mail: luciano @stanford.edu. Mailing address for Edward S. Mocarski: Department of Microbiology & Immunology, Fairchild Science Building, Stanford University School of Medicine, CA 94305-5124. Phone: (650) 723-6435. Fax: (650) 723-1606. E-mail: [email protected].
† Supplemental material for this article may be found at http://jvi .asm.org/.
‡ Present address: Clinical Research Unit #136, HS Hvidovre Hos-pital, 2650 Hvidovre, Denmark.
7570
on November 8, 2019 by guest
http://jvi.asm.org/
restrictive and provide an extended list of candidate genes for experimental verification.
In the present study, we investigated the protein-coding po-tential of the MCMV and RCMV genomes, taking into ac-count the conservation of ORFs and genome-specific sequence features. Analogously to the human and chimpanzee CMV genomes (14), MCMV and RCMV retain a remarkable level of evolutionary relatedness and similarity in both functional or-ganization and arrangement of genes (40, 45). Our analysis of genome-specific sequence features will focus on translational “frame analysis” (5), exploiting the differential G⫹C distribu-tion among codon base posidistribu-tions in genomes of high G⫹C content (see Materials and Methods and Fig. S1 in the sup-plemental material). To provide an objective means to evalu-ate the extent to which G⫹C content influences the transla-tional frames and to reveal a potential coding region in any sequence, we also defined a new measure of gene composi-tional bias and a related measure of coding potential. Our approach makes no assumptions about the minimum length of coding sequences, although we focused on ORFs ofⱖ20 co-dons, and does not impose restrictions on the degree of over-lap between putative protein-coding regions. This procedure represents a marked modification of standard methods and produces a substantial revision of the current annotations for the MCMV and RCMV genomes. Our analysis suggests that CMV genomes likely encode a greater number of overlapping genes than previously thought.
MATERIALS AND METHODS
The genome sequence of the MCMV Smith strain (GenBank accession num-ber U68299) and the genome sequence of the RCMV Maastricht strain (Gen-Bank accession number NC_002512) were compared, and sequence features
were analyzed using frame-specific profiles of G⫹C contents.
Homologies.Similarity between ORF products of MCMV and RCMV was evaluated by the significant segment pair alignment (SSPA) program, and re-gions of similarity were identified by the multiple alignment program ITER-ALIGN (7). The alignment of viral genomes employed ORF products with
lengths ofⱖ20 codons. The predicted products of all ORFs with lengths ofⱖ20
codons (60 nucleotides [nt]) were queried against a large nonredundant database of protein sequences using the BLASTP program (1).
Frame-specific GⴙC profiles (S-profiles).We characterized the G⫹C con-tents and distribution of genomic sequences of MCMV and RCMV by three
measures of frame-specific G⫹C content (5). The G⫹C content of the genome
was evaluated within a moving window of fixed length (201 nt or 102 nt) with respect to every third nucleotide of the genome. First, genome positions 1, 4, 7, and so on, up to the end of the genome sequence, were scanned, and then genome positions 2, 5, 8, and so on, were scanned, followed by genome positions
3, 6, 9, and so on (Fig. S1). With this procedure, variations in G⫹C contents
along the genome were represented by three profiles, each representing a frame, referred to as “S-profiles.” The relationships among S-profiles were used to
assess the presence of protein-coding genes in genome regions of high G⫹C
content (5), qualitatively by visual examination and quantitatively through the
definitions of a bias in a frame-specific G⫹C distribution (S-bias) and of a related
measure of coding potential (see below).
S-bias.For a potential coding region of G⫹C contentS, we defined a measure
of how the G⫹C contents at codon base positions 1, 2, and 3 (S1,S2, andS3)
compared to expectations (S-bias). ExpectationsSˆ1(S),Sˆ2(S), andSˆ3(S) ofS1,S2,
andS3for a potential coding sequence of G⫹C contentSwere defined by the
linear regressions ofS1,S2, andS3overS, measured in a set of 2,813 published
herpesvirus genes (Fig. 1B to D).S1,S2, andS3values were normalized to these
expectations by the differences: S1
* ⫽
S1 ⫺ Sˆ1共S兲, S2 * ⫽
S2 ⫺ Sˆ2共S兲,
andS3* ⫽S3 ⫺Sˆ3共S兲. The obvious relationS1⫹S2⫹S3⫽3Sholds for each
gene. Since alsoSˆ1(S)⫹Sˆ2(S)⫹Sˆ3(S)⫽3S, the normalized G⫹C content
values project onto the planeS1*⫹ S2* ⫹S3* ⫽0, which can be represented in
the two orthogonal dimensionsT1 ⫽ S3
* ⫺ S2
*
and T2⫽K(1/2S3
*⫹ 1/2S2 *⫺ S1 * ).
The scaling factorKwas specified so that Var(T1) was equal to Var(T2) for the
set of 2,813 published herpesvirus genes (see Results). The S-bias of a putative
coding region of G⫹C contentsS,S1,S2, andS3was defined as the magnitude
of the corresponding vector (T1,T2): S-bias(S1,S2,S3兩S)⫽(T12⫹T22)1/2. With
this definition, a sequence with a distribution of G⫹C nucleotides among codon
base positions corresponding to expectations will have an S-bias of 0.0,
indepen-dently of its overall G⫹C content. As the S-bias increases, the likelihood of an
ORF to code for a protein decreases.
Biases in codon and amino acid usage.Biases in codon usage were calculated
as described in reference 22. Let g(x,y,z) be the frequency of the codon
composed of bases (x,y,z) in gene groupG(Gcould be a single gene),
normal-ized for each amino acid codon family such that
冘
共x,y,z兲 ⫽a
g共x,y,z兲⫽1
where the sum extends over all codons translated to amino acida. Letf(x,y,z)
be the codon frequencies for a gene groupFnormalized to 1 in each amino acid
codon family. The codon usage bias (C-bias) of gene groupGrelative toFwas
calculated by the formula (22)
C-bias共G兩F兲⫽
冘
a
pa共G兲
冋
冘
共x,y,z兲 ⫽a冏
g共x,y,z兲⫺f共x,y,z兲
冏
册
where [pa(G)] is the amino acid frequencies of gene groupG. For each genome,
two reference groups of genesFwere chosen to calculate C-biases, one
corre-sponding to all annotated genes inside the regions of high G⫹C content of the
respective genome and a second group including all other annotated genes (see Results for a definition of these regions in the MCMV and RCMV genomes).
The amino acid bias (aa-bias) of gene groupGrelative to gene groupFwas
defined as
aa-bias共G兩F兲⫽
冘
a
兩pa共G兲⫺pa共F兲兩
wherepa(G) andpa(F) are the frequencies of the amino acidainGand inF,
respectively, and the sum extends over all amino acids.
Coding potentials.Local coding potentials were evaluated from nucleotide composition as follows. For each of the six coding frames (three on the direct strand and three on the complementary strand), an S-bias was evaluated within a window of 102 nt. The probability distribution of S-biases in coding regions was determined from similar windows extracted from all annotated coding regions of 28 herpesvirus genomes. Corresponding probabilities were obtained for random
distributions ofS1,S2, andS3given G⫹C contentS. In the case of random
distributions,S1,S2, andS3values have the same expectation (S) and same
distribution. The S-bias for random distribution (S-biasrand) was
calcu-lated by normalizingS1,S2, andS3values as follows:S1
* ⫽
S1 ⫺S,S2 *⫽
S2⫺
S, andS3* ⫽ S3 ⫺ Sand biases were directly calculated with the equation
S-biasrand⫽(S1
*2⫹
S2
*2⫹
S3
*2
)1/2. The conditional probability (coding potential)
[P(CODi¦F)] of a sequence,F, to be coding in frameiwas evaluated as follows:
P共CODi兩F兲⫽ P关S⫺biasi共F兲兴 P关S⫺biasrand共F兲兴⫹
冘
j⫽1 6
P关S⫺biasj共F兲兴
whereP[(S⫺biasi(F)] is the frequency of S⫺biases greater than or equal to
S⫺biasi(F) among all windows extracted from herpesvirus annotated coding
regions andP[S⫺biasrand(F)] is the frequency compared to the random
distri-bution obtained for sequences of the same G⫹C content.
GeneMark coding potentials (6) were also evaluated based on predictions obtained with the program GeneMarkS (4) as implemented at the website http: //opal.biology.gatech.edu/GeneMark/genemarks.cgi.
RESULTS
GⴙC contents in coding regions of the MCMV and RCMV genomes.Analysis of genes and genomes of prokaryotic origin has shown that global G⫹C content correlates distinctively with the G⫹C content at the first (S1), second (S2), and third
(S3) codon positions (5, 34). As expected, similar relationships
extended to complete herpesvirus genomes (Fig. 1A) as well as to individual herpesvirus genes (Fig. 1B to D). Variations in global G⫹C content corresponded to large differences inS3,
on November 8, 2019 by guest
http://jvi.asm.org/
whereas smaller differences occurred inS1and, especially, in
S2. The relationship S3 ⬎⬎ S1 ⬎⬎ S2 is typical of the three
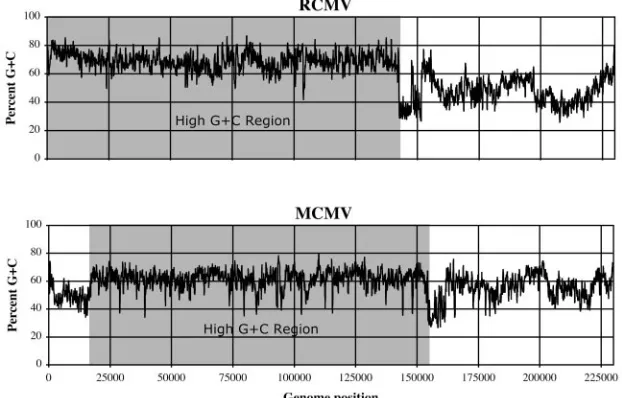
codon positions of expressed genes in G⫹C-rich genomes. The high overall G⫹C contents of the MCMV and RCMV genomes (58.7% and 61.0%, respectively) and the correspond-ing high contrasts in G⫹C usage at different codon positions (Fig. 1A) were expected to provide a means to reliably identify protein-coding regions. However, C and G bases were not evenly distributed across the two genomes (Fig. 2). In both MCMV and RCMV, the G⫹C contents were greatest (61.7% and 69.2%, respectively) in the large genomic segment con-taining the betaherpesvirus-conserved protein-coding regions. G⫹C contents were more varied and generally lower (54.3% and 47.7%, respectively) in the remaining genomic segments. These differences in G⫹C contents resulted in varied contrasts of G⫹C usage at each codon position for genes expressed in different genomic regions.
Compositional analysis of ORFs of >20 codons from the
MCMV and RCMV genomes.We identified a total of 5,541 MCMV and 4,741 RCMV ORFs with lengths ofⱖ20 codons (defined without regard to AUG codons, from stop codon to stop codon). All ORFs were analyzed in terms of S-bias, C-bias, and aa-bias (see Materials and Methods). The composi-tional biases of ORFs corresponding to previously annotated coding sequences were determined over the previously re-ported length (40, 45), and newly annotated ORFs were eval-uated over the entire stop codon-to-stop codon distance as well as beginning at AUG codons when these were at least 60 nt upstream of a stop codon.
S-biases.We devised a scoring system to quantify biases in G⫹C contents at codon positions across a putative coding region (see Materials and Methods). The expected G⫹C con-tents at codon positions 1, 2, and 3 were determined from the regression lines over 2,813 annotated ORFs from 28 herpesvi-FIG. 1. Percent G⫹C contents in the first, second, and third codon positions of genes across herpesvirus species in relation to genome and gene G⫹C content. (A) Average G⫹C contents at the first (red circles), second (green circles), and third (blue circles) codon base positions in coding regions from 28 herpesvirus genomes in relation to the genome G⫹C content. The point corresponding to all coding regions from MCMV is labeled M, whereas M1 and M2 correspond to genes from the region of high G⫹C content of MCMV and from the remaining part of the genome, respectively (Fig. 2). Similarly, R, R1, and R2 indicate coding regions from the complete RCMV genome or from corresponding regions of high and low G⫹C contents (Fig. 2). Linear regressions through these points are shown as solid lines that are color coded to indicate the codon position. A similar set of regression analyses was carried out with 84 prokaryotic genomes for comparison, and results are shown as dashed lines (note that the dashed blue line almost precisely overlaps the solid blue line). (B-D) The G⫹C contents of 2,813 herpesvirus genes at the first (B), second (C), and third (D) codon base positions in relation to the overall G⫹C content of each gene. Genes annotated in the MCMV and RCMV genomes are shown in green and red, respectively.
7572 BROCCHIERI ET AL. J. VIROL.
on November 8, 2019 by guest
http://jvi.asm.org/
[image:3.585.137.449.68.428.2]rus genomes (Fig. 1B to D). Normalized G⫹C values were transformed into the coordinate systemT1andT2with a
scal-ing factor (K) equal to 1.804 (see Materials and Methods). The distribution of S-biases of all MCMV and RCMV ORFs of ⱖ20 codons is shown by the black lines in Fig. 3A and B, where we chose the starting position associated with the lowest bias for each newly annotated ORF. The distribution of all such ORFs with G⫹C contents of⬎50% (4,348 ORFs from MCMV and 3,095 ORFs from RCMV) is shown by the gray lines. The distribution of biases among previously annotated ORFs is also shown for comparison. A large proportion (46% in MCMV and 51% in RCMV) of all previously nonannotated ORFs had a low S-bias typical of coding regions (lower than the threshold corresponding to 95% of the annotated genes). Virtually all ORFs with high S-biases (⬎40) had high G⫹C contents (⬎50%), as expected from the great asymmetries in frame-specific G⫹C usage that distinguish G⫹C-rich coding from noncoding sequences. However, 34% of the ORFs with high G⫹C contents showed low S-biases. We also evaluated the biases in codon usage and amino acid usage for all ORFs (see Materials and Methods). We computed all biases relative to the average frequencies observed either among previously an-notated genes encoded in the region of high G⫹C content or among all other annotated genes of the respective genome. For each ORF we selected the smaller of the two biases. The distribution of C-biases and aa-biases among ORFs of MCMV and RCMV are shown in Fig. 3C to F. The C-biases and aa-biases of previously annotated ORFs were low compared to those of the ORF sets analyzed here, although, as for S-biases, a large number of these ORFs have C-biases (18% in MCMV and 32% in RCMV) and aa-biases (19% in MCMV and 33% in RCMV) within the 95th percentile range of the correspond-ing annotated genes.
[image:4.585.136.447.72.271.2]We identified 227 ORFs from MCMV and 350 ORFs from RCMV (supplemental Tables S1 and S2) that had not been previously annotated but were characterized by compositional biases typical of annotated genes (within the 95% confidence
FIG. 2. Sequence G⫹C contents in the MCMV and RCMV genomes measured within moving windows with a size of 201 nt. The regions of high G⫹C contents conserved between the MCMV and RCMV genomes are shaded gray.
FIG. 3. Distribution of compositional biases of ORFs ofⱖ20 co-dons from the MCMV and RCMV genomes. The distributions among all ORFs are shown as black lines, and the distributions among ORFs ofⱖ20 codons and with G⫹C contents of⬎50% are shown as gray lines. The distributions among published genes are shaded black. See the text for definitions of S-bias, C-bias, and aa-bias.
on November 8, 2019 by guest
http://jvi.asm.org/
[image:4.585.303.542.321.667.2]interval). For each of these ORFs, all starting positions asso-ciated with low biases are listed in supplemental Tables S1 and S2. The average length of these ORFs was 108 codons in RCMV and 129 codons in MCMV. Most of the ORFs from MCMV (91.6%) and the majority of those from RCMV (72.3%) were characterized by a high G⫹C content (⬎50%), with averages of 59.6% in MCMV and 58.0% in RCMV. By compositional criteria alone, these ORFs were considered po-tentially expressed.
Conservation between MCMV and RCMV genomes. We searched for similarities between proteins potentially encoded by ORFs with lengths ofⱖ20 codons from MCMV and RCMV using the computer protocol SSPA (7). Pairwise comparisons between 5,541 MCMV and 4,734 RCMV ORFs resulted in 73,330 pairs (0.28%) that exhibited statistically significant similarity. As expected, extended similarities (ⱖ50% SSPA similarity) were distributed along the two viral genomes in a collinear fashion. We then applied the ITERALIGN multiple sequence alignment program (7) to identify all ungapped blocks of aligned positions with lengths of ⬎10 codons. To select the most-reliable regions of homology among all blocks, we constructed a pairwise alignment of the MCMV and RCMV genomes, starting from the longest blocks and progres-sively adding shorter blocks. Blocks that were not collinear with the partial alignment obtained from the longer blocks were excluded. The resulting genome alignment, shown in Fig. 4, involved 107,739 positions, covering about 47% of each ge-nome sequence. Of these, 94,261 (87.5%) coincided with align-ments between amino acids of annotated proteins and were plotted in black. A remarkable 13,478 positions (12.5%), plot-ted in red, corresponded to alignments between ORF pairs
in-volving at least one ORF not appearing in the original genome annotations.
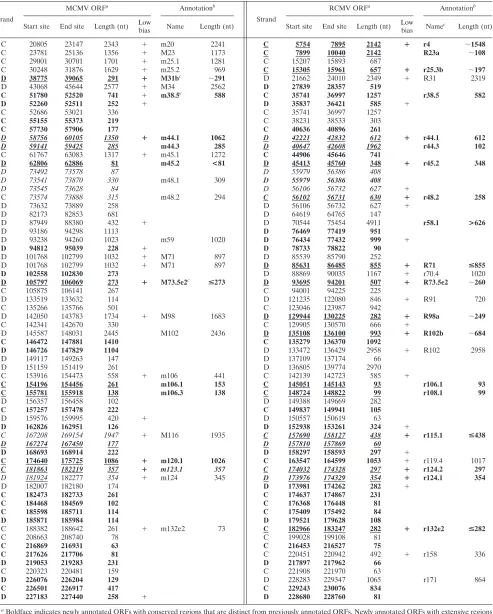
We found 66 ORF pairs corresponding to conserved regions involving nonannotated ORFs (Table 1), comprising 49 ORFs from MCMV and 56 ORFs from RCMV. ORFs whose align-ment regions were not closely interspersed within regions oth-erwise conserved between annotated genes are shown in Table 1 in boldface. The conservation of 10 MCMV ORFs and 18 RCMV ORFs (Table 1) strongly suggested that they were expressed genes (see alignments in the supplemental material). Among these, two ORFs from MCMV showed similarities to annotated genes of RCMV. One of them (newly annotated as m120.1) was similar to RCMV r119.4 and included a putative start codon (AUG) at position 175665. Based on position and conservation, a second ORF similar to RCMV R31 and anno-tated as M31b appeared to be a likely 3⬘frameshift extension of M31, as recently reported (23). ORF M73.5e2 was not published in the initial report of the MCMV genome sequence but was subsequently described as exon 2 of M73.5 in MCMV TS9 (42a) (GenBank entry L34342). Seven additional ORFs from MCMV (m38.5, m44.1, m44.3, m45.2, m106.1, m106.3, and m123.1) showed similarities to corresponding newly anno-tated ORFs from RCMV.
[image:5.585.49.279.70.296.2]In RCMV we found 11 newly annotated ORFs (r4, R23a, r25.3b, r48.2, R71, R73.5e2, R98a, R102b, r115.1, r124.1, and r132e2) with similarity to published genes of MCMV. Four of these were interpreted, for their relative positions, as likely to derive from frameshifts (likely resulting from sequencing er-rors) within the sequence of neighboring annotated genes. In particular, we found a 5⬘extension of R23 (R23a), a 3⬘ exten-sion of r25.3 (r25.3b), a 5⬘extension of R98 (R98a), and a 3⬘ extension of R102 (R102b). The similarity of ORF r4 to MCMV m20 suggested a substantial 5⬘extension of this ORF compared to the current annotation (see the supplemental material). Surprisingly, no AUG codon was found in the ex-tended region of r4. Similarly, the strong conservation between r70.1 and MCMV M71 suggested that the coding region of r70.1 may be extended to a region 5⬘of the current annotation, which also lacked any AUG codons, and that this gene should be named R71 to emphasize its homology to the gene already published in MCMV. The lack of AUG codons in the extended regions of these ORFs suggests an alternative translation start mechanism, a multiexon gene structure, or the possibility of sequencing errors. We identified a homolog of MCMV M73.5e2 in RCMV that we designated R73.5e2. The short ORF r115.1 showed strong similarity to the C-terminal region of M116 from MCMV, which did not show significant similar-ity to R116. The newly annotated ORF r132e2 of RCMV was recognized as the second exon of annotated gene r133 for its high similarity to exon m132e2 in MCMV (see the supplemen-tal material). This result suggests that r133 (homologous to m133e1) should be renamed r133e1. Seven newly annotated ORFs from RCMV (r38.5, r44.1, r44.3, r45.2, r106.1, r108.1, and r124.2) showed similarities to corresponding newly anno-tated ORFs from MCMV. Groups of conserved ORFs over-lapping in the respective genomes are italicized in Table 1. Additional sequence features would be needed to distinguish the frame(s) of the coding sequence(s) among these ORFs (see the supplemental material for the cases, e.g., of m48.1 and m48.2).
FIG. 4. Homologous protein-coding positions of the MCMV and RCMV genomes as derived from significant similarities determined by SSPA (7) analysis of all potential protein products of ORFs at least 20 codons long. Red bars highlight segments corresponding to the 13,478 conserved positions that were not previously recognized in published genome annotations. K, thousand. Numbers on thexandyaxes indi-cate positions.
7574 BROCCHIERI ET AL. J. VIROL.
on November 8, 2019 by guest
http://jvi.asm.org/
TABLE 1. Newly identified ORF pairs conserved between MCMV and RCMV
Strand
MCMV ORFa Annotationb
Strand
RCMV ORFa Annotationb
Start site End site Length (nt) Low
bias Name Length (nt) Start site End site Length (nt)
Low
bias Name
c
Length (nt)
C 20805 23147 2343 ⫹ m20 2241 C 5754 7895 2142 ⴙ r4 ⬃1548
C 23781 25136 1356 ⫹ M23 1173 C 7899 10040 2142 R23a ⬃108
C 29001 30701 1701 ⫹ m25.1 1281 C 15207 15893 687
C 30248 31876 1629 ⫹ m25.2 969 C 15305 15961 657 ⴙ r25.3b ⬃197
D 38775 39065 291 ⴙ M31bc ⬃
291 D 21662 24010 2349 ⫹ R31 2319
D 43068 45644 2577 ⫹ M34 2562 D 27839 28357 519
C 51780 52520 741 ⫹ m38.5c
588 C 35741 36997 1257 r38.5 582
D 52260 52511 252 ⫹ D 35837 36421 585 ⫹
C 52686 53021 336 C 35741 36997 1257
C 55155 55373 219 C 38231 38533 303
C 57730 57906 177 C 40636 40896 261
D 58756 60105 1350 ⴙ m44.1 1062 D 42221 42832 612 ⴙ r44.1 612
D 59141 59425 285 m44.3 285 D 40647 42608 1962 r44.3 102
C 61767 63083 1317 ⫹ m45.1 1272 C 44906 45646 741
D 62806 62886 81 m45.2 <81 D 45413 45760 348 ⴙ r45.2 348
D 73492 73578 87 D 55979 56386 408
D 73541 73870 330 m48.1 309 D 55979 56386 408
D 73545 73628 84 D 56106 56732 627 ⫹
C 73574 73888 315 m48.2 294 C 56102 56731 630 ⴙ r48.2 258
D 73632 73889 258 D 56106 56732 627 ⫹
D 82173 82853 681 D 64619 64765 147
D 87949 88380 432 ⫹ D 70544 75454 4911 r58.1 >626
D 93186 94298 1113 D 76469 77419 951
D 93238 94260 1023 m59 1020 D 76434 77432 999 ⫹
D 94812 95039 228 ⫹ D 78733 78822 90
D 101768 102799 1032 ⫹ M71 897 D 85539 85790 252
D 101768 102799 1032 ⫹ M71 897 D 85631 86485 855 ⴙ R71 <855
D 102558 102830 273 D 88869 90035 1167 ⫹ r70.4 1020
D 105797 106069 273 ⴙ M73.5e2c <
273 D 93695 94201 507 ⴙ R73.5e2 ⬃260
C 105875 106141 267 C 94001 94225 225
D 133519 133632 114 D 121235 122080 846 ⫹ R91 720
C 135266 135766 501 C 123046 123987 942
D 142050 143783 1734 ⫹ M98 1683 D 129944 130225 282 ⴙ R98a ⬃249
C 142341 142670 330 C 129905 130570 666 ⫹
D 145587 148031 2445 M102 2436 D 135108 136100 993 ⴙ R102b ⬃684
C 146472 147881 1410 C 135279 136370 1092
D 146726 147829 1104 D 133472 136429 2958 ⫹ R102 2958
D 149117 149263 147 D 137109 137174 66
D 151159 151419 261 D 136805 139774 2970
C 153916 154473 558 ⫹ m106 441 C 142139 142723 585 ⫹
C 154196 154456 261 m106.1 153 C 145051 145143 93 r106.1 93
C 155781 155918 138 m106.3 138 C 148724 148822 99 r108.1 99
D 156357 156458 102 D 149388 149669 282
C 157257 157478 222 C 149837 149941 105
D 159576 159995 420 ⫹ D 150557 150619 63
D 162826 162951 126 D 152938 153261 324 ⫹
C 167208 169154 1947 ⫹ M116 1935 C 157690 158127 438 ⴙ r115.1 <438
D 167274 167450 177 D 157810 157869 60
D 168693 168914 222 D 158297 158593 297 ⫹
C 174640 175725 1086 ⴙ m120.1 1026 C 163547 164599 1053 ⫹ r119.4 1017
C 181863 182219 357 ⴙ m123.1 357 C 174032 174328 297 ⴙ r124.2 297
D 181924 182277 354 ⫹ m124 345 D 173976 174329 354 ⴙ r124.1 354
D 182007 182180 174 D 173981 174262 282 ⫹
C 182473 182733 261 C 174637 174867 231
C 184468 184569 102 C 176368 176448 81
C 185598 185711 114 C 175409 175492 84
D 185871 185984 114 D 179521 179628 108
C 188382 188642 261 ⫹ m132e2 73 C 182966 183247 282 ⴙ r132e2 <282
C 208663 208740 78 C 199028 199108 81
C 216869 216931 63 C 216453 216527 75
C 217626 217706 81 C 220451 220942 492 ⫹ r158 336
D 219053 219283 231 D 217897 217962 66
C 220323 220481 159 C 221908 221970 63
D 226076 226204 129 D 228283 229347 1065 r171 864
C 226501 226917 417 C 229243 230076 834
D 227183 227440 258 ⫹ D 228680 228760 81
a
Boldface indicates newly annotated ORFs with conserved regions that are distinct from previously annotated ORFs. Newly annotated ORFs with extensive regions of similarity are underlined. Groups of overlapping conserved ORFs are in italics. ORF positions and lengths are from stop codon to stop codon.
b
Lightface ORF names are from previously annotated genes. Boldface names indicate new or modified ORFs. Lengths of ORFs are as published previously (lightface) or are estimated for newly annotated ORFs (boldfaced) based on the position of the first Met codon and from S-profile information (see Fig. 6 and 7). Asterisks indicate ORFs included in Table 2 or 3.
c
Experimentally verified (23, 27, 42a).
on November 8, 2019 by guest
http://jvi.asm.org/
BLASTP analyses.We queried the products of all ORFs with lengths ofⱖ20 codons against the NCBI nonredundant database of 644,068 proteins from coding sequence transla-tions of sequences in GenBank, the Protein Data Bank, Swiss-Prot, and PIR using BLASTP (1). Significant results (E-value, ⬍0.001) from this analysis for ORFs in the MCMV and RCMV genomes not previously annotated are reported in supplemental Tables S3 and S4, respectively. Eleven of these matches (see the footnotes of Tables S3 and S4) involved sequences of low complexity and are likely spurious. Other matches confirmed ORFs M31b, M73.5e2, m120.1, r48.2, R73.5e2, and R102b, newly annotated based on SSPA analysis.
BLASTP analysis identified four additional candidate genes in the MCMV genome, one with similarity to a region of RCMV r5, one overlapping M57 and similar to the
single-stranded DNA-binding protein of primate CMVs, one similar to a hypothetical protein of the rhesus macaque CMV, and one similar to RCMV r95.1. In RCMV, 16 ORFs showed interest-ing BLASTP matches (boldfaced in supplemental Table S4). Three ORFs showed respective similarities to the arabinoga- lactanproteinofmaize,totheregulatoryproteinE2fromhumanpap-illomavirus, and to BHLF1 from EBV. ORF r169.1 (overlap-ping r169) showed extensive similarity to ORF r171, located immediately downstream in the RCMV genome (see the sup-plemental material). A notable feature in the RCMV genome evidenced by the BLASTP analysis was the existence of mul-tiple similarities between ORFs overlapping in different frames the published genes r121.1, r121.2, and r125. These similarities corresponded to multiple exact repetitions of long DNA ele-ments (supplemental Tables S5 and S6) duplicated in different frames within the same overlapping ORF. The lack of relat-FIG. 5. Alignment of a lectin-like glycoprotein identified in RCMV English (46) with ORFs from RCMV Maastricht (45). ORFs from RCMV Maastricht are translated and numbered from stop codon to stop codon. Aligned positions are represented in capital letters. Nonaligned positions are represented in lowercase letters. The alignment suggests that in RCMV Maastricht, this protein is encoded by four exons (indicated in red) within ORF C217640.0.217816 (exon 1, C217651–217783), ORF C217366–217680 (exon 2, C217402–217580), ORF C217214–217411 (exon 3, C217221–217327), and ORF C217004–217162 (exon 4, C217004–217142). The N-terminal conservation of a similar highly hydrophobic region within the ORFs including exons 1 and 3 suggests possible alternative splicing.
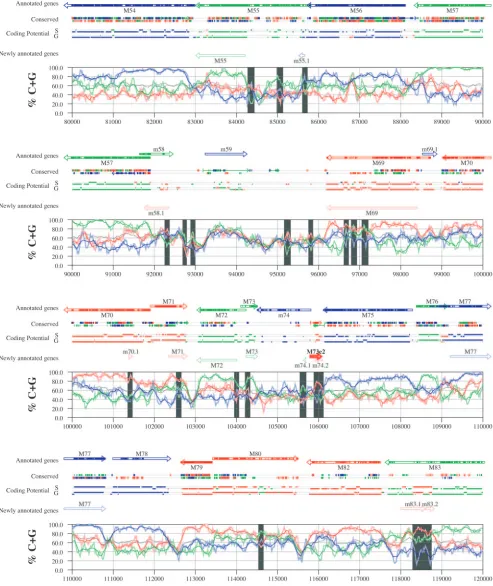
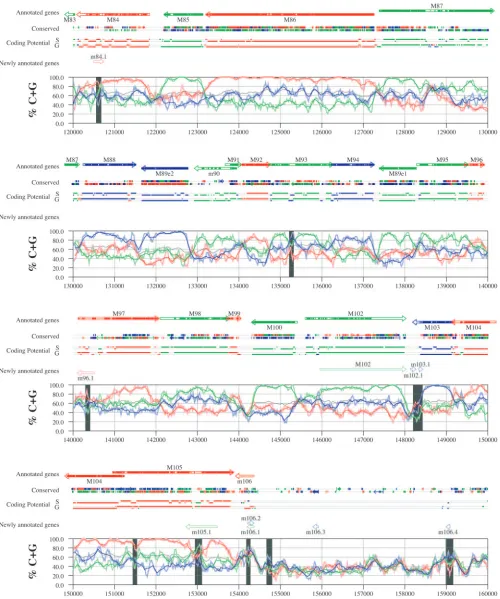
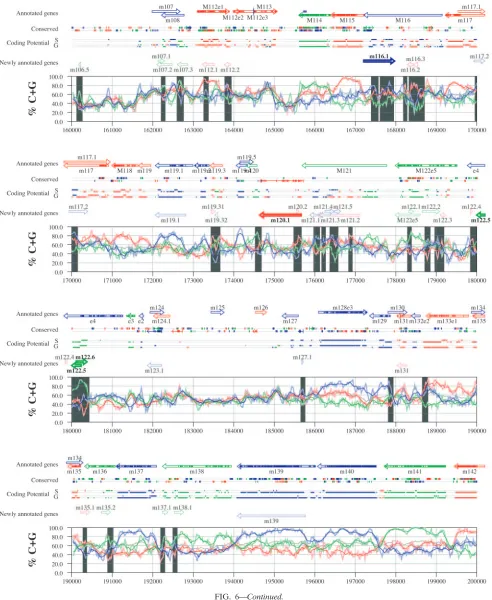
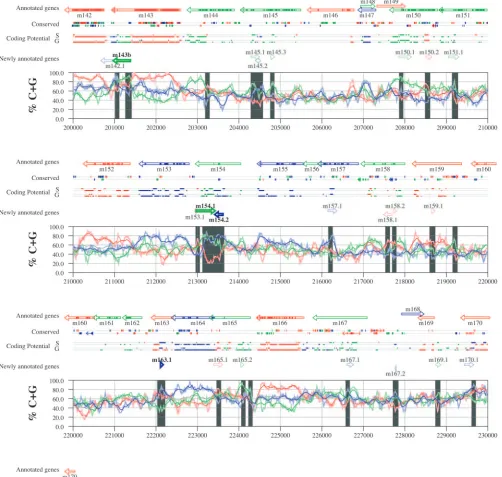
FIG. 6. Frame-specific G⫹C profiles (S-profiles [5]) along the MCMV genome (horizontal axis) are represented by red, green, and blue curves within windows with a size of 201 nt (intense red, green, and blue curves, respectively) and with a size of 102 nt (light red, light green, and light blue curves). The overall G⫹C contents, measured within windows with a size of 201 nt, are represented by the black curve. All positions in the MCMV and RCMV genomes showing significant (Pⱕ0.01) S-profile contrasts that are not consistent with previously annotated genes are identified by shaded areas across the S-profile plot. All ORFs are represented as arrows pointing from the 5⬘to the 3⬘end and are colored according to the frame of the third position of their codons. ORFs previously annotated in published literature (40) are plotted as “annotated genes,” with filled regions denoting conservation between MCMV and RCMV. “Conserved” indicates other regions conserved between the MCMV and RCMV genomes, evaluated by comparing similarities of all ORFs ofⱖ20 codons (see Materials and Methods and Results) from the direct strand of the genome (upper line) or from the complementary strand (lower line) and colored according to the frame of the third codon position. All conserved nonannotated ORFs with ungapped blocks of similarity longer than 10 aa that are consistent with the collinear arrangement of the two genomes (shown in Table 1) and ORFs with significant BLASTP (1) hits (from Table S3) are indicated by thin arrows. “Coding potential” indicates genome positions with a coding potential of⬎0.5, evaluated by S-biases (S) or by the GeneMark procedure (G) (6). The frames of the regions of high coding potential are color coded as for genes, and the genome strand is distinguished by representation on the upper (direct) or lower (complementary) lines. “Newly annotated genes” indicates coding regions newly predicted by our methods. Coding regions predicted with highest confidence are depicted with thick lines and shown in full color.
7576 BROCCHIERI ET AL. J. VIROL.
on November 8, 2019 by guest
http://jvi.asm.org/
[image:7.585.137.447.66.308.2]on November 8, 2019 by guest
http://jvi.asm.org/
FIG. 6—Continued.
7578 BROCCHIERI ET AL. J. VIROL.
on November 8, 2019 by guest
http://jvi.asm.org/
FIG. 6—Continued.
on November 8, 2019 by guest
http://jvi.asm.org/
FIG. 6—Continued.
7580 BROCCHIERI ET AL. J. VIROL.
on November 8, 2019 by guest
http://jvi.asm.org/
FIG. 6—Continued.
on November 8, 2019 by guest
http://jvi.asm.org/
FIG. 6—Continued.
7582 BROCCHIERI ET AL. J. VIROL.
on November 8, 2019 by guest
http://jvi.asm.org/
edness of these DNA structures to any coding frame suggests that these genome regions may not code for proteins at all.
Three ORFs of RCMV, newly named r153e2, r153e3, and r153e4, showed significant similarity to a lectin-like glycopro-tein first identified in the English isolate of RCMV (46), where the protein is encoded by five exons. Similarity analysis of this protein against our collection of peptides suggested that a homologous lectin-like protein is also encoded in the RCMV Maastricht genome, within the region including positions 217034 to 217816. By the alignment of the putative products of these ORFs to the protein identified in the English isolate (Fig. 5) and the identification of putative donor and acceptor sites in the RCMV genome, we suggest that this protein is encoded in RCMV Maastricht but employs four exons and has a total length of 186 aa.
S-profile analysis. Figures 6 and 7 display frame-specific profiles of G⫹C contents (see Materials and Methods) and regions of conservation of the MCMV and RCMV genomes. For frame-specific analysis (5), the frequencies of G⫹C were calculated with respect to every third position using windows of 102 nt or 201 nt. The G⫹C contents determined over positions in frame with nt 1, 2, or 3 of the complete genomes are rep-resented by the red, green, and blue curves (see Materials and Methods and the legend of Fig. 6). We refer to the shape and relationship of the three curves at various sequence positions as “S-profiles.” Published genes (40, 45) are represented in Fig. 6 and 7 as colored with reference to the frame of the third base of their codons (see the legend of Fig. 6). The color and orientation of each gene also identify the G⫹C curves corre-sponding to the first and second base positions of its codons. For example, the G⫹C contents of codon base positions 1, 2, and 3 for gene M100, colored in green and encoded on the complementary strand, are shown by the red, blue, and green curves, respectively. For gene M102, colored in green but en-coded on the direct strand, positions 1, 2, and 3 instead cor-respond to the blue, red, and green curves, respectively. Fig-ures 6 and 7 also show all conserved regions identified by SSPA analysis (7), all nonannotated ORFs highlighted by SSPA anal-ysis (from Table 1) or BLASP analanal-ysis (from supplemental Tables S3 and S4) (1), and the frames of all regions of high coding potential, determined by S-profile biases and by the GeneMark procedure (6). Finally, Fig. 6 and 7 show all poten-tial coding regions identified by our analysis of S-profiles and conservation among all ORFs withⱖ20 codons from the two genomes (see the legend of Fig. 6).
Previously annotated genes recognized by S-profile analysis. Within the region of high G⫹C contents of the MCMV ge-nome and of the RCMV gege-nome, there was a clear correspon-dence of S-profiles with most previously annotated ORFs (see also supplemental Tables S7 and S8). In this region, S-profile analysis recognized 74 of the 88 annotated ORFs from MCMV and 79 of the 92 annotated ORFs from RCMV. S-profiling was sensitive to G⫹C content such that in the MCMV regions of low G⫹C contents, only 50 of the 89 annotated ORFs were identified and in the low-G⫹C-content region of RCMV, 21 of the 75 annotated ORFs were recognized solely by this meth-od. Considering the G⫹C compositions of individual ORFs, S-profiles recognized 219 of the 291 annotated ORFs with a G⫹C content of⬎50%, compared to 5 of 53 ORFs with a G⫹C content of⬍50%. These results indicated that S-profile
analysis is a powerful approach to identifying coding sequences with G⫹C contents as low as 50%. Among the annotated genes of high G⫹C content (⬎50%) not identified by S-profiles, some were clearly contradicted by their S-profiles whereas oth-ers exhibited high G⫹C contents (often ⬎60%) in all three codon positions (see below).
To provide an objective means to identify regions in the MCMV and RCMV genomes where S-profiles would predict the presence of protein-coding sequences, we first identified all positions (centered in windows of 102 nt) where frame-specific G⫹C contents differed by more than 35% (corresponding to a random probability of ⱕ0.01). We then excluded all regions where these contrasts could be explained by the presence of previously annotated ORFs. The remaining regions of high frame-specific G⫹C contrasts, shown as shaded blocks in Fig. 6 and 7, suggest the existence of expressed genes.
Newly annotated ORFs. All ORFs whose expression was consistent with the observed high contrasts in S-profiles (⬎35%) were shown among the newly annotated ORFs in Fig. 6 and 7 and were listed in Table 2 (MCMV) and Table 3 (RCMV). In these tables we have indicated the genome positions of the annotated coding sequences, their G⫹C contents, and the newly assigned name for each ORF, and we have also indicated the published genes that overlapped each newly annotated ORF. For each ORF we have also identified the presence of a putative translation initiation codon, low compositional biases, conservation, and overlap to sequence regions of high coding potential measured by S-biases or measured by the GeneMark (6) procedure, as well as weak conservation or overlap only to short regions of high coding potential. The presence of an AUG codon did not apply when ORFs were interpreted as internal or last exons or as 3⬘ frameshift extensions of a se-quence in a different frame. Evidence from S-profiles was dis-tinguished as extending through the full length of the ORF or as partially covering the length of the ORF. We included 33 ORFs in Tables 2 and 3 that were identified by SSPA and/or BLASTP similarity and had been retained after scrutiny through S-profile analysis. ORFs that were most reliably pre-dicted as coding sequences (by the extension and strength of the S-profile signal and/or by strong conservation) are indi-cated. ORFs supported by conservation (through SSPA and/or BLASTP analysis) and by S-profiles are also indicated.
A total of 126 ORFs from the MCMV genome and 105 ORFs from the RCMV genome were newly annotated as a result of this analysis. In 101 of these ORFs, we could identify a putative start codon; 87 ORFs showed conservation through SSPA or BLASP analyses, and 77 ORFs were characterized by low compositional biases. We observed substantial concor-dance between regions of high coding potential identified by S-profiles or by the GeneMark procedure. In either viral ge-nome, 175 ORFs included regions of high coding potential based on S-biases and a majority (140 ORFs) were also sup-ported by the coding potential evaluated by GeneMark. A total of 61 ORFs coincided with the underlying contrasts in files, whereas 152 ORFs were characterized by partial S-pro-files.
S-profiles of ORFs identified by SSPA similarity.All anno-tated ORFs identified by SSPA similarity retained in Tables 2 and 3 are marked. Among the potential coding regions iden-tified by SSPA similarity analysis, 2 newly annotated ORFs
on November 8, 2019 by guest
http://jvi.asm.org/
FIG. 7. Genome and published annotation of RCMV Maastricht (45). Explanatory material can be found in the legend to Fig. 6.
7584 BROCCHIERI ET AL. J. VIROL.
on November 8, 2019 by guest
http://jvi.asm.org/
FIG. 7—Continued.
on November 8, 2019 by guest
http://jvi.asm.org/
FIG. 7—Continued.
7586 BROCCHIERI ET AL. J. VIROL.
on November 8, 2019 by guest
http://jvi.asm.org/
FIG. 7—Continued.
on November 8, 2019 by guest
http://jvi.asm.org/
FIG. 7—Continued.
7588 BROCCHIERI ET AL. J. VIROL.
on November 8, 2019 by guest
http://jvi.asm.org/
FIG. 7—Continued.
on November 8, 2019 by guest
http://jvi.asm.org/
from MCMV (M31b and M73.5e2) and 10 newly annotated ORFs from RCMV (R23a, r25.3b, r38.5, r48.2, R73.5e2, R98a, R102b, r115.1, r153e3, and r153e1) were also confirmed by strong contrasts in S-profiles. S-profiles also distinguished the most likely reading frame within some of the groups of over-lapping MCMV and RCMV ORFs with similarity to one an-other (Table 1). Within two of these groups, S-profiles favored as coding regions RCMV ORF r48.2, homologous to published ORF m48.2, and ORF r124.1, homologous to published ORF m124. In a third group of ORFs overlapping M116 and R116, S-profiles identified in MCMV an ORF borne on the direct strand (m116.1), whereas RCMV conservation and S-profiles favored an ORF on the complementary strand (r115.1). Seven ORFs from MCMV (m44.1, m44.3, m45.2, m106.1, m106.3, m120.1, and m123.1) and seven ORFs from RCMV (r44.1, r44.3, r45.2, r106.1, r108.1, r124.2, and r133e2), identified by extended SSPA similarity, were not recognized by S-profiles. Of these, ORF m120.1 from MCMV and ORF r132e2 from RCMV showed particularly strong conservation. All 14 ORFs are listed in Tables 2 and 3 as potential protein-coding se-quences.
S-profiles of ORFs identified by BLASTP similarity. All annotated ORFs identified by BLASTP analysis and retained in Tables 2 and 3 are indicated. Among four ORFs in MCMV and eight ORFs in RCMV that were identified as candidate genes by BLASTP analysis (Tables S3 and S4 in the supple-mental material), three ORFs from RCMV, corresponding to two exons (r153e1 and r153e3) of the lectin-like gene and to a paralog (r169.1) of published ORF r171, were also supported by S-profiles. Exons 2 and 4 of r153 could not be confirmed by their S-profiles due to low G⫹C contents. Another ORF from RCMV (r58.1) was identified by BLASTP for its similarity to the regulatory protein E2 of human papillomavirus. Although S-profiles did not support the expression of this ORF over its entire length, the expression of the C-terminal portion (corre-sponding to the conserved region) was supported by extended GeneMark coding potentials and by a weak S-profile signal. Other BLASTP-identified coding regions were not supported by S-profiles, which strongly supported the authenticity of pre-viously annotated ORFs in the same regions. These findings suggest that a reevaluation of other published proteins match-ing these ORFs (mostly hypothetical proteins from various herpesviruses [see supplemental Tables S3 and S4]) would be valuable.
Nonconserved ORFs identified by S-profile analysis.Eight ORFs from MCMV (m20b, m116.1, m122.5, m122.6, m143b, m154.1, m154.2, and m163.1) and three ORFs from RCMV (r2.2, R27a, and r41.1), although not or poorly conserved, corresponded to strong contrasts in S-profiles and to extended regions of high coding potential. Among these, ORF m20b has been experimentally verified as a frameshift 3⬘ extension of m20 (23). We also interpreted ORF m143b as a frameshift 3⬘ extension (or possibly a second exon) of m143, consistent with the lack of an AUG codon. ORF R27a was interpreted as a frameshift 5⬘ extension of R27 and terminated at the corre-sponding approximate position (see the supplemental mate-rial). ORF r41.1 was similar to m41.1 mostly in a region coin-cident with a corresponding region of conservation with the overlapping published genes r41 and m41. However, strong contrasts in S-profiles and the presence of a conserved
initia-tion codon (AUG) strongly suggest that this ORF (and its MCMV homolog, m41.1) is expressed.
S-profiles and overlapping ORFs.S-profiles yielded useful verification of the position of most previously annotated ORFs of high (⬎50%) G⫹C content (see above). However, among these ORFs we identified 99 sequences that were only partially matched by S-profiles. The S-profile evidence for these se-quences was classified as “partial” in the “evidence” column of Tables S7 and S8, where it was also diagrammatically repre-sented (e.g., for ORF m25.2 “⫹⫹⫺” indicates that over ap-proximately the first two thirds of the annotated sequence, S-profiles conform to the expression of this ORF but not over the last third). Many partial S-profile inconsistencies observed in previously annotated genes coincided with the overlap of newly annotated sequences. In MCMV, 35 previously anno-tated genes overlapped 58 newly identified ORFs (Table S7), and in RCMV, 24 previously annotated genes overlapped 35 newly identified ORFs (Table S8). Irregular S-profiles were observed in these regions of overlap. In 36 of these situations, the identification of a new ORF fully explained the irregularity (supplemental Tables S7 and S8). Irregular regions could be partly explained in 18 other cases.
Alternative start of translation of previously annotated ORFs. The use of an alternative translation start site was suspected when consistent S-profiles failed to coincide with the most 5⬘-end-proximal AUG in annotated genes. Alternative initiation sites have already been characterized for some genes, such as MCMV m131, a short first exon of themckgene, where the fourth AUG codon in the full-length ORF is where trans-lation starts (27).
Using S-profile analysis, we identified 25 ORF candidates in the MCMV genome that may employ alternative translation start sites located upstream of the previously annotated site (Table S7). A different initiation codon downstream of the previous annotation was predicted in 19 cases (m9, M25, m25.1, M31, M34, M43, M51, M53, M55, M69, M71, M72, M73, M77, M102, m119.1, m131, and m139) (Table S7). An upstream start site was suggested by S-profiles for ORF m16, although no AUG codon was found in this region.
In RCMV we found 11 ORF candidates for alternative start sites (Table S8), 9 of these apparently starting downstream and 2 (r4 and r70.1) apparently starting upstream of previously suggested start sites. Six of the nine ORFs for which S-profiles suggested a downstream start of translation (R31, r41, r74, R91, R115, and r171.1) also encoded a putative initiation co-don (AUG) in corresponding positions. For three ORFs (R77, R122e5, and r166) in which an alternative start site could not be predicted, overlap to other coding sequences was found to explain the observed profiles. In the case of R122e5, S-profiles were also consistent with an alternative exon structure. In the cases of r4 and r70.1, S-profiles strongly confirmed evidence from sequence conservation that the coding regions of these genes should be extended 5⬘of the original annotation (see also the section on SSPA similarity analysis and the sup-plemental material).
Other contributing evidence from S-profiles. S-profile in-consistencies were found in published ORFs of high G⫹C content from MCMV (M24, m25.2, M46, m48.2, M50, M69, M71, M87, M93, M112e1, m129, m131, m144, m159, m163, m165, and m170) and from RCMV (R43, r70.4, R77, r133, and
7590 BROCCHIERI ET AL. J. VIROL.
on November 8, 2019 by guest
http://jvi.asm.org/
r171) that could not be explained by overlapping sequences or alternative translation initiation. Most striking examples of these arrangements were found in genes M69, M87, and R77. Although the nature of these anomalous regions was unclear, in specific cases these might correspond to proteins of peculiar amino acid compositions or to the presence of introns.
Annotated genes not evidenced by S-profiles.Fourteen pre-viously annotated genes from MCMV and 42 from RCMV could not be confirmed by S-profiles due to low G⫹C content (indicated in Tables S7 and S8 as not applicable). Virtually all of these genes belonged to the regions of low G⫹C content of the corresponding genomes. The only exception was gene m74, which had uncharacteristically low G⫹C content despite its location in the high-G⫹C region of MCMV. Among annotated genes of high G⫹C content, 39 genes from MCMV and 28 genes from RCMV did not show the expected S-profile con-trasts even though their G⫹C contents were often⬎60%. In the case of m19, m48.1, m108, M116, m119.5, and m134 from MCMV and r2.1, r4.1, r25.2, r95.1, and r167 from RCMV (indicated as “contradicted” in Tables S7 and S8), S-profiles largely contradicted their expression, providing evidence for expression of overlapped ORFs in different frames. Fifty-six other annotated genes (classified by “no evidence” in Tables S7 and S8) had high G⫹C contents in all three codon positions. The atypical S-profiles underlying these genes may be a con-sequence of corresponding gene products of atypical amino acid composition. It must be noted that most of these genes were not conserved between MCMV and RCMV and that their expression and functionality have not been characterized as yet in any direct investigation.
DISCUSSION
The sequencing of genomes and the use of different anno-tation methods have brought considerable revisions to the def-inition of the gene complement of cytomegalovirus. In partic-ular, the human CMV genome sequence has been updated with analyses of additional strains (9, 17, 33) and comparisons of cytomegaloviruses from related species (14, 32, 33). We have compared the gene contents of the closely related MCMV Smith strain and RCMV Maastricht strain genomes, emphasizing sequence conservation and frame-specific G⫹C content (5). As a consequence of this analysis, we propose substantial revision to the annotation of these genomes. In MCMV, 14 newly identified ORFs were convincingly charac-terized as protein coding and 113 other ORFs showed evidence of a protein-coding capacity. Our analyses suggest the reeval-uation of the translation start site of at least 18 previously annotated protein-coding sequences and provide S-profile ev-idence that contradicts the expression of six previously anno-tated genes. In RCMV we found strong evidence of at least 20 newly identified protein-coding sequences and the potential for 85 other coding sequences. We propose alternative trans-lation start sites for at least eight previously annotated genes and provide evidence that suggests that five others are not expressed. At least two (up to four) examples in MCMV genes and at least five (up to six) examples in RCMV genes were found where frameshifts extend previously annotated genes. Among these newly annotated genes we have included in the MCMV genome a protein identified (23, 42a) as an alternative
spliced form of M73 (M73.5e2) and we have identified its homolog in RCMV, designated R73.5e2. In RCMV we have also identified a second exon to ORF r133 (r132e2) and a homolog to a lectin-like protein (46) encoded by four exons (r158e1 to e4).
We have avoided conventional criteria of minimum ORF length (ⱖ100 codons) and maximum ORF overlap (⬍60%) to prevent the a priori exclusion of a class of genes that has previously been found only by direct experimental investiga-tion. We also have not required an AUG codon to be present in potential coding regions. This allowed us to uncover small and overlapping ORFs, mRNA splicing, use of alternative translation initiation sequences in the coding complement of herpesvirus genomes, and several frameshifts within coding sequences. In fact, two of the frameshift extensions identified by our analysis in the MCMV genome, m20b and M31b, have been experimentally verified as correct 3⬘-terminal sequences of genes m20 and M31 (23). Alternative translation initiation signals are apparently used in a bona fide complete gene (R71, renamed r70.1) and in ORF r4, whose conservation and S-profile signals clearly extend 5⬘ of their first AUG codon. Other examples of herpesvirus coding regions not initiated by an AUG codon have been reported (46). A coding sequence lacking an initiation codon may also relate to a potential mul-tiexonic structure of the corresponding genes or appear as a consequence of sequencing errors.
Our analyses revealed intriguing anomalies and potential in the G⫹C distribution (S-profiles) within annotated genes. Within annotated genes showing N-terminal anomalies in S-profiles, AUG codons were often located near the ends of these regions. This suggested the possibility of an alternative start of translation. An interesting example is M25 from MCMV, encoding tegument protein pM25. This protein pre-sents extensive low-complexity regions 5⬘ of several possible alternative starts of translation identified by our analysis. In-triguingly, in viral preparations, pM25 is found in forms of different molecular masses, identified as a true late 130-kDa peptide (included in the tegument) and two early 105-kDa and 95-kDa peptides (47) and later also as a 200-kDa, 52-kDa, or 48-kDa peptide (23). Peptides translated from the AUG co-dons corresponding to the region of conservation between MCMV and RCMV and to consistent S-profiles have pre-dicted molecular masses of 57.2 kDa and 45.2 kDa. The sizes of these peptides are consistent with the smaller peptides iso-lated from viral preparations before replication (the annotated gene has a predicted molecular mass of 103 kDa). We suggest that some peptides from M25 may result from alternative tran-scription and translation start sites rather than from posttrans-lational proteolysis.
Interesting anomalies in G⫹C distribution were evident also in gene M55 (glycoprotein B) from MCMV. This gene shows striking differences in S-profiles between its 5⬘-terminal, cen-tral, and 3⬘-terminal parts (Fig. 6). The functional form of this protein is generated by cleavage in the central part of the protein (38, 44). The 3⬘part of the gene, corresponding to the region of highest S-profile contrasts, is preceded by an AUG codon and two putative TATA box sequences (see the supple-mental material). This suggests that the C-terminal part of glycoprotein B may also be alternatively translated from a shortened transcript.
on November 8, 2019 by guest
http://jvi.asm.org/
TABLE 2. Characteristics of newly annotated ORFs in MCMV
Coding regiona % G⫹C content Name Presence of Met Low bias Conservation Sd Ge Evidencef Published overlapping gene
4205–4378 48.9 m4.1 ⫹ ⫹ F m5
C4216–4374 49.1 m4.2 ⫹ F m5
C6600–6731 53.0 m7.1 P m7
C6735–6815 49.4 m7.2 ⫹ ⫹ P m7
6942–7115 54.6 m7.3 ⫹ F m7
C7023–7202 55.0 m7.4 ⫹ ⫹ ⫹ ⫹ P m7
7956–8219 60.6 m8.1 ⫹ ⫹ F m8
C8477–8608 54.5 m8.2 ⫹ ⫹ P m8
9075–9191 49.6 m9.1 ⫹ ⫹ ⫹ F m9
11131–11304 49.4 m11.1 ⫹ F m11
12042–12239 41.9 m12.1 ⫹ F m12
12505–12738 53.4 m12.2 ⫹ ⫹ ⫹ P m13
14143–14259 51.3 m15.1 ⫹ P m15
14657–15673 44.1 m16 ⫹ (⫹) (⫹) P m16
15265–15432 50.0 m16.1 ⫹ F m16
15481–15609 51.9 m16.2 ⫹ ⫹ F m16
17053–17478 62.2 m18.1 ⫹ ⫹ ⫹ P m18
C17897–18412 66.9 m18.2 ⫹ ⫹ P m18
17963–18361 67.7 m18.3 ⫹ ⫹ P m18
18937–19086 62.7 m18.4 ⫹ ⫹ ⫹ F m18
C19124–19279 64.1 m18.5 ⫹ ⫹ P m18
19727–20041 65.1 m18.6 ⫹ ⫹ P m18
20591–20890 65.7 m19.1 ⫹ ⫹ ⫹ P m19
C20582–20958c 65.8
m20b NAb ⫹ ⫹ ⫹ F m19, m20
23620–23973 61.6 m22.1 ⫹ ⫹ ⫹ P m22, M23
26835–27278 64.2 m25.01 ⫹ ⫹ P M25
C27248–27454 60.4 m25.02 ⫹ ⫹ ⫹ F M25
29443–29481 79.5 m25.15 ⫹ P m25.1
C31263–31346 69.0 m25.3 ⫹ ⫹ F
31794–32099 63.1 m26.1 ⫹ ⫹ ⫹ ⫹ P M26
C31910–32065 67.9 m26.2 ⫹ ⫹ ⫹ F M26
⬍35647–35784 56.5 m28.1 ⫹ ⫹ F M28
35934–36029 67.7 m28.2 ⫹ ⫹ F m29
C36826–37011 58.1 m29.2 ⫹ ⫹ F m30
C37105–37644 65.4 m30.1 ⫹ ⫹ ⫹ ⫹ P m30
C37251–37379 67.4 m30.2 ⫹ ⫹ ⫹ F m30
38775–39065c 60.8 M31b* NA ⫹ ⫹ ⫹ ⫹ F M31
40027–40527 60.3 m32.1 ⫹ ⫹ P M32
41486–41605 68.3 m32.2 ⫹ ⫹ ⫹ P
C43067–43297 67.1 m33.1 ⫹ ⫹ ⫹ P M34
C44822–45280 66.2 m34.1 (⫹) ⫹ P M34
C51780–52367 58.5 m38.5* ⫹ ⫹ ⫹ ⫹ P M38
51879–52049 59.1 m38.6 ⫹ (⫹)c ⫹ ⫹ F M38
C54019–54189 63.2 m41.1 ⫹ (⫹) (⫹) m41
54470–54685 64.4 m42.1 ⫹ ⫹ ⫹ F m42
C54867–54989 51.2 m42.2 ⫹ ⫹ ⫹ F
55382–55630 64.3 m43.1 ⫹ ⫹ P M43
C57059–57166 63.0 m43.2 ⫹ F M43
C57467–57748 49.6 m43.3 ⫹ ⫹ P
59044–60105 61.6 m44.1* ⫹ ⫹ ⫹ (⫹) M45
59141–59425 60.7 m44.3* ⫹
62806–62886 49.4 m45.2* ⫹ m45.1
63077–63199 67.5 m46.1 (⫹) ⫹ ⫹ P M46
74589–74756 70.8 m49.1 ⫹ (⫹) ⫹ ⫹ P M49
76198–76269 59.7 m50.1 (⫹) ⫹ F M50
C85515–85664 59.3 m55.1 ⫹ ⫹ F M55
C91750–92352 64.7 m58.1 ⫹ ⫹ (⫹) ⫹ ⫹ P M58
101387–101473 60.9 m70.1 ⫹ (⫹) ⫹ P M71
C105629–105691 46.0 m74.1 ⫹ ⫹ P m74
>105797–106069d 56.0
M73.5e2* NA ⫹ ⫹ ⫹ ⫹ F m74
C105907–106092 54.8 m74.2 ⫹ ⫹ P
117995–118600 64.9 m83.1 ⫹ ⫹ ⫹ P M83
118607–118819 61.5 m83.2 (⫹) ⫹ ⫹ P M83
120497–120742 71.5 m84.1 ⫹ (⫹) ⫹ ⫹ P M84
C140098–140514 61.9 m96.1 ⫹ ⫹ (⫹) (⫹) P M97
148138–148275 42.0 m102.1 P M103
148330–148437 56.5 m103.1 ⫹ (⫹) ⫹ P M103
C152720–153478 58.8 m105.1 ⫹ (⫹) (⫹) (⫹) P M105
C154196–154363 68.5 m106.1* ⫹ ⫹ (⫹) m106
154213–154365 69.9 m106.2 ⫹ ⫹ P m106
C155781–155918 35.5 m106.3* ⫹
C159096–159176 51.9 m106.4 (⫹) ⫹ F
160169–160219 39.2 m106.5 ⫹ F
Continued on facing page
7592 BROCCHIERI ET AL. J. VIROL.
on November 8, 2019 by guest
http://jvi.asm.org/
Many anomalies in S-profiles involving the central or C-terminal parts of annotated sequences cannot be explained by alternative start codons. In many cases these coincide with parts of the protein that are not conserved and often include low-complexity sequences, as, for example, in the pairs of ho-mologs M34/R34, M56/R56, M69/R69, M83/R83, and M105/ R105. The hydrophilic amino acid composition and lack of sequence conservation of these regions suggests that they may function as flexible linkers between separate functional
do-mains of a protein or that they may correspond to loops or, for terminal elements, to nonfunctional tails. In the case of MCMV m45.1, the entire sequence has an anomalous compo-sition (see the supplemental material). It is possible that m45.1 evolved from a seemingly nonfunctional N-terminal sequence of M45, still present in the homologous sequence R45 from RCMV.
[image:24.585.46.541.81.547.2]The herpesvirus capsid limits the size of the genome that can be packaged. From this perspective, it seems unlikely that TABLE 2—Continued
Coding regiona % G⫹C content Name Presence of Met Low bias Conservation Sd Ge Evidencef Published overlapping gene
162129–162293 63.0 m107.1 ⫹ ⫹ P m107, m108
C162095–162478 62.2 m107.2 ⫹ ⫹ P m107, m108
C162605–162862 69.0 m107.3 ⫹ ⫹ ⫹ ⫹ P m107, m108
C163222–163527 66.7 m112.1 ⫹ ⫹ (⫹) ⫹ ⫹ P M112e1
C163771–163911 65.2 m112.2 (⫹) ⫹ ⫹ P M112e1
167209–167970 57.1 m116.1 ⫹ ⫹ (⫹) ⫹ ⫹ P M116
C168283–168438 51.3 m116.2 (⫹) ⫹ ⫹ P M116
C168442–168543 51.0 m116.3 ⫹ ⫹ P M116
169930–170400 62.6 m117.2 ⫹ ⫹ P m117, m117.1
173438–173542 57.1 m119.31 ⫹ (⫹) ⫹ ⫹ P m119.3
C173525–173608 46.4 m119.32 ⫹ ⫹ P m119.3
C174640–175665 52.3 m120.1* ⫹ ⫹ ⫹ (⫹)
175550–175612 49.2 m120.2 ⫹ ⫹ P
C175875–176105 59.3 m121.1 ⫹ ⫹ P M121
C176053–177123 59.2 m121.2 ⫹ ⫹ (⫹) ⫹ P M121
C176109–176384 60.1 m121.3 ⫹ P M121
176251–176475 65.3 m121.4 ⫹ ⫹ ⫹ P M121
176479–176640 56.2 m121.5 ⫹ P M121
178320–178439 60.0 m122.1 ⫹ ⫹ (⫹) ⫹ P M122e5
178653–179081 55.9 m122.2 ⫹ (⫹) ⫹ ⫹ P M122e5
C179095–179217 52.0 m122.3 ⫹ ⫹ F M122e5
179843–179896 63.0 m122.4 ⫹ P M122e4
C179996–180232 54.0 m122.5 ⫹ ⫹ ⫹ P M122e4
180108–180377 55.9 m122.6 ⫹ ⫹ F M122e4
C181863–182219 48.7 m123.1* ⫹ ⫹ m124–m124.1
185677–185715 56.4 m127.1 ⫹ ⫹ ⫹ P
190220–190444 58.7 m135.1 ⫹ ⫹ ⫹ P m134–m136
190728–190958 50.2 m135.2 ⫹ (⫹) ⫹ P m136
192243–192377 63.0 m137.1 ⫹ ⫹ P m138
192531–192770 62.1 m138.1 ⫹ (⫹) ⫹ ⫹ P m138
C200667–201368 68.6 m142.1 ⫹ ⫹ ⫹ ⫹ P m142, m143
C200966–201385> 74.5 m143b NA ⫹ ⫹ F m143
204291–204500 54.8 m145.1 ⫹ ⫹ ⫹ P m145
C204393–204515 53.7 m145.2 ⫹ ⫹ P m145
204765–204863 60.6 m145.3 (⫹) ⫹ F m145
207855–208160 62.1 m150.1 ⫹ ⫹ ⫹ ⫹ P m149, m150
208508–208660 53.6 m150.2 ⫹ ⫹ ⫹ P m150
209049–209306 56.2 m151.1 ⫹ ⫹ ⫹ ⫹ P m151
212933–213043 56.8 m153.1 ⫹ F m154
212964–213428 57.6 m154.1 ⫹ ⫹ P m154
C213414–213617 57.4 m154.2 (⫹) ⫹ ⫹ F m154
216145–216369 48.9 m157.1 ⫹ (⫹) ⫹ ⫹ P m157
C217486–217686 49.3 m158.1 ⫹ (⫹) ⫹ ⫹ P m158
217730–217801 50.0 m158.2 ⫹ P m158
218648–218734 47.1 m159.1 ⫹ (⫹) ⫹ P m159
222109–222177 66.7 m163.1 ⫹ ⫹ ⫹ ⫹ F m163
223391–223609 66.7 m165.1 (⫹) ⫹ ⫹ P m165
224046–224123 69.2 m165.2 ⫹ ⫹ P m165
226603–226764 68.5 m167.1 ⫹ ⫹ P m167
C227760–227789 66.7 m167.2 ⫹ F
228747–228872 57.1 m169.1 ⫹ ⫹ F
229438–229662 70.7 m170.1 ⫹ ⫹ P m170
230127–230261 59.3 m171 ⫹ ⫹ P
a
“C” refers to complementary strand. ORFs identified by SSPA similarity are marked with an asterisk (see Table 1). *, from Table 1;⬍, uncertainty in boundary
of the coding region.
b
NA, not applicable.
c
(⫹), weak levels.
d
Coding potential based on S-profiles.
e
Coding potential based on GeneMark protocol.
f
S-profile evidence over partial (P) or complete (F) sequence.
on November 8, 2019 by guest
http://jvi.asm.org/
TABLE 3. Characteristics of newly annotated ORFs in RCMV
Coding region % G⫹C Name Presence of Met Low bias Conserved S-bias G Evidence Published overlapping gene(s)
14–1030 69.4 r1.1 ⫹ P r1
C2–610 73.7 r1.2 ⫹ ⫹ P r1
2597–2791 74.9 r2.05 ⫹ ⫹ ⫹ ⫹ F r2
C3228–4145 75.6 r2.2 ⫹ ⫹ ⫹ ⫹ P r2, r2.1
3637–3837 72.6 r2.3 ⫹ ⫹ P r2, 2.1
5049–5156 71.3 r2.4 ⫹ ⫹ ⫹ ⫹ P r2.1
C5754–7301 74.7 r4* ⫹ ⫹ ⫹ ⫹ P r4, r4.1, r5, r5.1
C8594–8776 78.1 r6.1 ⫹ ⫹ F r6
C<9753–9860 75.9 R23a* ⫹ ⫹ ⫹ ⫹ F r5.1, r6, r23, r23.1
C11891–12664 73.6 r24.1 ⫹ ⫹ ⫹ ⫹ P R25
C13723–13881 71.1 r24.2 ⫹ F
C13969–14046 61.5 r24.3 ⫹ F r25.1
C15305–15961 69.4 r25.3b* NA ⫹ ⫹ ⫹ ⫹ F r25.2, r25.3
C<19321–19491 73.3 R27a ⫹ (⫹) ⫹ ⫹ F R27, r27.1
C21727–22476 70.8 r31.1 ⫹ ⫹ ⫹ P R31
C28905–29168 67.4 r34.1 ⫹ ⫹ ⫹ P R34
C29490–29753 75.8 r34.2 ⫹ ⫹ ⫹ F R34
34340–34414 72.0 r37.1 ⫹ F R37
34613–35245 72.2 r37.2 ⫹ ⫹ ⫹ P R37, R38
C35741–36322 69.2 r38.5* ⫹ ⫹ ⫹ ⫹ P R38
C37859–38023 69.7 r41.1 ⫹ ⫹ (⫹) ⫹ ⫹ F r41
42221–42832 66.8 r44.1* ⫹ ⫹ R44, R45
42507–42608 61.8 r44.3* ⫹ ⫹
C42344–42424 67.9 r44.2 ⫹ ⫹ ⫹ P
45413–45760 76.1 r45.2* ⫹ ⫹ (⫹) R45
C56102–56359 68.6 r48.2* ⫹ ⫹ ⫹ ⫹ ⫹ F R49
67187–67228 54.8 r55.1 ⫹ ⫹ P R55
67232–67276 55.6 r55.2 ⫹ P R55
67913–68161 71.1 r55.3 ⫹ ⫹ ⫹ ⫹ P R55, R56
68883–69371 74.