Topic Note: 2012 Phonics Screening
Check
Research report
May 2013
2
Contents
Table of figures 4
Executive Summary 5
1 Introduction 7
1.1 Aim 7
1.2 Background 7
1.2.1 The phonics screening check 7
1.2.2 The phonics pilot check 8
2 Phonics Screening Check Results by Pupil Characteristics 9
Summary 9
2.1 Introduction 9
2.2 Pupils meeting the expected standard in phonics decoding 9
2.2.1 Special Educational Needs 13
3 Investigating the relationship between the Early Years Foundation Stage Profile and the Phonics
Screening Check 14
Summary 14
3.1 Introduction 14
3.2 The Early Years Foundation Stage 14
3.3 Early Years Foundation Stage Profile results, 2011 16
3.4 Analysis of the relationship between the EYFS Profile and Phonics Screening Check results 18
3.4.1 Correlation 18
3.4.2 Regression 19
4 Key Stage 1 Performance and Participation in the Phonics Pilot Check 22
Summary 22
4.1 Introduction 22
3 4.3 Key Stage 1 attainment by pupils according to their phonics pilot check score 24
4.4 Value Added for phonics pilot participating schools 27 5 Pupils on the borderline of meeting the expected standard in phonics decoding 28
Summary 28
5.1 Introduction 28
5.2 National distribution of the phonics screening check 28 5.3 Modelling results without the spike at the expected standard on phonics decoding29 5.4 Logistic regression without the spike at the expected standard in phonics decoding30 Annex A – Correlation between Early Years Foundation Stage Profile and the phonics screening
check scores 31
4
Table of figures
Figure 2.1 Percentage of pupils meeting the expected standard in phonics decoding by ethnicity,
2012 10
Figure 2.2 Percentage of pupils meeting the expected standard in phonics decoding by pupil
characteristics, 2012 12
Table 2.1 Percentage of pupils meeting the expected standard in phonics by SEN primary need,
2012 13
Table 3.1 Maps the thirteen assessment scales to the six areas of learning and development
under which they are tested. 15
Table 3.2 Cross-tabulation of Phonics and Early Years Foundation Stage outcomes 16 Figure 3.1 Early Years Foundation Stage Profile by Phonics Check Outcome, 2011 and 2012 17 Table 3.3 Pearson Correlation Coefficients between the phonics screening check outcome and components of the Early Years Foundation Stage Profile, 2012 19 Figure 3.2 Effects of pupil characteristics on odds of meeting the expected standard in the
phonics screening check, 2012 21
Table 4.1 Average 2011 phonics pilot check and 2012 phonics screening check scores 24 Table 4.2 Percentages of Pupils who met the Expected and Above Level in 2012 Key Stage 1 speaking and listening, reading and writing by 2011 Phonics Pilot outcome 26 Table 4.3 Average School Level EYFS to Key Stage 1 Value Added Score, 2012 27 Figure 5.1 National distribution of the phonics screening check score, 2012 29 Figure 5.2 National distribution of the phonics screening check score – actual and modelled, 2012
30 Table A.1 Correlation between the phonics screening check scores and each assessment scale of
the EYFS Profile 31
Table B.1 Early Years Foundation Stage Profile Logistic Regression Model Coefficients 32 Table B.2 Early Years Foundation Stage Profile Logistic Regression Model Coefficients for Pupil
5
Executive Summary
This topic note presents statistics and analysis of the phonics screening check results in 2012. The key findings of this analysis are summarised below:
Phonics screening check results by pupil characteristics
58% of eligible pupils met the expected standard for the screening check, with a higher proportion of girls and a lower proportion of pupils eligible for Free School Meals (FSM) achieving this expected standard.
The percentages of Indian and Chinese pupils meeting the expected standard was higher than other ethnic groups, while the first language of pupils made very little difference to meeting the standard.
Investigating the relationship between the Early Years Foundation Stage Profile and the phonics screening check
Three quarters of pupils assessed in the phonics screening check were working securely
within the linking sounds and letters assessment scale, the component of the Early Years Foundation Stage Profile with the strongest relationship to pupils’ phonics screening check scores.
A pupil who was working securely within the linking sounds and letters assessment scale at the Early Years Foundation Stage Profile was 2.5 times more likely to meet the expected standard in phonics than a pupil with the same characteristics but who did not work securely within linking sounds and letters.
A pupil who was working securely within the writing assessment scale is 3 times more likely to meet the expected standard in phonics decoding than a pupil with the same
characteristics who did not work securely within writing.
Key Stage 1 performance and participation in the phonics pilot check
Nearly all pupils that reached the expected standard in the 2011 phonics pilot check
achieved the expected level in 2012 Key Stage 1 speaking and listening, reading and writing.
6 Pupils on the borderline of meeting the expected standard
7
1 Introduction
1.1 Aim
This topic note presents statistical analysis of the phonics screening check results in 2012. The paper initially investigates the relationship between the phonics screening check results and pupil characteristics, including ethnicity, Special Educational Needs (SEN) status and Free School Meals (FSM) eligibility in Chapter 2. Chapter 3 considers the relationship between pupils’ results in the Early Years Foundation Stage at age 5 and the phonics screening check results a year later. The strength of the relationship between the phonics screening check and these two outcomes is explored using correlation and regression analysis.
Chapter 4 looks at the change in Key Stage 1 results for pupils who were assessed during the phonics pilot check to get an indication of how the phonics screening check will affect subsequent attainment.
Finally, Chapter 5 looks at the national distribution of the phonics screening check and considers the impact of borderline scores being marked up to the threshold.
1.2 Background
The phonics screening check was introduced in 2012 and results from the phonics screening check, covering all Year 1 pupils attending mainstream schools, academies and free schools in England, have been collected and analysed by the Department for Education (DfE). The data used for this analysis contains the total phonic screening check scores for each pupil and whether or not that pupil has met the expected standard in phonics decoding. The total available marks on the check are 40 and if a pupil is able to decode 32 or more words then they have met the expected standard.
The DfE also collects pupil-level data for all pupils attending mainstream schools via the School Census. The School Census collects data on a variety of pupil characteristics such as gender, ethnicity, and FSM eligibility. The School Census is linked to the National Pupil Database, which contains attainment data in national tests and examinations. By using the National Pupil Database, a comprehensive analysis of the phonics screening check results can be carried out.
1.2.1 The phonics screening check
8 they can improve their decoding skills, and will then have the opportunity to retake the phonics screening check in Year 2.
The check comprises a list of 20 words and 20 non-words that children read one-to-one with a teacher who is known to the child. The teacher is then expected to use their professional judgement about which responses are correct. The phonics screening check was administered during week commencing 18 June 2012. In 2012, pupils were deemed to have met the expected standard of phonic decoding if they scored 32 or more out of a possible 40 in the test. This mark was communicated to schools in advance of the phonics screening check being administered so that schools could immediately put in place extra support for pupils who had not met the expected standard.
1.2.2 The phonics pilot check
The phonics screening check was piloted in 296 schools in June 2011. The DfE invited a representative sample of schools to take part in the pilot and participation was optional. Each school in the pilot administered a version of the phonics screening check to their pupils in Year 1. There were 18 different versions of the phonics screening check trialled in pilot schools. As set out in the framework, 40 words were included in each form and a total of 360 words were trialled, meaning that each word appeared in two of the trial forms. Each version had a slightly different threshold for the expected standard ranging from 31 to 34 out of 40.
Each version of the check used in the trial, also comprised of 20 words and 20 non-words, with the same page by page structure as the check used in 2012. However, some adjustments to the check were made following the pilot, including;
Inclusion of a picture of an imaginary creature next to each non-word rather than just some non-words as in the pilot.
9
2 Phonics Screening Check Results by Pupil Characteristics
Summary
58% of all eligible pupils met the expected standard of 32 marks out of 40 on the phonics screening check.
A higher proportion of girls met the expected standard than boys, 62% and 54% respectively.
The percentage of Indian pupils meeting the expected standard was higher than any other
ethnic group at 70% and the percentage of Chinese pupils was slightly lower at 69%.
A lower proportion of pupils known to be eligible for Free School Meals (FSM) achieved the expected standard, 44% compared to 62% of pupil not eligible for FSM.
There was very little difference in the percentage of pupils meeting the expected standard for pupils with English as a first language and pupils whose first language was not English – 58% of pupils in both groups met the expected standard.
2.1 Introduction
This chapter presents analysis of the 2012 phonics screening check by pupil characteristics, including ethnicity, gender and Special Educational Needs (SEN) status, where the percentage of pupils in these pupil groups who have met the expected standard is compared. Pupils who scored at least 32 out of 40 on the screening check have met the expected standard in phonics decoding. This section also looks deeper into the phonics screening check result by SEN primary need type.
2.2 Pupils meeting the expected standard in phonics decoding
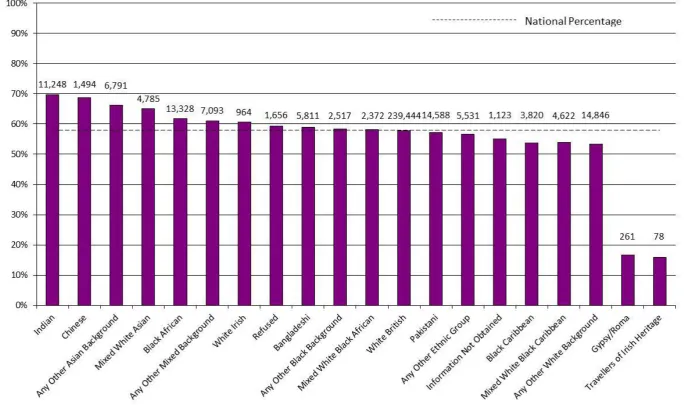
Figure 2.1 on the following page shows the numbers and percentage of pupils meeting the expected standard in phonics decoding by ethnicity. The bars measure the percentage of pupils meeting the expected standard and the numbers above the bar show the actual numbers of pupils who met the expected standard. Nationally, 58% of pupils met the expected standard and this is shown by the dotted vertical line on the chart to aid comparisons to the national average for each pupil group.There was a lot of variation in the proportion of pupils meeting the expected standard by ethnicity. The chart shows that Indian pupils was the ethnic group with the highest percentage of pupils meeting the expected standard at 70% and the percentage of Chinese pupils was slightly lower at 69%. Travellers of Irish Heritage had the lowest proportion of pupils meeting the expected
10
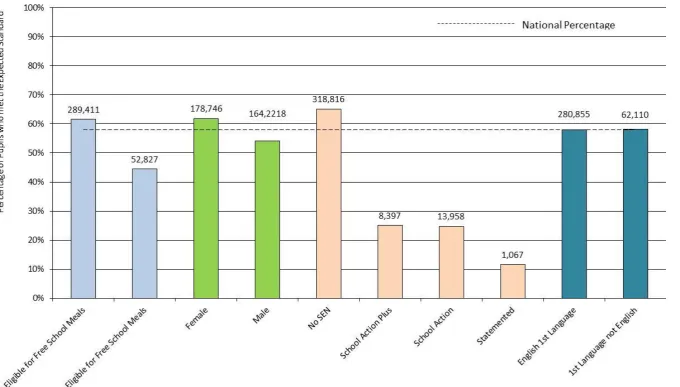
11 Figure 2.2 shows the percentage and numbers of pupils who met the expected standard by other pupil characteristics. The chart shows that girls performed better than boys, with a higher
proportion of girls meeting the expected standard than boys, 62% and 54% respectively. Also, there was very little difference in the results of pupils whose first language was English and was not English. 58% of pupils whose first language was not English met the expected standard – the same as the percentage of pupils whose first language was English.
A lower proportion of pupils known to be eligible for FSM achieved the expected standard, 44% compared to 62% of pupil not eligible for FSM.
12
13
2.2.1 Special Educational Needs
[image:13.595.79.517.240.440.2]In the previous section it was shown that pupils with SEN did not perform as well as pupils with no SEN. This section investigates if pupils with particular SEN Primary Needs performed differently. Table 2.1 shows the proportion of pupils who met the expected standard by primary need type. The results show that the percentage of pupils meeting the expected standard is lower than the national average for all primary need type. There is also a lot of variation of the results by primary need type. For example, pupils with visual impairments had the highest proportion meeting the expected standard with 35% of pupils achieving this. However, only 2% of pupils with severe learning difficulties met the expected standard – the lowest proportion of all primary need type.
Table 2.1 Percentage of pupils meeting the expected standard in phonics by SEN primary need, 2012
Primary Need Type % of pupils meeting the
expected standard
Number of pupils participating in the phonics screening check
Visual Impairment 35% 619
Hearing Impairment 30% 940
Behaviour, Emotional and Social Difficulty 29% 6,701
Physical Disability 28% 1,958
Other Difficulty/Disability 27% 1,708
Autistic Spectrum Disorder 24% 3,803
Multi-Sensory Impairment 24% 91
Speech Language and Communication Difficulty 23% 17,888
Specific Learning Difficulty 17% 1,516
Moderate Learning Difficulty 11% 5,157
Profound and Multiple Learning Difficulty 2% 784
Severe Learning Difficulty 2% 1,543
14
3 Investigating the relationship between the Early Years
Foundation Stage Profile and the Phonics Screening Check
Summary
Of the pupils assessed in the phonics screening check in 2012, 60% reached a Good Level of Development and 80% were working securely within the linking sounds and letters assessment scale when they were assessed the previous year at the Early Years Foundation Stage (EYFS).
The mean Early Years Foundation Stage Profile (EYFSP) total point score for pupils who did meet the expected standard for the phonics screening check was 94.2 and was 79.2 for pupils who did not meet the expected standard.
The linking sounds and letters assessment scale is the component of the EYFSP with the strongest relationship with pupils’ phonics screening check scores with a correlation coefficient of 0.64.
A pupil who was working securely within the linking sounds and letters assessment scale is
2.5 times more likely to meet the expected standard in phonics decoding than a pupil with the same characteristics who did not work securely within linking sounds and letters.
A pupil who was working securely within the writing assessment scale is 3 times more likely to meet the expected standard in phonics decoding than a pupil with the same
characteristics who did not work securely within writing.
3.1 Introduction
Pupils participating in the 2012 phonics screening check were also assessed a year earlier at the end of the EYFS in 2011. This chapter investigates the relationship between pupils’ EYFSP results and their scores on the phonics screening check in Year 1. Correlation and regression were used to investigate this relationship.
3.2 The Early Years Foundation Stage
The EYFS is a framework that sets standards for development, learning and care of children from birth to five years old. A key component of this framework was the EYFSP, an observational based assessment which sums up and describes each child’s development and learning achievements at the end of the EYFS when they turn five.
15
Personal, social and emotional development (PSE)
Communication, language and literacy (CLL)
Problem solving, reasoning and numeracy (PSRN) 1
Knowledge and understanding of the world (KUW)
Physical development (PD)
[image:15.595.69.421.231.396.2] Creative development (CD)
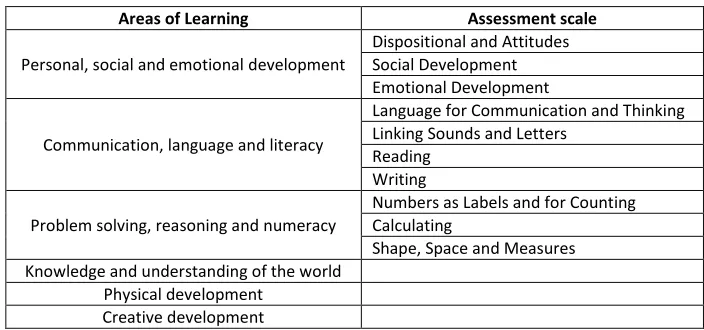
Table 3.1 Maps the thirteen assessment scales to the six areas of learning and development under which they are tested.
Areas of Learning Assessment scale
Personal, social and emotional development
Dispositional and Attitudes Social Development Emotional Development Communication, language and literacy
Language for Communication and Thinking Linking Sounds and Letters
Reading Writing Problem solving, reasoning and numeracy
Numbers as Labels and for Counting Calculating
Shape, Space and Measures Knowledge and understanding of the world
Physical development Creative development
These thirteen assessment scales, which were derived from the early learning goals2, each have nine scale points that capture and describe children’s achievement at the end of the EYFS.
Further details of the individual scale points which make up the thirteen scales can be found in the EYFSP Handbook3.
This section of the topic note mostly focuses on two components of the EYFSP:
Children reaching a Good Level of Development; and
Children working securely within the Linking Sounds and Letters Early Learning Goal, which
requires pupils to apply phonics knowledge.
A child is said to have reached a Good Level of Development when he/she achieves a score of 78 points across the 13 assessment scales with at least 6 or more points in the communication, language and literacy and personal, social and emotional development scales.
1
This was formerly referred to as Mathematical Development
2 The early learning goals are a set of statutory expectations for most children to reach by the end of the EYFS, details of which
are available on the following webpage:
http://nationalstrategies.standards.dcsf.gov.uk/eyfs/site/requirements/learning/goals.htm
3
16 A child who achieves a scale score of 6 points or more for any assessment scale is classified as working securely within the Early Learning Goal for that assessment scale. So a child is expected to get 6 or more points in linking sounds and letters in order to be working securely in this
assessment scale.
3.3 Early Years Foundation Stage Profile results, 2011
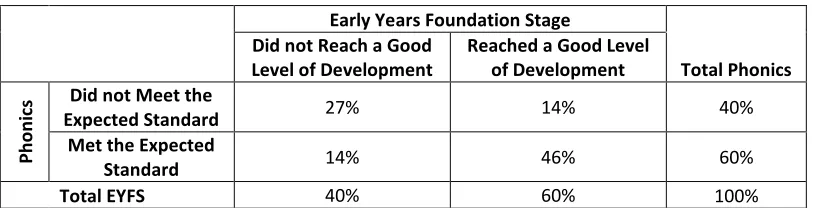
Of the pupils assessed in the phonics screening check in 2012, 60% reached a Good Level of Development and 80% were working securely within the linking sounds and letters Early Learning Goal in the EYFSP. Table 3.2 is a cross tabulation of the pupils meeting the expected standard in phonics decoding and achieving a Good Level of Development in the EYFS. The table shows that 46% of pupils who met the expected standard in phonics decoding had achieved a Good Level of Development at the EYFS and 27% of pupils neither met the expected standard in phonics
[image:16.595.79.487.358.462.2]decoding nor reached a Good Level of Development in the EYFS. This shows that pupils who reached a Good Level of Development were more likely to meet the expected standard in phonics decoding than not. Conversely, those who did not reach a Good Level of Development were more likely not to meet the expected standard.
Table 3.2 Cross-tabulation of Phonics and Early Years Foundation Stage outcomes
Early Years Foundation Stage Did not Reach a Good
Level of Development
Reached a Good Level
of Development Total Phonics
Ph
o
n
ic
s Did not Meet the
Expected Standard 27% 14% 40%
Met the Expected
Standard 14% 46% 60%
Total EYFS 40% 60% 100%
Note: only pupils with both a valid EYFS result and phonics results have been included in this table and so the total may differ from national results.
17
18
3.4 Analysis of the relationship between the EYFS Profile and
Phonics Screening Check results
Two statistical approaches were used to investigate the relationship between the EYFSP and the phonics screening check results; correlation and regression.
3.4.1 Correlation
Correlation can be used to measure the strength of the statistical relationship between pupils’ EYFSP results and their phonics screening check score. Different components of the EYFSP can be considered separately. The components we are interested in are:
Early Years Foundation Stage Profile Total Point Score (which includes Communication, Language and Literacy)
Communication, Language and Literacy; which includes the following: 1. Language for Communication and Thinking
2. Linking Sounds and Letters 3. Reading
4. Writing
Correlations were estimated for other components of the EYFS and can be seen in Annex A. The Pearson Correlation Coefficient is used to calculate the correlation between the phonics screening check score and the EYFSP outcomes. The Pearson Correlation Coefficient is a value between -1 and 1 where a correlation of 1 or -1 shows a strong linear relationship between the two variables of interest. This means that if the correlation coefficient is close to 1 then there is a very strong positive relationship between the variables, and as one variable increases so does the other variable. If the correlation coefficient is zero there is no linear relationship between to the two variables and a change in one variable does not affect the outcome of the other.
19
Table 3.3 Pearson Correlation Coefficients between the phonics screening check outcome and components of the Early Years Foundation Stage Profile, 2012
Pearson Correlation Coefficient Early Years Foundation Stage Profile Total Point Score 0.60
Communication, Language and Literacy 0.64 Language for Communication and Thinking 0.45
Linking Sounds and Letters 0.64
Reading 0.60 Writing 0.62
Note: All coefficients were shown to be statistically significant at the 5% level
Table 3.3 shows that the correlation coefficient is highest for the linking sounds and letters assessment scale. This shows that this component of the EYFSP has the strongest relationship with pupils’ phonics screening check scores with a correlation coefficient of 0.64.
Another interesting result is that the association between the phonics screening check score and the writing assessment scale (0.62) is stronger than the association with the reading assessment scale (0.60).
While correlation can tell us about the strength of a relationship it does not take into account whether there is a third (or more than 3) variable that is the source of the relationship. To control for this we must use regression techniques.
3.4.2 Regression
Regression techniques were used to investigate the relationship between a pupils’ phonics
screening check outcome and the pupils’ characteristics and their EYFSP results. The result of the regression analysis will show two things; firstly, if attainment at the EYFS has a statistically
significant relationship with meeting the expected standard in phonics decoding and secondly, the odds of a pupil meeting the expected standard in phonics decoding. Other characteristics that have been controlled for in the regression model are:
Free School Meals Eligibility
Special Education Needs status
English as a first language
Ethnic Group
Gender
Month of Birth
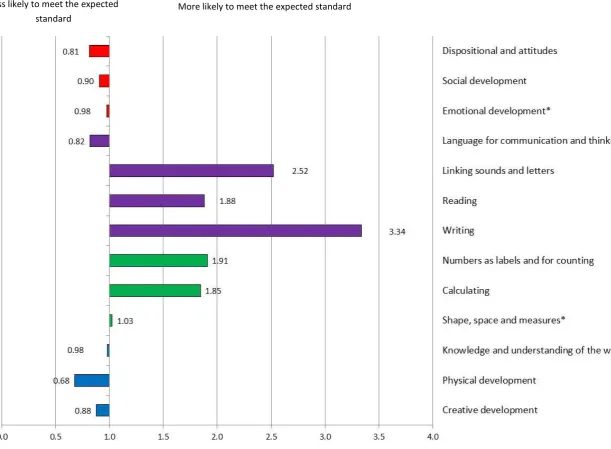
The effect of these characteristics can be seen in Annex B. Figure 3.2 below summarises the relationship between each assessment scale at the EYFS whether pupils met the expected
20 The chart shows that most of the assessment scales at the EYFS have a statistically significant relationship with pupils meeting the expected standard in phonics. The assessment scales that do not have a statistically significant relationship with meeting the expected standard in phonics decoding are emotional development, shape, space and measures and knowledge and understanding of the world.
The two assessment scales that are shown to have the largest influence on the phonics screening check are linking sounds and letters and writing. If a pupil has been shown to be working securely in linking sounds and letters assessment scale then they are 2.5 times more likely to meet the expected standard in phonics decoding than a pupil with the same characteristics who did not work securely within this assessment scale. Also, a pupil working securely in writing at the EYFS were 3.3 times more likely to meet the expected standard in phonics decoding than a pupil who did not work securely in writing but otherwise had the same characteristics.
Figure 3.2 also shows that some of the EYFS assessment scales have a negative effect on meeting the expected standard in phonics decoding, and pupils who are working securely within these assessment scales are less likely to meet the expected standard in the phonics screening check. This is the case for all components of the personal, social and emotional development scale. A possible explanation for this is that the benchmark for working securely within these assessment scales is lower for less academic pupils, who did not meet the expected standard in phonics decoding. However, there is no evidence to support this hypothesis
21
Figure 3.2 Effects of pupil characteristics on odds of meeting the expected standard in the phonics screening check, 2012
22
4 Key Stage 1 Performance and Participation in the Phonics
Pilot Check
Summary
Nearly all pupils that achieved the expected standard in the 2011 phonics pilot check went on to achieve the expected level in 2012 Key Stage 1 speaking and listening, reading and writing. 63% of these went on to achieve above the expected level in reading.
Higher percentages of pupils at schools included in the original representative pilot sample achieved above expected level at 2012 Key Stage 1 speaking and listening, reading and writing than pupils at opt in pilot schools.
Schools that were selected to participate in the 2011 phonics pilot check had on average a higher, positive Key Stage 1 Value Added score than all schools, but regression analysis found the effect of selection for phonics pilot participation and not have a significant effect on Key Stage 1 performance.
4.1 Introduction
Pupils attending schools that participated in the phonics pilot check in 2011 reached the end of Key Stage 1 in 2012. This means that data is available to consider their performance following the phonics screening check, and indeed the 2011 phonics pilot check. Section 4.2 considers the pupil level relationship between levels attained in reading, writing and mathematics at Key Stage 1 in 2012 and phonics pilot check outcomes.
To attempt to isolate the effects of these phonics checks on performance at Key Stage 1, it is essential to account for pupils’ prior attainment at the Early Years Foundation Stage (EYFS). The use of Value Added scores allows this. Value Added is the calculation used to assess a pupil’s attainment accounting for their prior attainment, and is aggregated up to school level allowing comparison. Section 4.3 considers school level Value Added scores between EYFS and Key Stage 1 in 2012, splitting schools by 2011 phonics pilot status4.
This section of the topic note considers:
The levels reached at 2012 Key Stage 1 speaking and listening, reading and writing for
pupils according to their 2011 phonics pilot outcome.
Average school level EYFS to Key Stage 1 Value Added in 2012, and the effect of pilot participation on Key Stage 1 performance.
4
23
4.2 The 2011 phonics pilot check
Before the phonics screening check was implemented in 2012, it was piloted in the summer term of 2011 at some 296 schools. 18 different checks of the phonics pilot check comprising different words (or pseudo words) were trialled, with different checks being used at the same school. The expected standard mark differed across these 18 checks, as each check had different levels of difficulty. The form and expected standard for the 2012 phonics screening check was identical across all schools. Other changes in the organisation of the 2012 full roll out following the 2011 pilot included:
Inclusion of a picture of an imaginary creature next to each word rather than some non-words as in the pilot.
Provision of a greater number of words on the practice sheet
Schools were made aware of their participation at the start of the academic year whereas for the pilot, schools were only informed by the start of the term of the check.
The content of the 2012 check was provided to schools much earlier in the academic year than for pilot schools in 2011.
The expected standard of a score of 32 was set prior to the 2012 phonics screening check. No standard was set prior to the pilot.
Due to the above, results derived from this pilot check analysis can only be seen as indicative.
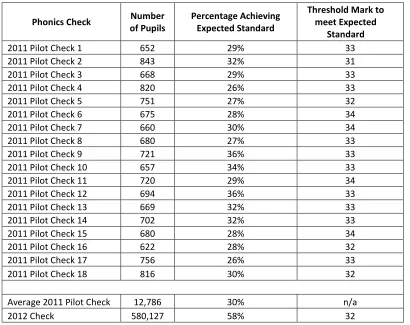
Table 4.1 displays the percentage of pupils achieving the expected standard for each of the 18 phonics pilot checks of 2011, as well as the same information across all pilot checks and the 2012 phonics screening check. However, the 18 checks had varying levels of difficulty, which is
24
Table 4.1 Average 2011 phonics pilot check and 2012 phonics screening check scores
Phonics Check Number
of Pupils
Percentage Achieving Expected Standard
Threshold Mark to meet Expected
Standard
2011 Pilot Check 1 652 29% 33
2011 Pilot Check 2 843 32% 31
2011 Pilot Check 3 668 29% 33
2011 Pilot Check 4 820 26% 33
2011 Pilot Check 5 751 27% 32
2011 Pilot Check 6 675 28% 34
2011 Pilot Check 7 660 30% 34
2011 Pilot Check 8 680 27% 33
2011 Pilot Check 9 721 36% 33
2011 Pilot Check 10 657 34% 33
2011 Pilot Check 11 720 29% 34
2011 Pilot Check 12 694 36% 33
2011 Pilot Check 13 669 32% 33
2011 Pilot Check 14 702 32% 33
2011 Pilot Check 15 680 28% 34
2011 Pilot Check 16 622 28% 32
2011 Pilot Check 17 756 26% 33
2011 Pilot Check 18 816 30% 32
Average 2011 Pilot Check 12,786 30% n/a
2012 Check 580,127 58% 32
4.3 Key Stage 1 attainment by pupils according to their phonics pilot
check score
Table 4.2 on the following page considers the percentages of pupils achieving the expected and above expected level in reading, speaking and listening and writing at Key Stage 1 in 2012
according to their 2011 phonics pilot check outcome. For comparison, the final column shows the percentages for all pupils regardless of whether their school participated in the 2011 pilot check. The tables show that nearly every pupil that attained the expected standard in the phonics pilot check went on to achieve the expected level at Key Stage 1 for each subject considered. There was variation between subjects when considering the percentages of pupils that attained the expected standard in the phonics pilot checks who then achieved above the expected level at Key Stage 1: 46% for speaking and listening, 63% for reading and 36% for writing. Interestingly, these percentages are lower for each subject in opt-in schools, compared to ones included in the
representative sample.
26
Table 4.2 Percentages of Pupils who met the Expected and Above Level in 2012 Key Stage 1 speaking and listening, reading and writing by 2011 Phonics Pilot outcome
2011 Phonics Pilot Schools Representative Sample Pilot Schools Opt-In Pilot Schools All Schools
Outcome Key Stage 1 Assessment
Achieved Expected Standard
Did not achieve Expected Standard
Achieved Expected Standard
Did not achieve Expected Standard
Achieved Expected Standard
Did not achieve Expected Standard Speaking
and Listening
Achieved Expected Level 99% 86% 99% 87% 97% 82% 88%
Achieved Above Expected Level 47% 13% 47% 14% 45% 12% 22%
Reading Achieved Expected Level 100% 85% 100% 85% 100% 84% 87% Achieved Above Expected Level 63% 14% 65% 14% 58% 12% 27%
27
4.4 Value Added for phonics pilot participating schools
Table 4.3 displays average school level Value Added scores in 2012 for all schools and schools who were selected in the 2011 phonics pilot check sample (excluding schools who opted in the pilot check). Value Added is derived from pupils’ average score in reading, writing and
[image:27.595.40.411.214.263.2]mathematics at Key Stage 1 in 2012, accounting for their prior attainment measured by the EYFSP total score. The results show that the representative sample schools had, on average, a positive Value Added score and for all schools nationally, the average score is zero.
Table 4.3 Average School Level EYFS to Key Stage 1 Value Added Score, 2012 Number of Schools 2012 Value Added Score Representative Sample Pilot Schools 230 0.6
28
5 Pupils on the borderline of meeting the expected standard
in phonics decoding
Summary
The national distribution of scores in the 2012 phonics screening check shows a spike at the threshold of meeting the expected standard, suggesting that pupils on the borderline may have been marked up.
By removing pupil scores around the spike and using regression techniques, it is estimated that 46% of pupils would meet the expected standard if there was not a spike at the
borderline.
5.1 Introduction
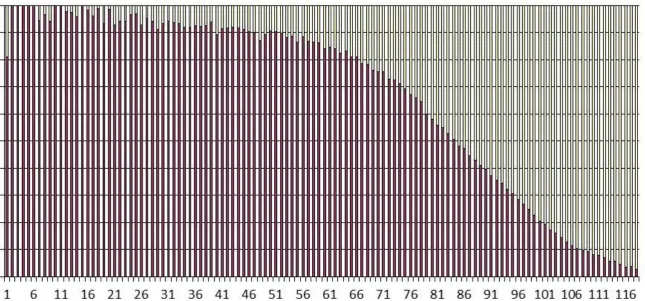
This chapter explores the national distribution of the 2012 phonics screening check scores. The national distribution suggests that many pupils who were on the boundary of meeting the expected standard may have been marked at the expected standard. This chapter estimates the percentage of pupils who would meet the expected standard in phonics if there was not a spike at the
threshold of 32.
5.2 National distribution of the phonics screening check
29
Figure 5.1 National distribution of the phonics screening check score, 2012
5.3 Modelling results without the spike at the expected standard on
phonics decoding
Due to the spike at 32, it is possible that the distribution shown in Figure 5.1 may not truly reflect the national distribution. As mentioned previously, the national distribution of scores suggests that pupils on the borderline may have been marked up to meet the expected standard. To estimate how the national distribution would look if there was not a spike, we have removed all results for pupils with a mark between 26 (where the trend starts to change and the rate of increase in the number of pupils achieving that score starts to slow down) and 35 (where the number of pupils achieving that score starts to increase following the spike). Between this range we then interpolate the distribution, which is reflected both and after the spike. It is important to note that this method makes a number of assumptions and so should only be seen as indicative.
30
Figure 5.2 National distribution of the phonics screening check score – actual and modelled, 2012
5.4 Logistic regression without the spike at the expected standard in
phonics decoding
The method shown in Section 5.3 relies on a number of assumptions about the distribution of scores. A more statistically robust approach in estimating the percentage of pupils who met the expected standard in phonics decoding would be to use regression techniques. In section 3.4.2 we used logistic regression to look at the effect of a number of pupil characteristics on meeting the expected standard in phonics decoding. By removing pupils on the borderline and repeating the logistic regression analysis, it is possible to see what effect pupil characteristics have on meeting the required standard for pupils not on the borderline. This will mean that the new regression will explain the effect of pupil characteristics for pupils who have clearly not met the expected standard or have clearly met the required standard.
The new pupil characteristic effects can then be applied to the borderline pupils to estimate the probability of each pupil meeting the expected standard. If the probability of a pupil passing is more than 50% we can assume that they are at the expected standard in phonics decoding. However, if a pupil’s probability of meeting the expected standard is less than 50% then we assume that they are not at the expected standard in phonics.
The results of this analysis estimates that 46% of Year 1 pupils are at the expected standard in phonics decoding in 2012.
31
Annex A – Correlation between Early Years Foundation
Stage Profile and the phonics screening check scores
[image:31.595.68.503.174.438.2]The table below shows the Pearson Correlation Coefficient values for the phonics screening check scores and each assessment scale of the EYFS Profile.
Table A.1 Correlation between the phonics screening check scores and each assessment scale of the EYFS Profile
EYFS Assessment Scale Pearson Correlation Coefficient
EYFS Total Point Score 0.60
Personal, social and emotional development 0.44
Dispositions and attitudes 0.43
Social development 0.39
Emotional development 0.40
Communication, language and literacy 0.64
Language for communication and thinking 0.45
Linking sounds and letters 0.64
Reading 0.60
Writing 0.62
Problem and solving, reasoning and numeracy 0.59
Numbers and labels and for counting 0.56
Calculating 0.39
Shape, space and measures 0.50
Knowledge and understanding of the world 0.42
Physical development 0.40
32
Annex B - Logistic Regression Model Coefficients for the
relationship between the Early Years Foundation Stage
Profile and meeting the required standard in phonics
decoding
[image:32.595.59.521.235.503.2]Table B.1 below shows the model coefficients for the Early Years Foundation Stage Profile in predicting the probability of a pupil meeting the required standard in phonics with associated confidence limits and odds ratios. Table B.2 shows the model coefficients for other pupil characteristics that were controlled for in the model.
Table B.1 Early Years Foundation Stage Profile Logistic Regression Model Coefficients
EYFS Assessment Scale Coefficient
Lower Confidence Limit Upper Confidence Limit Odds Ratio
Working securely within creative development -0.13 -0.16 -0.11 0.88 Working securely within Physical development -0.39 -0.43 -0.36 0.68 Working securely within Knowledge and
understanding of the world*
-0.02 -0.05 0.01 0.98
Working securely within Shape, space and measures*
0.03 0.00 0.05 1.03
Working securely within Calculating 0.61 0.59 0.64 1.85 Working securely within Numbers as labels and for
counting
0.65 0.61 0.68 1.91
Working securely within Writing 1.21 1.19 1.23 3.34 Working securely within Reading 0.63 0.61 0.66 1.88 Working securely within Linking sounds and letters 0.93 0.90 0.95 2.52 Working securely within Language for
communication and thinking
-0.20 -0.23 -0.17 0.82
Working securely within Emotional development* -0.02 -0.05 0.00 0.98 Working securely within Social development -0.10 -0.13 -0.07 0.90 Working securely within Dispositional and
attitudes
-0.21 -0.24 -0.17 0.81
33
Table B.2 Early Years Foundation Stage Profile Logistic Regression Model Coefficients for Pupil Characteristics
Pupil Characteristic Coefficient
Lower Confidence Limit Upper Confidence Limit Odds Ratio
Constant -1.34 -1.38 -1.30 0.26
Not Eligible for Free School Meals 0.00 1.00
Eligible for Free School Meals -0.36 -0.38 -0.34 0.70
First Language English 0.00 1.00
First Language Not English 0.09 0.06 0.13 1.10
Ethnicity - Bangladesh 0.57 0.50 0.64 1.77
Ethnicity - India 0.71 0.65 0.76 2.03
Ethnicity - Asian Other 0.74 0.68 0.80 2.09
Ethnicity - Pakistan 0.49 0.45 0.54 1.64
Ethnicity - Black African 0.60 0.56 0.65 1.82
Ethnicity - Black Caribbean 0.10 0.03 0.16 1.10
Ethnicity - Black Other 0.43 0.34 0.51 1.53
Ethnicity - Chinese 0.74 0.62 0.86 2.09
Ethnicity - Mixed Other 0.35 0.30 0.40 1.41
Ethnicity - Mixed White Asian 0.48 0.41 0.54 1.61
Ethnicity - Mixed White Black African 0.29 0.21 0.37 1.33 Ethnicity - Mixed White Black Caribbean* 0.04 -0.02 0.09 1.04 Ethnicity – Information Not Yet Obtained 0.16 0.04 0.28 1.17
Ethnicity - Other 0.44 0.37 0.50 1.55
Ethnicity - Refused 0.23 0.13 0.32 1.25
Ethnicity - White British 0.00 1.00
Ethnicity - White Irish 0.20 0.07 0.33 1.22
Ethnicity - White Irish Traveller -0.82 -1.15 -0.50 0.44
Ethnicity - White Other 0.27 0.23 0.31 1.31
Ethnicity - White Romany Gypsy -0.96 -1.13 -0.79 0.38
Male 0.00 1.00
Female -0.02 -0.04 -0.01 0.98
No SEN 0.00 1.00
SEN - Action -0.96 -0.99 -0.93 0.38
SEN - Action Plus or Statemented -0.98 -1.02 -0.93 0.37
Did not attend a Pilot School 0.00 1.00
Did attend a Pilot School (Representative)* -0.01 -0.14 0.12 0.99
Month of Birth -0.03 -0.03 -0.03 0.97
© Crown copyright May 2013
Ref: DFE–RR287
ISBN:
You may re-use this information (excluding logos) free of charge in any format or medium, under the terms of the Open Government Licence. To view this licence, visit
http://www.nationalarchives.gov.uk/doc/open-government-licence/ or e-mail:
Where we have identified any third party copyright information you will need to obtain permission from the copyright holders concerned.
The views expressed in this report are the authors’ and do not necessarily reflect those of the Department for Education.
Any enquiries regarding this publication should be sent to us at Lucy Townley, Level 4, Sanctuary Buildings, Great Smith Street, London, SW1P 3BT Email:[email protected] This document is also available from our website at: