This is a repository copy of The development of risky attitudes from pre-driving to fully-qualified driving.
White Rose Research Online URL for this paper: http://eprints.whiterose.ac.uk/95099/
Version: Accepted Version
Article:
Rowe, R., Maughan, B., Gregory, A.M. et al. (1 more author) (2013) The development of risky attitudes from pre-driving to fully-qualified driving. Injury Prevention, 19 (4). pp. 244-249. ISSN 1353-8047
https://doi.org/10.1136/injuryprev-2012-040551
eprints@whiterose.ac.uk Reuse
Unless indicated otherwise, fulltext items are protected by copyright with all rights reserved. The copyright exception in section 29 of the Copyright, Designs and Patents Act 1988 allows the making of a single copy solely for the purpose of non-commercial research or private study within the limits of fair dealing. The publisher or other rights-holder may allow further reproduction and re-use of this version - refer to the White Rose Research Online record for this item. Where records identify the publisher as the copyright holder, users can verify any specific terms of use on the publisher’s website.
Takedown
If you consider content in White Rose Research Online to be in breach of UK law, please notify us by
31 October 2012 1
2
The development of risky attitudes from pre-driving to fully-qualified driving 3
4
Richard Rowe1, Barbara Maughan2, Alice M. Gregory3 & Thalia C. Eley2 5
6
1
Department of Psychology, University of Sheffield, U.K. 7
2King’s College London, Institu
te of Psychiatry, MRC Social Genetic and Developmental 8
Psychiatry Centre, U.K. 9
3Department of Psychology, Goldsmith’s, University of London, U.K.
10
11
Please address correspondence to: 12
Richard Rowe, Department of Psychology, University of Sheffield, Western Bank, Sheffield, 13
S10 2TP. UK. 14
Tel: +44(0)1142226606 Fax: +44(0)1142766515 15
E-mail: r.rowe@sheffield.ac.uk 16
Running title: Driving attitudes across training 17
Keywords: Young drivers, attitudes, risk, driving violations 18
19
Word count: 3436 20
21
ABSTRACT 1
Objective: Young drivers are at increased crash risk as a result of adopting risky driving 2
styles. This paper examines the development of risky attitudes from pre-driving to fully qualified 3
driving, focussing on speed related attitudes. 4
Design: Data are drawn from a UK longitudinal study of adolescent behaviour 5
development in the general population (the G1219 study). 6
Subjects: At baseline (modal age 17 years) there were 1596 participants only 18% of 7
whom were fully qualified drivers. At follow-up (modal age 20 years) 64% were fully qualified 8
drivers. 9
Main Outcome measures: Attitudes to driving violations, particularly speeding, were 10
measured in all participants at both assessments. Self-reported driving violations, also related to 11
speeding, were measured in fully qualified drivers at follow-up. 12
Results: Attitudes became riskier with driver training/experience. Baseline attitudes 13
measured in pre-drivers did not independently predict violations in those that had become fully-14
qualified drivers at follow-up. The attitudes of learner and fully qualified drivers at baseline 15
independently predicted violations at follow-up. 16
Conclusions: These results indicate that the driver training period offers a promising 17
opportunity for interventions to develop safer driving attitudes. 18
WHAT IS ALREADY KNOWN 1
Risky attitudes and behaviours are linked to crash involvement in young drivers 2
Risky attitudes may develop during the pre-driving period 3
4
WHAT THIS STUDY ADDS 5
Attitudes to violations focussing on speed become riskier during driver training 6
Attitudes in pre-drivers do not independently predict risky driving behaviour 3 years later 7
Attitudes in learner drivers do predict risky driving 3 years later 8
9
Road traffic crashes provide a major public health challenge. In 2010 there were 1,850 fatalities 1
on UK roads and 22,690 serious injuries.(1) Young drivers, particularly males, are over-2
represented in many crash types(2). For example adolescent drivers (aged 15-19 years) were 3
more vulnerable to single vehicle fatalities than adults aged 45-64 (odds-ratio =1.64 for males 4
and 1.45 for females) in the US, 2005-2009(2). Inexperience performs a role here(3), with faulty 5
risk and hazard perception likely to be involved.(4) However, choice of risky behaviours such as 6
speeding and dangerous overtaking, is also important.(5-9) 7
The antecedents of risky driving can be found before fully qualified driving begins. In the 8
UK pre-drivers include people with no licence, who are prohibited from driving on public roads 9
and those who hold a provisional licence (available from age 17) allowing supervised driving 10
(learners). Drivers become fully qualified on completion of the UK driving test that can be taken 11
from age 17, with no minimum period holding a provisional licence. Longitudinal studies 12
showing adolescent behavioural difficulties predict driving risk(10) show that characteristics 13
present before training begins influence driving behaviour. Further evidence shows driving 14
attitudes have similar correlates in pre-drivers and full licence holders.(11) 15
Pre-driving is an attractive period for intervention as attitudes may be more malleable 16
before habits form.(12) If driving experience results in attitude change then interventions may be 17
targeted at key points to prevent negative changes and accentuate positive ones. A full 18
understanding of attitude development across training is required to target interventions most 19
effectively. Risky driving becomes more frequent as novice drivers gain experience(9) and this 20
effect may begin when experience starts to accrue during training. Not all studies find an effect 21
of experience prior to fully licensed driving(12, 13) However, one unpublished study indicates 22
drivers than in learners and riskier in learners than non-drivers (Rowe, Andrews & Harris, 1
manuscript submitted). This unpublished study also found that a measure of willingness to 2
commit a wider range of violations showed the opposite relationship with driving experience. 3
Therefore further studies are required to clarify the relationship between driving experience and 4
attitudes during pre-driving. 5
A further issue in effectively delivering interventions is to target stages where attitudes 6
optimally predict future behaviour. For example, learner drivers’ attitudes might predict later 7
behaviour more accurately than non-drivers’ attitudes as training experience may have already 8
started to shape attitudes. One study found a correlation of .28 between pre-driver speeding 9
attitudes and risky driving behaviour 12 months later.(13) This study did not test whether 10
prediction of future behaviour was similar for non-drivers and learner drivers at baseline. 11
We address the development of driving attitudes across training in a UK cohort 12
study.(15) We use the attitudes to driving violations scale(14) as our primary attitudes measure. 13
As noted above, this scale focuses primarily on speed which is a key contributor to crash 14
involvement.(16) First we examine whether this measure changes with driving experience, using 15
cross-sectional and longitudinal analyses. Second, we examine the longitudinal prediction from 16
attitudes to behaviour, testing whether the strength of the relationship varies depending upon 17
baseline driving experience. Given that males are riskier drivers than females(9), we test whether 18
identified associations were moderated by sex throughout our analyses. 19
METHODS 20
Study population 21
National Statistics. Sample recruitment and retention is fully described elsewhere.(17) At wave 1 1
3,640 respondents aged 12 to 19 years participated. Wave 3 (collected in 2004) was the first 2
contact to include driving measures and is referred to as the baseline here. This wave contained 3
1,596 adolescents (44% of the Wave 1 sample) with modal age 17 years (range 14-23) and 60% 4
were female. The next contact (Wave 4, referred to here as the follow-up) was conducted 5
approximately 3 years later (2007) and there were 1,556 participants (including 74% of wave 3 6
respondents as well as additional study members who had participated at wave 2 but not at wave 7
3). At this point the modal age was 20 years (range 18-27 years). Informed consent was obtained 8
from parents/guardians of all study members under 16 years, and from study members 9
themselves when over 16. Ethical approval for different stages of this study has been provided by 10
the Research Ethics Committees of the Institute of Psychiatry, South London and Maudsley NHS 11
Trust, and Goldsmiths, University of London. At wave 1, levels of parental education were 12
somewhat higher (39% educated to A-level [US equivalent High School Diploma] or above) 13
than in a large nationally represented sample of parents where 32% were educated to this level. 14
Throughout the study, loss to follow up was associated with being male, higher on antisocial 15
behaviour, living in rented accommodation and lower maternal education. 16
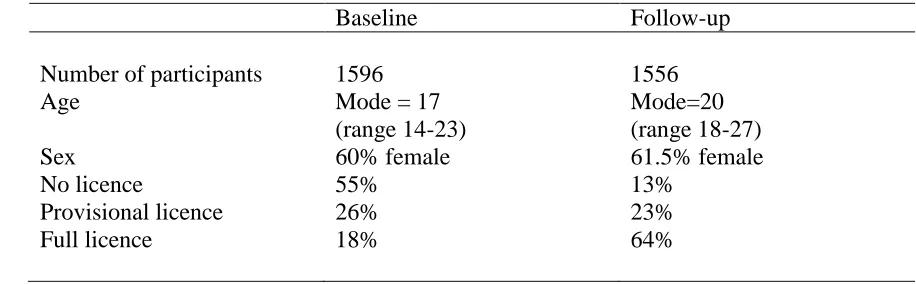
The characteristics of the sample at baseline and follow-up contacts are shown in Table 1 17
including the distribution of driving licences at each stage. At follow-up, fully-qualified drivers 18
reported that they had held their licence for 2.69 years (sd=1.88) on average and their weekly 19
mileage was most commonly reported as 1-50 miles (39%), with 51-100 miles (25%) next most 20
common. 21
<Table 1> 22
Attitudes to Driving Violations 1
The Attitudes to Driving Violations Scale(14) was presented to all participants at baseline 2
and follow-up. Items are shown in Table 2. Responses are made on a 5-point scale labelled 3
Strongly Disagree (scoring 5) to Strongly Agree (scoring 1). The scale is usually scored as the 4
total of the 7 items providing a potential range of 7-35 with higher scores indicating riskier 5
attitudes. The original validation study recruited a sample of 406 drivers and found the scale had 6
a Cronbach’s alpha of .76 and correlated with self-reported speeding and crash involvement.(14) 7
In our sample, alpha reliabilities were .72 at both baseline and follow-up. 8
<Table 2> 9
Driving Behaviour 10
Driving violations were measured at follow-up in fully qualified drivers using items from 11
the ordinary violations sub-scale of the Driver Behaviour Questionnaire (DBQ).(18) The 12
questionnaire addresses violation frequency during the previous year on a 6-point scale ranging 13
from never (scoring 0) to nearly all the time (scoring 5).(5) A recent meta-analysis including 70 14
DBQ studies found a correlation of .13 between violations and crash involvement.(9) This study 15
also reported new analyses of a large-scale UK sample of novice drivers showing DBQ 16
violations measured at 6 months after licensing correlated with crash history at .15 and predicted 17
future crash involvement over the next 6 (r=.14), 18 (r=.14) and 30 (r=.12) months.(9) Space 18
restrictions in the G1219 mail-out meant only four of the usual seven items were included. These 19
were chosen as the strongest loading items in a factor analysis based on a large UK sample(19) 20
and they showed good alpha reliability (.73) in our sample. The DBQ is usually scored as the 21
At follow-up, drivers were also asked the date they obtained their full licence and to 1
report their usual weekly mileage as 0, 1-50, 51-100, 101-200 or 200+. Mileage was treated as a 2
continuous variable, scored 0 to 4. 3
Analyses 4
The G1219 sample contains sibling pairs of differing genetic relatedness (identical twins, non-5
identical twins and full siblings) for the purpose of identifying genetic and environmental 6
contributions to variance in behavioural traits. The current analyses address relationships 7
between variables at the phenotypic level and therefore do not utilise the twin/family design. All 8
analyses were conducted using the survey models of Stata 10.1(20) which adjust results for the 9
non-independence of observations taken from the same family. These models are also robust to 10
minor violations of some of the usual regression assumptions, including the normality 11
assumption in linear regression. Linear regression models were used when predicting attitudes 12
and behaviours with licence status coded as a categorical predictor using dummy variables. 13
Within participants at each contact, missing data on the variables of interest was limited to 14
between .5% and 1.5% of cases. There were slightly more missing responses for duration licence 15
held (6%). Individuals without complete data on key variables were omitted from all analyses. In 16
order to use as much of the available data as possible, analyses at single time points included all 17
available participants irrespective of whether they participated at the other wave. Longitudinal 18
analyses required participants to be present at both time points. 19
RESULTS 20
Driving attitudes and behaviour 21
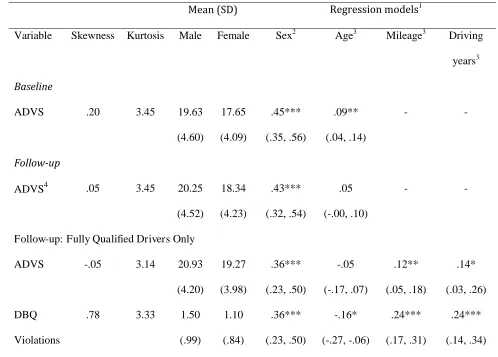
Table 3 shows descriptive statistics regarding the driving-related variables and their 22
significantly riskier in males than females and riskier attitudes were positively associated with 1
age at baseline but not follow-up. In fully qualified drivers riskier attitudes were associated with 2
higher mileage and with licence duration. Violations were more common in males than females, 3
negatively correlated with age and positively correlated with driving exposure. After controlling 4
for the effects of age, sex and driving exposure, riskier attitudes were associated with more 5
frequent violations (=.43, 95% CI: .36, .49, p<.001). 6
Are driving attitudes associated with licence status? 7
Figure 1 shows mean attitude scores at each licence stage. We conducted regression 8
models predicting standardised attitudes from licence status (coded with dummy variables), 9
controlling for age and sex. At baseline, fully qualified drivers had riskier attitudes than non-10
drivers (b=.59, 95% CI: .41, .76, p<.001)and learner drivers (b=.36, 95% CI: .20, .52, p<.001). 11
Learners had significantly riskier attitudes than non-drivers (b=.23, 95% CI: .09, .36, p=.001).An 12
additional interaction term between licence status and sex was non-significant (F(2, 860)=.00 13
p=.998). 14
We repeated the analysis using the follow-up data and found the interaction between sex 15
and licence status was significant (F(2, 890)=3.46, p=.032). In males the pattern was similar to 16
baseline: fully qualified drivers reported riskier attitudes than non-drivers (b=.75, 95% CI: .49, 17
1.00, p<.001) and learner drivers (b=.33, 95% CI: .10, .56, p=.005), and learners had riskier 18
attitudes than non-drivers (b=.42, 95% CI: .11, .72, p=.008). For females, fully licenced drivers 19
had riskier attitudes than non-drivers (b=.45, 95% CI: .27, .34, p<.001) and learners (b=.54, 95% 20
CI: .38, .70, p<.001) but there was no difference between learners and non-drivers (b=-.08, 95% 21
for, at baseline (=-.06, 95% CI: -.13, .01, p=.109) or follow-up (=.01, 95% CI: -.04, .06, 1
p=.710). 2
<Figure 1> 3
Do attitudes change as a result of training/experience? 4
These analyses focussed on the 659 non-drivers at baseline. Of these participants 323 had 5
become fully qualified drivers at follow-up, 199 were learning to drive and 137 remained non-6
drivers. As shown in Figure 2, attitudes became riskier in those who became fully qualified 7
drivers between baseline and follow-up (Cohen’s D=.33). There was no evidence of change in 8
those who remained non-drivers (D=.01) or began learning to drive (D=.11). Controlling for age 9
and sex, there were no differences in baseline attitudes between participants who did not learn to 10
drive before follow-up and those that began learning to drive or became fully qualified before the 11
follow-up assessment (F(2, 420)=.45 p=.636). Significant differences only emerged at follow-up 12
(F(2, 420)=8.94, p<.001). In order to test whether learning to drive between baseline and follow-13
up predicted change in attitude, we ran a regression model predicting standardised follow-up 14
attitudes with licence status at wave 4 (coded with dummy variables), controlling for baseline 15
attitude, age and sex. In this model those who learnt to drive had significantly riskier attitudes at 16
follow-up than participants who remained non-drivers (b=.34, 95% CI: .15, .54, p=.001) and 17
participants who had started training but not completed it (b=.29, 95% CI: .13, .45, p<.001). The 18
comparison of those who remained non-drivers and those who had begun driver training was 19
non-significant (b=.06, 95% CI: -.15, .26, p=.593). An additional interaction term between sex 20
and licence status was non-significant (F2, 420)=1.22, p=.300), indicating the effect of learning 21
the hypothesis that driving experience influences attitudes rather than that those with riskier 1
attitudes start to drive earlier. 2
<Figure 2> 3
The above analyses did not indicate whether change in attitudes happened immediately 4
after gaining a full licence or gradually with the acquisition of experience. Next we examined 5
whether attitudes were linearly related to the time since qualifying to drive at follow-up. The 6
zero-order correlation between attitudes and time since acquiring a full licence was .13 (p<.001). 7
Mean attitude scores were 18.74 (SD=4.17) for participants in their first year of fully qualified 8
driving, 19.61 (SD=4.06) in the second year and 20.45 (SD=4.10) in the third year and beyond. 9
Therefore it appears there was a linear relationship between driving experience and attitude. 10
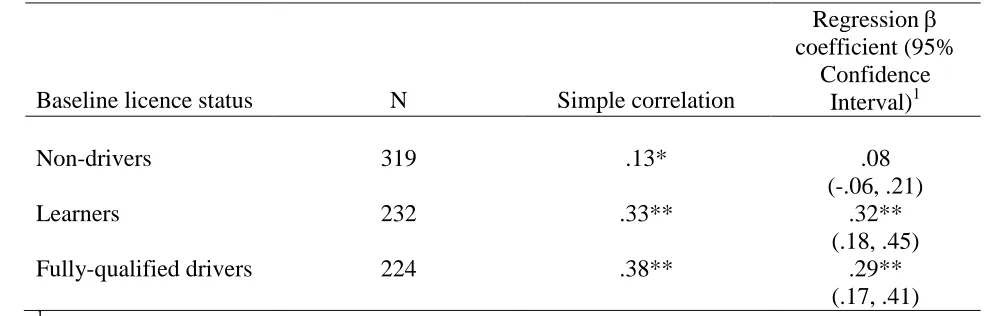
Do pre-licence attitudes predict fully qualified driving behaviour? 11
We tested the longitudinal prediction of violations from attitudes using only fully 12
qualified drivers at follow-up (N=775). Table 4 shows that these participants were most 13
commonly non-drivers at baseline (41%), 30% were learners and 29% were fully qualified 14
drivers. As Table 4 shows, violations were more strongly correlated with the prior attitudes of 15
full and provisional licence holders than they were with non-licence holders. We ran a multiple 16
regression model predicting violations from baseline attitudes, licence status, and their 17
interaction. Sex, age and regular mileage were also included as covariates1. The model showed a 18
significant interaction between baseline licence status and attitude (F(2, 519)=3.55 p=.029). As 19
shown in Table 4, attitudes significantly predicted violations in those who were fully qualified 20
baseline. Sex did not moderate the prediction of violations from baseline attitudes in non-drivers 1
(p=.586), learners (p=.689) or fully qualified drivers (p=.223). 2
<Table 4> 3
DISCUSSION 4
G1219 provides a unique opportunity to study the development of driving attitudes from 5
pre-driving to fully-qualified driving in a large general population sample. We found driving 6
attitudes were riskier in fully qualified drivers than in learners and non-drivers, independently of 7
age and sex at baseline and follow-up. Learners had riskier attitudes than non-drivers at baseline. 8
At follow-up learners were riskier than non-drivers in males but not females. The reasons for this 9
minor discrepancy between data collection waves are unclear. Further analyses did not identify 10
any other evidence that sex moderated prediction of attitudes and behaviour. Therefore, overall, 11
our results provide little evidence that the processes underlying risky driving differ substantially 12
by sex. . 13
The longitudinal design of G1219 allows us to examine the mechanisms underlying the 14
cross-sectional association we identified between licence status and risky attitudes. At baseline 15
there were no differences between those who would go on to gain driving experience in the 16
follow-up period and those who would not. Attitudes became riskier in those who became fully 17
qualified drivers between baseline and follow-up whereas there was no change in attitudes for 18
those who remained non-drivers or had become learners at follow-up. These analyses indicate 19
that attitudes become riskier with experience rather than that people with riskier attitudes learn to 20
drive earlier. 21
It may be that the development of riskier attitudes with driving experience is specifically 22
Driving Violations Scale(14) and licence status has been observed elsewhere (Rowe, Andrews & 1
Harris, submitted), but a different pattern of results was reported for a measure addressing 2
violations more widely. This does not diminish the importance of the results reported here, 3
however, given that driving speed is an important contributor to crash involvement.(16) Our data 4
do not directly address why attitudes become riskier with experience. One possibility is that 5
confidence in the ability to handle speed and experience of the relatively forgiving nature of the 6
road environment makes drivers feel that speeding is less risky than they thought initially. 7
Our findings regarding longitudinal prediction of violations from attitudes also indicate 8
that attitudes change with training and experience. In learners and fully qualified drivers at 9
baseline there was significant prediction from attitudes to violation behaviour at follow-up. In 10
non-drivers at baseline who became fully qualified drivers before follow-up, the prediction from 11
attitudes to behaviour was not independently significant. We are aware of only one other 12
longitudinal study that has predicted driving behaviour from pre-driving attitudes. This study did 13
find a correlation between attitudes in pre-drivers and their driving behaviour over a one year 14
period(13) rather than the three year follow-up of our study. A key strength of our study is the 15
comparison of prediction of violations from attitudes at different baseline stages of driver 16
training. Our results show that prediction is stronger in those who are currently driving and in 17
learners than in non-drivers and this has implications for injury prevention initiatives as 18
discussed below. 19
Our results must, however, be considered in the context of some limitations. The 20
retention of participants from baseline to follow-up was incomplete, as is inevitable in studies of 21
measures of this sort have been well validated in comparison with performance data.(9) It would 1
be helpful for replications to include measures from other reporters who are familiar with the 2
participants’ driving behaviour and also take more objective measures of risky driving behaviour 3
such as criminal and medical records. 4
Implications for prevention 5
The high costs associated with risk-taking in young drivers makes developing 6
preventative measures a priority. This might involve a range of different approaches including 7
tougher legislation for violating motoring laws and graduated licensing programmes to reduce 8
unsupervised driving during the early stages of novice driving. Interventions aiming to improve 9
attitudes and behaviour in young drivers are likely to continue to perform a central role in these 10
efforts, in part due to their public acceptability and relatively small cost. Our findings have 11
implications for identifying the best developmental stage in which to target such interventions. 12
We found that attitudes only predict driving behaviour independently when driver training has 13
begun. This has implications for the utility of targeting non-drivers with attitude 14
interventions.(11) As the attitudes of non-drivers were not independently predictive of violations 15
during fully qualified driving it seems less plausible that manipulating non-drivers’ attitudes will 16
modify future driving behaviour. This study did not manipulate attitudes directly however. We 17
believe randomised control trials of the effectiveness of non-driver attitude modification remain 18
a priority for future research. In the absence of this evidence, our results offer a cautionary 19
message to organisations considering investing in non-driver attitude training. 20
Our results indicate that the learner driver stage (as indexed by a provisional licence in 21
the UK) provides the most promising stage in which to foster safer driving attitudes. This period 22
those involving speed. Variation in the amount and type of driver training received and the 1
number of driving tests failed may have implications for individual differences in this trajectory. 2
Interventions that could prevent this change may be particularly helpful, given that we found the 3
attitudes of learners predicted future driving behaviour. Driving instructors and supervising 4
adults may already be trying to develop safer attitudes in their pupils at this stage, and our data 5
are not able to quantify this, or evaluate its effectiveness. While more recent models of driver 6
education emphasise tuition regarding risky driving style as well as driving skills(21), it is 7
possible that most UK training is too focussed on the control and higher order driving skills that 8
will be formally assessed at the expense of developing safer driving attitudes. A focus on skills 9
may contribute to the development of riskier attitudes as training control skills can lead to over-10
confidence(22). While interventions to improve driving behaviour often met with little success in 11
the past(23), more recent theoretically-based approaches to improving driver risk taking have 12
shown promise in small scale trials(24). Some approaches to skills training have also shown 13
benefits for reducing riskiness.(25, 26) All of these approaches to attitude improvement may be 14
best targeted during the learning phase as risk-taking behaviours may be more malleable before 15
habits are formed during independent driving. It is also possible that education designed to 16
improve attitudes during driver training may be most effective in the context of an integrated 17
programme including pre-driving education. Further research must address this possibility. 18
Targeting attitudes during driver training also has some practical advantages. Attendance 19
at attitude-training courses may become a formal requirement for licensing. Driving tests also 20
offer the opportunity to select people for licencing based on their attitude. Implicit attitude 21
ACKNOWLEDGEMENTS 1
Waves 1-3 of the Genesis12-19 study were funded by the W T Grant Foundation, the University 2
of London Central Research fund and a Medical Research Council Training Fellowship and 3
Career Development Award to TCE. Wave 4 was supported by grants from the Economic and 4
Social Research Council (RES-000-22-2206) and the Institute of Social Psychiatry awarded to 5
AMG. AMG is currently supported by a Leverhulme Research Fellowship. We thank the 6
families for their participation as well as numerous staff and students from the Social Genetic 7
Developmental Psychiatry Centre, Institute of Psychiatry, London and Goldsmiths, University of 8
London. 9
CONTRIBUTORSHIP STATEMENT 1
2
All authors made a substantial contribution to study conception and design, to data acquisition, to 3
analysis and interpretation of data and to drafting and revising the article. All authors provided 4
approval of the final version of the manuscript. 5
COMPETING INTERESTS 1
2
REFERENCES 1
1. Department for Transport. Reported Road Casualties Great Britain: 2010. London 2011. 2
2. Bingham CR, Ehsani JP. The relative odds of involvement in seven crash configurations 3
by driver age and sex. The Journal of adolescent health. 2012;51(5):484-90. 4
3. Groeger JA. Youthfulness, inexperience, and sleep loss: the problems young drivers face 5
and those they pose for us. Injury Prevention. 2006;12:19-24. 6
4. Deery HA. Hazard and risk perception among young novice drivers. Journal of Safety 7
Research. 1999 Win;30(4):225-36. 8
5. Parker D, Reason JT, Manstead ASR, Stradling SG. Driving Errors, Driving Violations 9
and Accident Involvement. Ergonomics. 1995 May;38(5):1036-48. 10
6. Clarke DD, Ward P, Truman W. Voluntary risk taking and skill deficits in young driver 11
accidents in the UK. Accident Analysis And Prevention. 2005;37(3):523-9. 12
7. Fergusson D, Swain-Campbell N, Horwood J. Risky driving behaviour in young people: 13
prevalence, personal characteristics and traffic accidents. Aust N Z Publ Health. 2003 14
Jun;27(3):337-42. 15
8. Blows S, Ameratunga S, Ivers RQ, Lo SK, Norton R. Risky driving habits and motor 16
vehicle driver injury. Accident Analysis And Prevention. 2005;37(4):619-24. 17
9. de Winter JCF, Dodou D. The Driver Behaviour Questionnaire as a predictor of 18
accidents: A meta-analysis. Journal of Safety Research. 2010 Dec;41(6):463-70. 19
10. Woodward LJ, Fergusson DM, Horwood LJ. Driving outcomes of young people with 20
attentional difficulties in adolescence. Journal of the American Academy of Child and 21
11. Waylen AE, McKenna FP. Risky attitudes towards road use in pre-drivers. Accident 1
Analysis and Prevention. 2008;40(3):905-11. 2
12. Harre N, Brandt T, Dawe M. The development of risky driving in adolescence. Journal of 3
Safety Research. 2000;31(4):185-94. 4
13. Mann HN, Sullman MJM. Pre-driving attitudes and non-driving road-user behaviours: 5
Does the past predict future driving behaviour? In: Dorn L, editor. Driver Behaviour and 6
Training: Volume 3. Aldershot, UK: Ashgate; 2008. 7
14. West R, Hall J. The role of personality and attitudes in traffic accident risk. Applied 8
Psychology-an International Review-Psychologie Appliquee-Revue Internationale. 1997 9
Jul;46(3):253-64. 10
15. Eley TC, Liang HL, Plomin R, Sham P, Sterne A, Williamson R, et al. Parental familial 11
vulnerability, family environment, and their interactions as predictors of depressive symptoms in 12
adolescents. Journal of the American Academy of Child and Adolescent Psychiatry. 13
2004;43:298-306. 14
16. Aarts L, van Schagen I. Driving Speed and the Risk of Road Crashes: A Review. 15
Accident Analysis and Prevention. 2006;38(2):215-24. 16
17. McAdams T, Gregory AM, Rowe R, Zavos HMS, Barclay NL, Lau JYF, et al. The 17
Genesis 12–19 (G1219) Study: A Twin and Sibling Study of Gene–Environment Interplay and 18
Adolescent Development in the UK. Twin Research and Human Genetics. Published Online 19
First: 12 October 2012. 20
18. Reason JT, Manstead A, Stradling S, Baxter J, Campbell K. Errors and Violations on the 21
19. Lajunen T, Parker D, Summala H. The Manchester Driver Behaviour Questionnaire: a 1
cross-cultural study. Accident Analysis and Prevention. 2004 Mar;36(2):231-8. 2
20. StataCorp. Stata Statistical Software: Release 10.1. College Station, TX: Stata 3
Corporation; 2007. 4
21. Hatakka M, Keskinen E, Gregersen NP, Glad A, Hernetkoski K. From control of the 5
vehicle to personal self-control; broadening the perspectives to driver education. Transportation 6
Research Part F. 2002;5:201-15. 7
22. Gregersen NP. Young drivers' overestimation of their own skill - An experiment on the 8
relation between training strategy and skill. Accident Analysis and Prevention. 1996 9
Mar;28(2):243-50. 10
23. Ker K, Roberts IG, Collier T, Beyer FR, Bunn F, Frost C. Strong evidence that advanced 11
and remedial driver education does not reduce road traffic crashes or injuries. Cochrane Database 12
of Systematic Reviews. 2003. 13
24. Elliott MA, Armitage CJ. Promoting drivers' compliance with speed limits: Testing an 14
intervention based on the theory of planned behaviour. British Journal of Psychology. 15
2009;100:111-32. 16
25. Isler RB, Starkey NJ, Sheppard P. Effects of higher-order driving skill training on young, 17
inexperienced drivers' on-road driving performance. Accident Analysis and Prevention. 2011 18
Sep;43(5):1818-27. 19
26. McKenna FP, Horswill MS, Alexander JL. Does anticipation training affect drivers' risk 20
27. Greenwald AG, McGhee DE, Schwartz JLK. Measuring individual differences in implicit 1
cognition: The implicit association test. Journal Of Personality And Social Psychology. 2
1998;74(6):1464-80. 3
28. Greenwald AG, Poehlman TA, Uhlmann EL, Banaji MR. Understanding and Using the 4
Implicit Association Test: III. Meta-Analysis of Predictive Validity. Journal Of Personality And 5
Social Psychology. 2009;97(1):17-41. 6
7
8
Table 1. Characteristics of the sample at Baseline and Follow-up. 1
2
Baseline Follow-up
Number of participants 1596 1556
Age Mode = 17
(range 14-23)
Mode=20 (range 18-27)
Sex 60% female 61.5% female
No licence 55% 13%
Provisional licence 26% 23%
Full licence 18% 64%
Table 2. Items included in the driving measures. 1
2
Attitudes to Driving Violations Scale(14)
Decreasing the speed limit on motorways is a good idea
Even at night-time on quiet roads it is important to keep within the speed limit
Drivers who cause accidents by reckless driving should be banned from driving for life
People should drive slower than the speed limit when it is raining
Cars should never overtake on the inside lane even if a slow driver is blocking the outside
lane
In towns where there are a lot of pedestrians the speed limit should be 20 miles per hour
Penalties for speeding should be more severe
Violations from the Driver Behaviour Questionnaire(18)
Race away from traffic lights with the intention of beating the driver next to you
Overtake a slow driver on the inside
Disregard the speed limit on a motorway
Disregard the speed limit on a residential road
Table 3. Driving related measures: Distribution, sex differences and relationship with age and 1
driving experience. 2
Mean (SD) Regression models1
Variable Skewness Kurtosis Male Female Sex2 Age3 Mileage3 Driving
years3
Baseline
ADVS .20 3.45 19.63
(4.60) 17.65 (4.09) .45*** (.35, .56) .09** (.04, .14) - - Follow-up
ADVS4 .05 3.45 20.25
(4.52) 18.34 (4.23) .43*** (.32, .54) .05 (-.00, .10) - -
Follow-up: Fully Qualified Drivers Only
ADVS -.05 3.14 20.93
(4.20) 19.27 (3.98) .36*** (.23, .50) -.05 (-.17, .07) .12** (.05, .18) .14* (.03, .26) DBQ Violations
.78 3.33 1.50
(.99) 1.10 (.84) .36*** (.23, .50) -.16* (-.27, -.06) .24*** (.17, .31) .24*** (.14, .34)
ADVS=Attitudes to Driving Violations Scale DBQ =Driver Behaviour Questionnaire 3
1
Regression models predicting the driving variables from sex and age. Mileage and duration 4
licence held were also included in models constrained to include only fully qualified drivers. 5
2
b coefficient (and 95% confidence intervals) for male sex predicting standardised outcome 6
variables. 7
3
coefficients (and 95% confidence intervals) 8
4
Includes all participants irrespective of their licence status 9
*p<.05 **p<.01 ***p<.001 10
Table 4. Prediction of violations at follow-up from attitudes at baseline. Only participants with a 1
full licence at follow-up were included in these analyses. 2
Baseline licence status N Simple correlation
Regression coefficient (95%
Confidence Interval)1
Non-drivers 319 .13* .08
(-.06, .21)
Learners 232 .33** .32**
(.18, .45)
Fully-qualified drivers 224 .38** .29**
(.17, .41)
1
Model controls for age, sex and mileage. 3
*p<.05 **p<.001 4
Figure Legends. 1
Figure 1. Mean attitudes to violations scores for participants with different forms of driving 2
licence. Higher scores indicate riskier attitudes towards violations. Error bars show 95% 3
confidence intervals. 4
5
Figure 2. Development of attitudes to driving violations in non-drivers at baseline, grouped by 6