This is a repository copy of Finance sector wage growth and the role of human capital. White Rose Research Online URL for this paper:
http://eprints.whiterose.ac.uk/78153/
Monograph:
Lindley, J. and McIntosh, M. (2014) Finance sector wage growth and the role of human capital. Working Paper. SERPS (201400). Department of Economics, University of Sheffield ISSN 1749-8368
eprints@whiterose.ac.uk https://eprints.whiterose.ac.uk/ Reuse
Unless indicated otherwise, fulltext items are protected by copyright with all rights reserved. The copyright exception in section 29 of the Copyright, Designs and Patents Act 1988 allows the making of a single copy solely for the purpose of non-commercial research or private study within the limits of fair dealing. The publisher or other rights-holder may allow further reproduction and re-use of this version - refer to the White Rose Research Online record for this item. Where records identify the publisher as the copyright holder, users can verify any specific terms of use on the publisher’s website.
Takedown
If you consider content in White Rose Research Online to be in breach of UK law, please notify us by
Finance Sector Wage Growth and the role of Human
Capital
Joanne Lindley
Steven McIntosh
ISSN 1749-8368
Preliminary draft. Not to be quoted without permission of authors.
Finance Sector Wage Growth and the role of Human Capital.
Joanne Lindley* and Steven McIntosh**
December 2013
Abstract
Given the UK finance sector is one of the largest in the world, it provides the perfect setting for a study into the nature of the finance sector wage premium. We reveal the pervasiveness of this premium, across all sub-sectors of finance, and across all occupations within finance, and with the very highest rewards going to 40-49 year old men working in London. Moreover, the UK premium has continued to rise despite the recent financial crisis. Consequently, this study uses rich data from the UK to investigate potential explanations. We find that the financial sector is more skill intensive but also that financial sector workers have higher childhood test scores vis-à-vis non-finance workers. So we investigate to what extent these higher qualifications and higher cognitive skills can explain the financial pay differential. We then go on to consider whether the financial premium is a consequence of differences in job characteristics and thus whether technological change can explain the growth in the premium. While each of these factors has some role to play, we find that none can fully explain the wage premium found in the financial sector, which we find to be pervasive across 17 OECD countries, including the US. We therefore attribute to this to rent-sharing.
Keywords: wage inequality, financial services, cognitive skills, bonuses JEL Codes: J20, J31, I24
* Department of Management, Faculty of Social Science and Public Policy, King’s College London, Franklin-Wilkins Building, 150 Stamford Street, London, SE1 9NH, UK
**Department of Economics, University of Sheffield, 9 Mappin Street, Sheffield, S1 4DT, UK
1. Introduction.
Explaining wage growth in the UK financial sector has remained a relatively under-researched area in economics, despite receiving a lot of attention in the European media and the recent implementation of the Capital Requirements Directive capping banker’s bonuses at a maximum of one year of salary from 2014. Reed and Himmelweit (2012) loosely link the recent stagnation of UK wage growth to the increased importance of financial services in the aggregate profit share. Also Bell and Van Reenen (2010, 2013) document how high UK financial sector salaries are an important feature of growing wage inequality at the top end of the wage distribution. But there are few studies that seek to explain why the financial sector wage premium has risen so quickly and why it is now so high.
To get some idea of the extent of the labour market differences in finance vis-à-vis the rest of the economy, Figure 1 uses national taxation data collected by HMRC taken from the Survey of Personal Incomes (SPI) to plot employment shares and average annual earned income ratios for the financial sector relative to those for the whole private sector between 1997 and 2009.1 The finance employment share is relatively small and has remained fairly constant (and even fallen slightly) over time, from 0.057 in 1997 to 0.053 in 2009. But at the same time the financial sector earned income ratio is very large and has increased (from 1.81 in 1997 to 2.63 in 2009). This suggests that the average wage in the financial sector was almost three times as large as the average wage across the whole private sector in 2009. Consequently, the main aim of this paper is to try to explain this much larger, and increasing, wage premium in the financial sector. We do this by drawing upon existing theories and potential explanations from the available literature on more general labour market inequality.
It has been well documented that some countries, most notably the US and UK, experienced substantial growth in labour market inequality over the last two or three decades.2 This has led to an area of research investigating whether growing wage inequality can be explained through technological change. The basic idea is that the falling price of information technology has led to the substitution of routine labour for technology capital. As routine tasks tend to be performed in jobs situated in the middle of the job quality distribution,
1 The SPI public use data are only available up to 2009. Following Philippon and Reshef (2012) most of our
analyses excludes the public sector so that we focus specifically on explaining the private sector wage premium.
economies with access to information technology have witnessed decreasing employment shares in the middle of the earnings distribution. Consequently, employment has polarized into high paid and low paid jobs and inequality has risen.3 This process has become known as task-biased technological change (TBTC).4 Here routine tasks are thought to be substitutes, whilst non-routine tasks are thought to be complements with new technology.
Whilst the literature on inequality and TBTC spans a number of dimensions and now also a number of countries, there have been relatively few studies that focus specifically on the financial sector. One notable exception is the study by Philippon and Reshef (2012) who try to explain long-run wage growth in the US financial sector by looking for changes in relative skill intensity. They find that the US financial sector became more skill-intensive during the 1980s. However they also find that it was equally as skill-intensive in the 1930s and that the long–run skill intensity in the US financial sector therefore displayed a U shape. Moreover, after controlling for skills they still find significant financial sector wage differentials which they attribute to rent-sharing amongst financial sector workers. These rents are increasing in education levels. So again following the existing literature they investigate the role of technological change in explaining the more recent trends.
Philippon and Reshef (2012) find some evidence that TBTC played a role in explaining increasing financial wage differentials, since they find that financial occupations have become relatively less routine in terms of the tasks that workers perform and more complex in terms of the mathematical aptitude required. However, given the long-run U-shaped trend for skill intensity in the financial sector, coupled with the fact that technical change can only explain recent trends, they investigate whether financial deregulation has also been an important factor. They find that information technology played an indirect role facilitating recent innovation in financial products and services but also that financial deregulation in the 1980s stimulated innovation (and therefore also prior financial regulation in the 1940s stunted innovation) explaining increasing rents alongside increased financial risk.
In terms of UK evidence, Bell and Van Reenen (2010) document increasing ‘extreme’ wage inequality by focussing on the income growth of the top 5 percent of British workers between 3 See Katz and Murphy (1992), Autor, Katz and Kearney (2008) for the US and also Machin (2011) and Lindley
and Machin (2011) for Britain.
4
This concept was first introduced by Autor, Levy, and Murnane (2003) in their more refined treatment of skill biased technical change (SBTC). For a survey of the literature on SBTC see Katz and Autor (1999).
1998 and 2008. They find that 60 percent of the increase in this extreme wage inequality can be attributed to the growth in bonuses paid to workers in the financial sector. They suggest the existence of superstar effects5, since the dispersion of wages is higher in finance than in other sectors. In keeping with this idea, we investigate to what extent finance workers are paid more because they are better qualified or have better cognitive skills. This is related to, but not exactly the same as, superstar effects since we do not focus solely on chief executive pay. We also look for evidence of TBTC by looking at whether there are differences in the non-routine task inputs of finance sector workers.
To preview our results, despite the recent financial crisis we show that the UK financial wage premium has continued to rise. This premium is received by finance workers across all sub-sectors, occupations and across the whole pay distribution. Moreover, we find that the UK financial sector has become more skill intensive and that finance sector workers have higher adult numeracy scores as well as higher childhood mathematics and reading test scores, on average, compared to non-finance sector workers. However, these differences cannot explain all of the high level, or the increase in, finance sector wages. We thus find evidence of unexplainable rents, even after conditioning on these childhood cognitive skill differences and other unobservable heterogeneity. We then go on to show that finance workers display higher levels of non-routine task inputs than non-finance workers, although we find little evidence that this differential has widened. Moreover, controlling for tasks performed, as well as for complex computer use and subject of degree, cannot fully explain the finance sector pay premium, with significant rents for finance workers still remaining. The UK demonstrates the second largest of these rents (at around 41 percent) in 2012 out of 21 OECD countries.
The paper is structured as follows. The next section measures the UK financial pay differential. We document the size of the finance sector pay premium, show the importance of including annual bonuses, and reveal how the premium varies across sub-sectors within finance. Section three investigates to what extent the UK financial sector has become more skill intensive, whilst section four investigates whether finance workers have higher cognitive skills on average, relative to non-finance workers. Section five considers technological
5 A ‘superstar effect’ is where small numbers of people dominate their particular field and receive very large
sums of money, far above those only slightly below them in the ability distribution within their field. See Rosen (1981) for a discussion of superstar effects.
change and the role of job tasks, whilst Section 6 looks for evidence of unexplained rents in the financial sectors of 21 OECD countries. The final section concludes.
2. Documenting the UK Financial Sector Pay Premium.
In order to measure the UK financial pay differential and to see how it has evolved over time, we start by using the New Earnings Survey Panel Dataset (NESPD). The NESPD contains a sample of working individuals whose National Insurance numbers end in a given pair of digits. The survey is distributed to and completed by firms and is undertaken in April each year by the Office for National Statistics. The survey produces close to a one percent sample of all employees in the UK and so the sample is large relative to other UK surveys. One drawback of the NESPD is that it does not collect information on the qualifications or skills of workers, although from 1996 the NESPD did start to collect the annual gross pay of workers which includes incentive and bonus payments which makes it particularly attractive for measuring the financial pay differential. As was first identified by Bell and Van Reenen (2010), using weekly or monthly data to capture salaries in the UK financial sector leaves out a large proportion of bonus payments since these tend to be paid before the end of the financial year. So for example, in the much utilised Labour Force Survey (LFS) where individuals are surveyed over five quarters and wages are surveyed twice a year but reported as weekly wages, only the wages of individuals surveyed in March/April will contain bonus receipts paid at the end of the financial year. This renders wages in the LFS as unsuitable for capturing the true extent of relative wage growth in the finance sector.
The finance sector is here defined to include any business involved in financial transactions. It therefore includes, for example, the brokers and dealers in financial area of London (‘the City’), central bankers, retail bank staff, and activities connected to insurance and pension funds.6 A diverse range of activities can thus be found within the finance sector.
Our approach is to estimate Mincer style wage equations. We use two measures of wages. The first is gross weekly wages which is likely to be similar to the LFS wage measure and largely exclude bonuses. We also use gross annual pay which will capture all labour income. Both measures are inflated into constant 2011 prices using the RPI. This provides 1,628,372 6
A full list of the sub-sectors to be found within the finance sector can be found in Table within the finance sector can be found in Table 4.
observations from 1996 to 2011, excluding missing values and workers from the non-finance public sector. We keep public sector workers who worked in banks in our sample because of the nationalisation of some banks during the financial crisis (for example the Royal Bank of Scotland in 2008). Including non-finance public sector workers strengthens our results in that they are qualitatively the same as when excluded, but the financial premiums are everywhere larger. Of our 1,628,372 observations 125,277 (7.7 percent) are finance sector workers. The real average weekly wage over the period is £492 and the real average annual labour income is £25,296. In finance these are £709 and £42,202 respectively.
Table 1 provides the OLS estimates for the financial wage premium, clustering the standard errors on one-digit industry. The first column shows that on average, gross weekly wages were around 0.40 log points (49 percent) higher in the finance sector relative to the rest of the private sector, on average, conditioning only on year differences. Using annual gross pay (which includes bonuses) results in a larger financial pay differential of 0.46 log points (58 percent). Controlling for gender increases the financial pay differential (to 0.55 log points more in terms of annual income), as we might expect given that men earn more than women on average (0.68 log points more in terms of annual income) and also that the financial sector is female dominated (55 percent of finance sector workers are women compared to 41 percent in the non-finance sector). The final column shows that further conditioning on region of residence and age reduces the financial annual pay differential again to 0.48 log points.
Since the NESPD is a longitudinal data set we are able to control for individual unobserved heterogeneity by estimating a fixed effects (FE) model. This sweeps out any of the biases in the OLS weekly/annual wage equations caused by correlations between the covariates and the time-invariant components of the error term. This is especially important here given we cannot control for highest qualifications, which are fixed over time for most adults.7 The first and third columns in Table 2 provide the OLS estimates of the financial pay differentials controlling for region and age, for weekly and annual pay respectively. We do not control for gender here to make the estimates directly comparable to the fixed effects estimates in columns two and four. We can see that the financial pay differential falls, as one would expect if there are unobservables that are positively correlated with working in the financial sector and also receiving higher wages. But rather surprisingly, they do not fall by much.
Annual wages in the Finance sector are still 0.314 log points (37 percent) higher on average, relative to those for non-finance workers in the private sector, even after conditioning on age, region and unobserved heterogeneity.
Table 3 shows changes over time in the OLS estimates of the financial annual pay premium. This shows that the financial pay premium has increased over time from being 0.362 log points (44 percent) during 1997-1999 to 0.569 log points (77 percent) during 2009-2011. The differential shows no signs of declining, despite the start of the recession in 2008. The FE results are provided in Table A1 of the Appendix and demonstrate a similar pattern, albeit with a smaller increase over time (suggesting an increase over time in the upward bias caused by unobserved (to us) heterogeneity in the OLS results, possibly due to the shake-up caused by the financial crisis and the removal of observed (by the employer) lower ability employees).
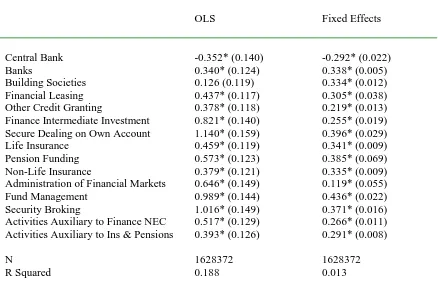
Given that fixed effects estimates of the financial pay differential are based only on a sample of workers who change between the finance and non-finance sector, 8 we further investigate whether it is the movers into or out of finance that are driving the FE results. The results are reported in Table 5. The equations contain indicators for individuals who, in successive periods, move into the finance sector, who move out of the finance sector, or who remain in the finance sector. The omitted group, who form the reference category, are therefore those who remain outside the finance sector. The dependent variable is the change in log real annual earnings between the two periods. The results reveal a significant change in wages when individuals move both into, and out of, the finance sector, with the latter dominating. Thus, those individuals who move into the finance sector receive a wage gain of 0.19 log points (20%), while those who move out of the finance sector see their wages fall by 0.37 log points (31%).9
The remainder of Table 5 considers those who move in and out of the finance sector into particular sub-sectors of finance. The results reveal that a movement into all sub-sectors yields a positive gain in wages, with the largest gains being earned by those who move into security broking, security dealing, fund management and life insurance. The same sub-sectors typically see a large fall in wages when exited.
One factor the analysis has not allowed for so far is that the occupations being performed may differ between the finance and non-finance sectors. Table A2 in the Appendix shows that conditioning on three-digit occupations also fails to fully explain these finance sector rents and demonstrates within-occupational rents for most finance workers. A stronger test is contained in Table 6. Here we restrict the sample to workers in those occupations that are most commonly found in both the finance and non-finance sectors, such as Corporate Managers, Financial and Office Managers, ICT professionals, Secretaries etc.10 We then interact occupation dummies for each occupation in turn, with the finance sector indicator. The coefficients on these interactions terms are reported in Table 611, and show the finance
8 The dataset contains 11,655 observations involving a move into the finance sector, and 11,371 observations
involving a move out.
9
The 2.5% wage change for stayers represents faster real wage growth in the finance sector than in the non-finance sector.
10 Specifically, we include the 17 three-digit occupations for which at least 5% of workers doing that job are
found in the finance sector. The full list of these 17 occupations can be found in Table 6.
11
The non-interacted occupation dummies are also included in the estimated equation, but not reported in Table 6 for reasons of space.
sector annual pay premium within each occupation, i.e. the difference in wages between workers in the same job but working in the finance or non-finance sectors. The OLS results reveal a positive finance sector premium in every occupation, most of which are statistically significant. Of more interest are the fixed effects results, where a further restriction was imposed, that individuals had to be working in the same occupation in successive periods.12 The interaction coefficients therefore reflect the change in wages earned by the same individual, working in the same occupation, but moving between the finance and non-finance sector. The results reveal a positive and statistically significant finance sector premium in every occupation. These premia are remarkably consistent across occupations, mostly being clustered around a 20 percent premium, with the highest being 0.26 log points (30 percent) for Corporate Managers, and the lowest being 0.12 log points (13 percent) for financial administrative occupations. The occupations considered in Table 6 span the occupation hierarchy, and suggest a pervasive finance sector pay premium. This is consistent with the idea of rent-sharing, with economic rent generated within the finance sector shared between all workers.
So far we have only looked at the average pay differential in the finance sector vis-a-vis the rest of the private sector. We can also look at the financial pay premium at various points of the pay distribution. We estimate quantile regressions for the whole private sector economy to get the total financial pay premiums. Table 7 reports the results for all workers. The positive finance pay premium is observed at all points of the wage distribution, but this is non-monotonic since there are high premiums at the 10th percentile (0.58 log points), slightly lower in the middle and then even higher at the 99th percentile (0.60 log points). Consequently, Table 8 estimates quantile regressions again but just for finance sector workers in order to compare the characteristics of finance sector workers at different points of the financial pay distribution. There is a much larger gender pay differential at the 10th and the 99th percentile compared to the rest of the distribution. In terms of the other characteristics, the gaps between prime-aged relative to young and old, and between London and the other regions, are all at their largest at the 99th percentile. It therefore seems that the very highest wages in the finance sector are going to 40-49 year old men working in London.
12
The dataset contains 2,276 observations involving a move into the finance sector but remaining in the same occupation, and 2,140 observations involving a move out into the same occupation.
In summary, therefore, the analysis of the NESPD reveals a large and pervasive wage premium to working in the finance sector which is larger when bonuses are included as a measure of pay. While this is in part due to the unobserved characteristics of the individuals who work in the finance sector, and in part due to the jobs being performed in that sector, these factors alone cannot explain the wage premium in full, as a significant premium remains when we control for these factors using the panel element of the NESPD. We have argued that this is consistent with the presence of rent-sharing in the finance sector. To strengthen this conclusion, however, the following sections investigate other potential explanations for this finance sector wage premium.
3. Is the Finance Sector More Skill Intensive?
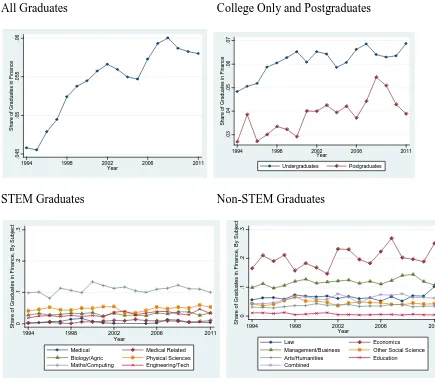
Clearly, higher average wages in the finance sector could be explained by better qualified workers on average, in the finance sector relative to all other industries. It has been well documented that the total employment shares of graduates have increased, for example Lindley and Machin (2012) use the LFS to show that the employment share of graduates increased from 0.14 in 1996 to 0.23 in 2006 and to 0.31 in 2011. We would like to know how many of these graduates are employed in finance and, conditional on the increase in the supply of graduates, are there more of them going into finance?
The first panel in Figure 2 uses the LFS to show that the finance employment share amongst graduates has increased from 0.046 in 1994 to 0.060 in 2008, but then fell slightly to 0.058 in 2011. So before the start of the recession in 2008, there were more finance workers amongst graduates than amongst the total private sector workforce (in Figure 1 0.052 percent of all private sector workers were employed in finance in 2008). Panel 2 then shows that the post-2008 fall in finance sector graduate employment share was mainly amongst postgraduate workers. The rising finance employment share amongst graduates has remained relatively steady, increasing from 0.048 in 1994 to 0.069 in 2011. For postgraduates the finance sector employment share increased from 0.027 in 1994 to 0.054 in 2008 and then fell substantially at the start of the recession to 0.039 in 2011.
the economists demonstrating the largest increases.13 In 2011 over a quarter of all economics graduates were employed in the financial sector. Figures for maths/computing and management/business were 10 percent and almost 11 percent respectively in 2011. Given these subjects are by nature more numerical, this also suggests that in the long term there has been numerical skill upgrading (mainly from economics graduates) in the financial sector, but that there was a slight fall during the recession, with fewer of these graduates going into finance, though this appears to have recovered again for the economists since 2010.
Given that we find some evidence of skill upgrading in the financial sector, Table 9 presents estimates of the financial wage premium using the 1997-2008/9 British Household Panel Survey (BHPS), obtained by estimating standard Mincer earnings equations and conditioning on educational attainment. The BHPS is a longitudinal dataset which contains questions on highest qualifications as well as a measure of annual labour income that contains bonuses that was first asked in 1997.14 Again we condition on marital status, region of residence, age, age squared and year dummies.15 The OLS conditional log monthly wage differential over the period is 0.296 log points, while the second column shows that this is 0.582 log points for graduates and 0.611 log points for some college workers, demonstrating that inter-educational financial pay differences exist. The final two columns provide the FE estimates. These suggest a similar sized financial labour income differential across all education groups. Conditioning on unobserved heterogeneity, the finance premiums are lower than the OLS estimates for finance graduates and some college workers, which is suggestive of higher cognitive skills. This is not the case for workers with lower education levels where controlling for the fixed effects suggests OLS biases in the opposite direction. However, we cannot say how much of the unobserved heterogeneity observed here is a consequence of cognitive skill differences, to which we now turn.
13 The subject of degree question in the LFS refers only to the undergraduate degree and therefore we do not
know the subject of postgraduate qualifications. For detailed definitions of the subjects listed in Figure 4 see Lindley and McIntosh (2012).
14
The BHPS is a sample of over 5,000 households in the UK, conducted annually since 1991 and contains information on human capital and socio-economic characteristics of each individual in the household. From 1997 onwards the survey also collected information on annual labour income and bonuses. The data on annual earnings in the BHPS is constructed from monthly and weekly earnings rather than being directly asked. From 1997 there was a separate question asked regarding the value of all bonuses received in the last 12 months. Following Bell and Van Reenen (2010) we add this value to the respondent’s annual labour income to produce total annual labour income including bonuses.
15 We do not condition on gender because we want to compare the OLS estimates directly with the fixed effects
estimates. But we know that conditioning on gender will increase the financial pay differential since men earn more than women and the finance sector has relatively more women than the rest of the private sector.
4. Do Finance Sector Workers Have Higher Cognitive Skills?
In this section we investigate to what extent the finance premium might be a consequence of higher cognitive skills amongst finance workers, paying particular attention to differences in numeracy and reading skills. We start by looking at whether finance workers have better adult and childhood numeracy skills on average and we then go on to estimate finance wage premiums conditioning on our measures of cognitive skills.
We draw upon the British Cohort Survey (BCS) which is a sample of men and women born in 1970 and the National Child Development Survey (NCDS) where respondents were born in 1958. The most recent sweeps of the BCS and NCDS were undertaken in 2008, when the BCS (NCDS) respondents were aged 38 (50) and questions were asked on various socio-economic and work characteristics of the respondents. The surveys provide information on gross pay, highest educational qualification, industry of employment, marital status, gender and region of residence. Similar follow-ups were undertaken in 2004 but in addition to the standard socio-economic questions, respondents in the BCS were also tested for their numeracy skills.
4.1 Differences in Adult and Childhood Test Scores
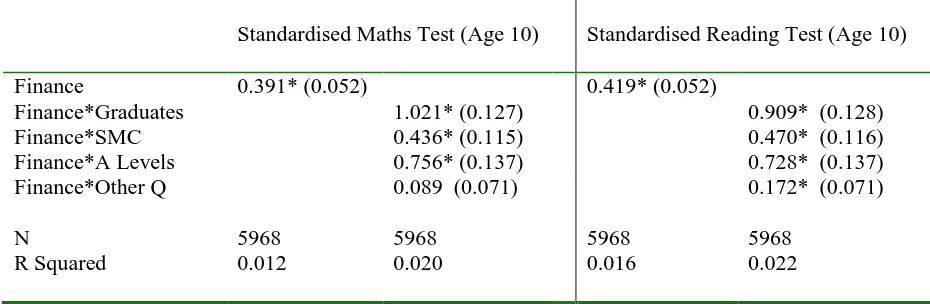
The 2004 BCS contains more than one measure of adult numeracy skills. We use the score from all 23 numeracy questions that were asked, and also use the derived numeracy level variable which is coded into five categories. Given that finance workers could be more numerate because their job involves more numerical tasks, we additionally use childhood test scores for mathematics and reading taken when the respondents were aged 10 and 11. The BCS 1980 and NCDS 1969 follow-ups provide reading and mathematics tests. We think these childhood measures are better measures of cognitive skill since they were undertaken before the respondents were influenced by secondary and higher education, but more importantly before they started work in the finance sector. All test scores were standardised to have mean zero and a standard deviation of one, to make them comparable across surveys.
adult numeracy measures. This is largest for graduates and workers with A-levels. Of course we would expect this and the causality here is questionable. But Table 11 shows that childhood mathematics and reading scores were also higher for finance workers relative to those in other sectors. This provides better evidence that most finance workers have higher cognitive skills, on average, relative to non-finance workers.
Table 12 shows the same as Table 11 but for 6,790 workers from the NCDS who were aged 46 in 2004. The average finance differential for maths scores is 0.40 standard deviations, which is very similar to that in the BCS for 34 year olds (0.39). 16 So the maths and reading test scores are again higher in finance, but much more so for maths skills in the case of the NCDS. The finance differential for reading is lower (0.24 standard deviations) relative to that for the BCS (0.42). The financial graduate maths differential (1.20 standard deviations) is slightly larger that found in the BCS (1.02), with a larger fall between cohorts for some college workers (0.73 standard deviations compared to 0.44 in the BCS). This suggests that finance sector college workers might be becoming relatively less numerate over time, whereas finance A-level workers have become slightly more numerate over time, since the maths test score in finance is higher in the BCS (0.76 standard deviations) than in the NCDS (0.64). All finance workers appear to have become relatively more competent in reading, particularly the lower qualified finance workers, relative to non-finance workers.
4.2 Wage Equations
Given we can observe the same respondents in both the 2004 and 2008 BCS and in both the 2004 and 2008 NCDS we can estimate panel data wage equations that control for cognitive skills.17 We pool the two data sets to increase sample size, and control for age. In the BCS and NCDS respondents are asked the question `the last time you were paid, what was your
gross pay before deductions’. Unfortunately the 2004 BCS (and NCDS) do not include
questions for annual labour income or bonuses, so we are faced with the familiar problem of potential under-reporting. For example, only 665 (14 percent) of our 4,693 BCS sample with
16
We cannot compare the BCS age 34 in 2004 with the NCDS age 33 in 1991 because current industry of employment is not included in the NCDS 1991 survey. The 1999 NCDS (age 41) provides a financial differential (standard error) on maths scores of 5.53(0.549) and on reading scores of 2.09 (0.324). This suggests that the older cohort of finance workers has relatively higher cognitive mathematical skills but lower reading skills.
17 We do not use the BCS 1996 sweep in our panel analysis since the gross pay variable is measured differently
whereas it is identical in the 2004 and 2008 follow-ups. We also considered using the NCDS for comparable age changes using sweep 5 (age 33 in 1991) and sweep 6 (age 41 in 1999) but as already mentioned industry of employment is not included in the 1991 data.
reported earnings listed their gross earnings responses as being annual.18 Nevertheless we continue to estimate financial earnings premiums using log monthly gross pay, bearing in mind that these are likely to be under-estimates of the total financial income premium.
We start by estimating the pooled OLS financial wage premium without conditioning on cognitive skills, we then also estimate the same using fixed effects to control for unobserved heterogeneity and finally we do the same conditioning on cognitive skills. Our sample consists of 15,642 individuals of which 969 (6.1 percent) are employed in finance. We control for marital status, region of residence, age and year.19 We can only control for childhood test scores here since the NCDS does not provide measures for adult test scores. Table 13 provides the pooled OLS and fixed effects estimates for the finance pay premium. The first and third columns show that the average financial wage premium falls (from 0.262 to 0.113 log points) when we control for unobserved heterogeneity. The fourth column shows that there is only a financial pay premium for graduates (0.270 log points) and workers with A levels (0.230 log points), once we condition on differences in the unobservables.
Of course estimating fixed effects cannot distinguish OLS biases from cognitive skill differences or other unobserved heterogeneity. So in the final two columns of Table 13 we condition on childhood test scores to control for cognitive skills. The pooled OLS financial childhood maths premium is 0.011 log points showing that in finance there is a greater return to childhood maths scores relative to not being employed in finance, on average. The estimate of the graduate wage premium falls from 0.901 to 0.744 suggesting cognitive skills explain 0.157 log points of the financial wage premium. For some college workers the cognitive bias is 0.124 log points (based on a fall from 0.539 to 0.415) and for A-Level workers this is 0.114 log points (based on a fall from 0.293 to 0.179). The final column conditions on unobserved heterogeneity and shows that the financial wage premium is now only statistically significant for graduates (0.461) and workers with A-Levels (0.341). Given that fixed effects is the within group estimator this seems to be suggesting that a graduate moving into or out of finance will see a bigger wage increase when holding maths test scores constant (0.461) than when not (0.270). For A-Level workers this is not the case since we see a smaller financial
18 The fieldwork for the 2004 BCS was undertaken between February 2004 and June 2005. There is a question
on annual employment income in the 2008 BCS but this is banded and does not appear in the 2004 sweep. Given we estimate panel data models using the 2004 and 2008 BCS/NCDS we do not use this annual employment income data.
return once we hold the higher test scores of the well-educated constant. However, in the final column the return to maths scores is lower for finance workers than non-finance workers, so the wage return to moving into or out of finance is higher for someone with lower maths scores, presumably because those with good maths scores get good wages anywhere, but those with poorer maths scores who nevertheless manage to get into finance get a good return compared to the alternative jobs they might have had. So once we control for maths test scores (and given the higher educated have better test scores) the return to moving into or out of finance for the educated (graduates) is actually higher, but not for the less educated (those with A-levels) where it is lower.
In summary, our results suggest that 0.157 log points of the 0.901 log point graduate financial pay differential is a consequence of differences in cognitive skills (0.901-0.744), and that 0.283 (0.744-0.461) of the OLS graduate financial pay differential is a consequence of other unobserved heterogeneity. with a remaining unexplainable rent of 0.461 log points. For A-Level workers the cognitive skills difference component is 0.114 log points and the unobserved heterogeneity component is negative at -0.162, with a remaining rent of 0.341 log points.
5. Technological Change and Task Inputs
earnings are deflated into constant prices using the RPI, though these are largely thought to exclude bonuses.
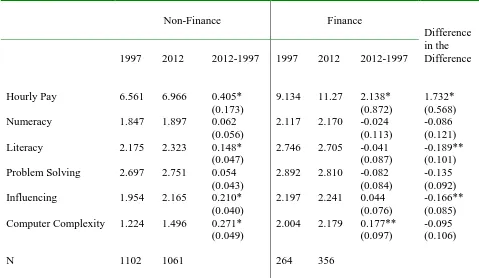
The task input measures that we draw upon include some that might be thought to capture non-routine tasks, see Green (2012). These are numeracy, literacy, problem-solving and influencing people. We also use ‘computer use complexity’ to measure technological input. The task input measures are derived from a range of questions asking respondents how important a certain skill is in their job, with respondents options `not important’, `not very important’, `fairly important’, `very important’ and `essential’, ranging between 1 and 5. These aspects of skill use are collapsed into five groups based on explanatory factor analysis. The variables used are described in more detail in Table A3 of the Appendix.20
Table 14 shows that hourly pay, non-routine task inputs and computer use are generally higher in the finance relative to the non-finance sector. In terms of changes over time, the first row shows that the hourly pay differential has increased in non-finance to 6.97 per hour in 2012 and in finance to 11.27 in 2012 and the final column shows that this increase in hourly pay is statistically larger in the finance sector relative to non-finance (by 1.73 pounds). However, although workers in the finance sector generally demonstrate higher non-routine task inputs and computer complexity vis-a-vis non-finance, if anything this gap is closing rather than widening (certainly in terms of literacy and influencing people). This therefore fails to support the idea that TBTC might be explaining the increase in the financial pay differential through changes in the relative quantities of non-routine tasks being performed.
In Table 15 we estimate the OLS financial log hourly pay differential using the 1997, 2001, 2006 and 2012 GBSS data. We find a raw differential of 0.312 log points, which falls slightly to 0.306 once we condition on gender, marital status and region of residence. Allowing the financial pay differential to vary across highest NVQ level shows that again the financial pay differential is largest for NVQ level 4 which contains graduates (0.544) and is negative for those with no qualifications (-0.237). 21 For graduates, this is very similar to that found using weekly wages from the BHPS in Table 10 (0.566). For workers with NVQ level 1 as their highest qualification there is no significant financial pay differential. The fourth column
20
See Green (2012) for a detailed discussion on the construction of these non-routine task measures.
21
conditions on non-routine task inputs and computer use complexity. The financial pay differential falls slightly but is still significant for graduates (0.333), NVQ level three workers (0.136) and workers with no qualifications (-0.079). So in terms of the increasing prices (wages) attached to non-routine tasks (which are presumably in higher demand through TBTC), there is little evidence that differences in non-routine task endowments can fully explain the existing financial pay differential.
In the final two columns of Table 15 we investigate the role of subject of degree. Detailed classifications for degree subject are only provided from 2001 onwards so our sample now is smaller at 6,928 workers. The fifth column shows that the financial pay premiums are fairly similar for this reduced sample compared to those for the full sample in column four. The final column then further disaggregates graduates by their undergraduate degree subject. Graduates of all subjects receive a higher hourly wage premium in finance vis-à-vis non-finance. The largest is for Maths graduates (0.492) with Computing (0.475) and Business/Management (0.404) receiving similarly large financial pay premiums, even after conditioning on non-routine task inputs and computer use complexity.
In summary, we find no evidence that the higher levels of non-routine task inputs and computer use complexity observed in the financial sector can fully explain the financial pay differential, nor its increase. Conditioning on non-routine tasks and computer use reduces the differential but there still appears to be unexplainable rents, and these exist for graduates and workers with NVQ level three qualifications. The largest are for graduates with Maths, Computing and Business/Management degrees.
6. Cross Country Evidence for Financial Sector Rent-Sharing.
countries. 22 We use monthly wages that contain bonuses, as well as test scores for numeracy, literacy and problem solving, along with information on non-routine task inputs for numeracy, reading, writing, influencing people and computer use complexity. The test scores capture adult cognitive skills rather than childhood skills, but the task input variables are almost identical to those used in the previous section. This allows us to firstly compare skills and task inputs in the Finance sector vis-à-vis the non-Finance sector across 22 countries, but then also to estimate wage equations conditioning firstly on gender and age, and then sequentially on education, adult test scores and non-routine task inputs. 23 Any remaining financial pay differential might therefore be attributed to unexplained rents.
Table 16 contains the financial sector differentials for highest qualification and test scores for 21 countries. The first column shows that the UK finance sector is more skill intensive than the rest of the Economy since it had around 17 percent more workers with International Standard Classification for Education (ISCED) level 5 or 6 compared to the non-finance sector in 2012. 24 This is not particularly high compared to some other countries, with Poland displaying the greatest relative skill intensity in its finance sector (29 percent) closely followed by Japan (23 percent) and Norway (22 percent). For the US this is lower at around 10 percent.
The second column of Table 16 shows that in terms of numeracy and literacy competency, most finance sectors demonstrate higher test scores relative to the non-finance sector, with Finland, Japan, Korea and Russia (though only for literacy) being the only exceptions. The largest financial numeracy differential is in Norway, whilst for literacy it is in Estonia. Cross country similarities in the problem solving scores of finance vis-à-vis non-finance workers demonstrate a similar pattern, with Estonia and the UK demonstrating the largest finance differentials. The UK financial differential is above the cross country average for all competencies, whereas the US financial sector differential is below it.
In Table 17 we present the financial differentials in non-routine task inputs and computer use complexity. Uniformly (except for in Russia) finance sector workers are much more likely to
22 See http://www.oecd.org/site/piaac/ for details.
23 We do not have the data for Australia since this is not included in the public use file.
24 The ISCED 5 and 6 classification contains graduates and post-graduates. In the UK 50 percent of finance
sector workers were graduates in 2012, compared to 33 percent in the non-finance sector. This is not to be confused with Figure 2 that shows that of all UK graduates 0.058 percent were employed in finance in 2011.
report performing numeric, reading and writing tasks relative to those in non-finance. In a few countries finance workers report performing more influencing tasks, but the UK is not one of them. The final column again shows that finance sector workers in all countries (again aside from Russia) report greater computer use complexity in their jobs. The UK finance differential is above the international average for numeric task inputs and computer use complexity, whereas that in the US is again below it. The UK finance differential is below average in terms of reading and writing task inputs.
Overall Tables 16 and 17 corroborate the evidence presented so far in the paper for the UK, namely that workers in the finance sector have higher adult test scores both for numeracy and literacy, but also perform more non-routine tasks in their job. These tables also demonstrate how pervasive these findings are across a number of countries. Given this, we now estimate the financial sector pay differential, conditioning on these competencies.
Table 18 presents estimates of the financial monthly log pay differential across our 21 countries. Most of these countries have monthly wage data that include bonuses, but for five countries (Austria, Canada, Germany, Sweden and the US) the wage data are banded and we are only provided with the decile to which each respondent’s wage corresponds. For these countries we therefore perform interval regression. The first column provides the raw differential, which is statistically significant across most countries we observe (except for Japan, Russia and the Slovak Republic). The largest financial pay differential is 61 log points for Spain, followed by 0.53 for the UK which is close to that of 0.57 found earlier using the NES for 2009-2011 (Table 3). The US has the 6th largest financial pay differential.
The second column conditions on gender and age. Not surprisingly the financial pay differential falls in most countries including the UK, Spain and the US. Further conditioning sequentially on test scores and non-routine task inputs reduces the financial pay differential still further but a significant differential remains for 17 of the 21 countries observed. The largest is still in Spain (49 percent) and the second is in the UK (41 percent), with the US have the 7th largest (27 percent). This provides further evidence of financial sector rents which are largest in Spain and the UK but which are prevalent in 80 percent of OECD countries.
7. Conclusion.
The UK finance sector wage premium is large and has increased over time. In the UK, the largest returns go to male graduates, living in London, aged between 40 and 49 who are employed as dealers or brokers in the security broking sector. However, the premium is observed across different sub-sectors of finance, for different occupations, for workers with different qualification levels and also across most other OECD countries. It can be found at all points of the pay distribution, not just at the mean. It therefore seems to be a pervasive feature of remuneration in the financial sector.
References
Acemoglu, D. and D. Autor (2010) Skills, Tasks and Technologies: Implications for Employment and Earnings, in Ashenfelter, O. and D. Card (eds.) Handbook of Labor Economics Volume 4, Amsterdam: Elsevier.
Autor, D., L. Katz, and M. Kearney (2008) Trends in U.S. Wage Inequality: Re-Assessing the Revisionists, Review of Economics and Statistics, 90 300-323.
Autor, D., F. Levy, and R. Murnane (2003) The Skill Content of Recent Technological Change: An Empirical Exploration, Quarterly Journal of Economics, 118(4), November 2003, 1279-1334.
Beaudry, P., M. Doms and E. Lewis (2010) Should the Personal Computer Be Considered a Technological Revolution? Evidence from U.S. Metropolitan Areas, Journal of Political Economy, 118, 988-1036.
Bell, B and J. Van Reenen (2010) Bankers Pay and Extreme Wage Inequality in the UK, Centre for Economic Performance Special Paper No CEPSP21.
Bell, B and J. Van Reenen (2013) Bankers and Their Bonuses, Centre for Economic Performance Occasional Paper No 35.
Green, F. (2012) Employee Involvement, Technology, and Evolution in Job Skills: A Task-Based Analysis, Industrial Labor Relations Review, Volume 65 (1).
Katz, L. and D. Autor (1999) Changes in the Wage Structure and Earnings Inequality, in O. Ashenfelter and D. Card (eds.) Handbook of Labor Economics, Volume 3, North Holland. Katz, L. and K. Murphy (1992) Changes in Relative Wages, 1963-87: Supply and Demand Factors, Quarterly Journal of Economics, 107, 35-78.
Lindley, J. and S. Machin (2011) Postgraduate Education and Rising Wage Inequality, IZA Discussion Paper No. 5981.
Lindley, J. and S. Machin (2012) The quest for more and more education: implications for social mobility, Fiscal Studies, Vol. 33, No. 2, June 2012
Lindley, J. and S. McIntosh (2012) Growing within-graduate wage inequality and the role of subject of degree, Sheffield Economics Research Paper No 2012029.
Philippon, T. and A. Reshef (2012) Wages and Human Capital in the U.S. Financial Industry: 1909-2006, Quarterly Journal of Economics, Vol 127, Issue 4.
Reed, H. and J.M. Himmelweit (2012) Where Have All the Wages Gone: Lost pay and profits outside financial services, Touchstone Extra Report for the TUC.
Figure 1. Finance Employment Shares and Annual Earned Income 1997-2009 (SPI). Employment Share Ratio of Average Annual Earned Income
[image:25.595.71.506.349.727.2]Notes: For finance relative to all other private sector workers. Data are weighted.
Figure 2. Finance Employment Shares of Graduates 1994-2011 (LFS)
All Graduates College Only and Postgraduates
STEM Graduates Non-STEM Graduates
Notes: Weighted using person weights. Employed men and women aged 16-65.
.052 .053 .054 .055 .056 .057 F inanc e E m ploy m ent S har e
1997 1998 1999 2000 2001 2002 2003 2004 2005 2006 2007 2008 2009 Year 1. 8 2 2. 2 2. 4 2. 6 F inanc e Relat iv e A nnual E ar ned Inc om e
1997 1998 1999 2000 2001 2002 2003 2004 2005 2006 2007 2008 2009 Year .045 .05 .055 .06 S har e of G raduat es in F inanc e
1994 1998 2002 2006 2011
Year .03 .04 .05 .06 .07 S har e of G raduat es in F inanc e
1994 1998 2002 2006 2011
Year Undergraduates Postgraduates 0 .1 .2 .3 S har e of G raduat es in F inanc e, B y S ubjec t
1994 1998 2002 2006 2011
Year
Medical Medical Related
Biology/Agric Physical Sciences
Maths/Computing Engineering/Tech 0 .1 .2 .3 S har e of G raduat es in F inanc e, B y S ubjec t
1994 1998 2002 2006 2011
Year
Law Economics
Management/Business Other Social Science
Arts/Humanities Education
Table 1. OLS Estimate of the Finance Pay Differential 1996-2011
Log Gross Weekly Pay Log Annual Gross Pay
Finance 0.398* (0.139)
0.487* (0.116)
0.413* (0.100)
0.459* (0.154)
0.553* (0.127)
0.478* (0.103)
Male 0.644*
(0.039)
0.619* (0.037)
0.681* (0.039)
0.646* (0.040) Including Controls No No Yes No No Yes
N 1628372 1628372 1628372 1628372 1628372 1628372 R Squared 0.043 0.193 0.324 0.036 0.144 0.282
Notes: NESPD sample of men and women age 16-65. Controls are region, age and age squared. Year dummies are also included, clustering on industry. Excluding the non-finance public sector. Standard errors are in parentheses.
Table 2. OLS and Fixed Effects Comparison of the Finance Pay Differential 1996-2011
Log Gross Weekly Pay Log Annual Gross Pay
OLS Fixed Effects OLS Fixed Effects
Finance 0.329* (0.119)
0.268* (0.003)
0.391* (0.125)
0.314* (0.004) Including Controls Yes Yes Yes Yes
N 1628372 1628372 1628372 1628372 R Squared 0.186 0.024 0.185 0.013
[image:26.595.68.522.369.508.2]Table 3. Changes Over Time: OLS Estimates of the Log Annual Pay Finance Differential 1996-2011
Finance Indicator N R Squared
1997-1999 0.362* (0.113) 411472 0.231 2000-2002 0.455* (0.101) 304158 0.313 2003-2005 0.483* (0.102) 306891 0.299 2006-2008 0.553* (0.099) 281496 0.275 2009-2011 0.569* (0.095) 324355 0.278
Notes: NESPD sample of men and women age 16-65. Controls are male, region, age and age squared. Year dummies are also included. Excluding the non-finance public sector. Standard errors are in parentheses.
Table 4. OLS and Fixed Effects Estimate of the Sub-Sector Finance Pay Differential 1996-2011
OLS Fixed Effects
Central Bank -0.352* (0.140) -0.292* (0.022) Banks 0.340* (0.124) 0.338* (0.005) Building Societies 0.126 (0.119) 0.334* (0.012) Financial Leasing 0.437* (0.117) 0.305* (0.038) Other Credit Granting 0.378* (0.118) 0.219* (0.013) Finance Intermediate Investment 0.821* (0.140) 0.255* (0.019) Secure Dealing on Own Account 1.140* (0.159) 0.396* (0.029) Life Insurance 0.459* (0.119) 0.341* (0.009) Pension Funding 0.573* (0.123) 0.385* (0.069) Non-Life Insurance 0.379* (0.121) 0.335* (0.009) Administration of Financial Markets 0.646* (0.149) 0.119* (0.055) Fund Management 0.989* (0.144) 0.436* (0.022) Security Broking 1.016* (0.149) 0.371* (0.016) Activities Auxiliary to Finance NEC 0.517* (0.129) 0.266* (0.011) Activities Auxiliary to Ins & Pensions 0.393* (0.126) 0.291* (0.008)
N 1628372 1628372
R Squared 0.188 0.013
[image:27.595.67.505.304.595.2]Table 5. Annual Change in Wages for Movers into and Out of Finance 1996-2011
Move in Move Out Stay
All finance
N
R squared
Finance sub-sectors: Central Bank
0.185* (0.007)
1330356 0.003
#
-0.375* (0.055)
#
0.025* (0.007)
-0.022* (0.007) Banks 0.182* (0.007) -0.432* (0.068) 0.029* (0.007) Building Societies 0.185* (0.007) -0.256* (0.030) 0.082* (0.007) Financial Leasing # # 0.030* (0.007) Other Credit Granting 0.076* (0.007) -0.191* (0.060) 0.018* (0.007) Financial Intermediation/ Inv. 0.063* (0.007) -0.353* (0.049) 0.027* (0.007) Security Dealing on Own Account 0.347* (0.006) # 0.099* (0.007) Life Insurance 0.358* (0.007) -0.489* (0.080) 0.014 (0.007)
Pension Funding # # -0.017* (0.007)
Non-Life Insurance 0.222* (0.007) -0.412* (0.049) 0.017* (0.007) Administration of Financial Markets # # 0.119* (0.007) Fund Management 0.311* (0.006) -0.774* (0.123) 0.028* (0.007) Security Broking 0.428* (0.006) -0.529* (0.127) 0.030* (0.007) Activities Auxiliary to Finance NEC 0.117* (0.007) -0.269* (0.072) -0.006 (0.007) Activities Auxiliary to Ins &
Pensions
0.145* (0.007) -0.331* (0.061) -0.002 (0.007)
N 1330356
R Squared 0.004
Table 6. OLS and Fixed Effects Estimate of the Finance Annual Pay Differential, Amongst Individuals Working in Occupations Most Commonly Found in Both Finance and Non-Finance Sectors
OLS Fixed Effects
111 Corporate managers 0.376* (0.065) 0.263* (0.026) 113 Functional managers 0.320* (0.030) 0.196* (0.008) 114 Customer care manager 0.007 (0.033) 0.206* (0.026) 115 Financial and office managers 0.255* (0.029) 0.173* (0.010) 213 ICT professionals 0.119* (0.013) 0.159* (0.014) 242 Business/statistical professionals 0.103* (0.012) 0.127* (0.014) 313 IT service delivery 0.170* (0.031) 0.188* (0.022) 352 Legal associate professionals 0.305* (0.013) 0.177* (0.046) 353 Business/finance ass. professionals 0.219* (0.024) 0.131* (0.011) 354 Sales associate professionals 0.065 (0.036) 0.163* (0.020) 412 Admin occupations: finance
413 Admin occupations: records
0.067 (0.044) 0.165 (0.078)
0.124* (0.008) 0.147* (0.013) 414 Admin occupations: comms 0.136 (0.068) 0.171* (0.046) 415 General admin 0.263* (0.074) 0.163* (0.010) 421 Secretarial 0.344* (0.082) 0.185* (0.014) 712 Sales related 0.288* (0.057) 0.194* (0.020) 721 Customer service 0.341* (0.076) 0.147* (0.015)
N 548858 361761
R Squared 0.393 0.250
Table 7. Quantile Regressions for the Conditional Financial Pay Differential 1996-2011.
Percentile: 10th 25th 50th 75th 90th 99th
[image:30.595.68.498.275.609.2]Finance 0.582* (0.006) 0.492* (0.003)* 0.412* (0.002) 0.348* (0.002) 0.360* (0.003) 0.601* (0.003) N 1628372 1628372 1628372 1628372 1628372 1628372
Notes: NESPD sample of men and women age 16-65. Year dummies are also included,. Excluding the non-finance public sector. Standard errors are in parentheses, clustered on industry.
Table 8. Quantile Pay Regressions For Finance Sector Workers 1996-2011.
Percentile: 10th 25th 50th 75th 90th 99th
Men 0.688* (0.011) 0.599* (0.006) 0.493* (0.004) 0.544* (0.004) 0.593* (0.007) 0.753* (0.019) Age 16-29 -0.473*
(0.017) -0.308* (0.009) -0.295* (0.007) -0.335* (0.007) -0.408* (0.011) -0.606* (0.032) Age 30-39 0.085*
(0.017) 0.083* (0.009) 0.094* (0.007) 0.089* (0.007) 0.081* (0.011) 0.022* (0.032) Age 40-49 0.177*
(0.018) 0.169* (0.009) 0.169* (0.007) 0.181* (0.007) 0.193* (0.012) 0.223* (0.004) Rest of S East -0.498*
(0.015) -0.497* (0.008) -0.528* (0.006) -0.645* (0.006) -0.887* (0.010) -1.281* (0.029) South West -0.600*
(0.019) -0.568* (0.010) -0.566* (0.008) -0.684* (0.008) -0.921* (0.013) -1.392* (0.028) Midlands -0.551*
(0.019) -0.593* (0.009) -0.629* (0.008) -0.777* (0.008) -1.011* (0.012) -1.379* (0.035) North West -0.587*
(0.019) -0.588* (0.010) -0.607* (0.008) -0.742* (0.008) -1.020* (0.013) -1.465* (0.037) North -0.625*
(0.018) -0.627* (0.009) -0.637* (0.007) -0.746* (0.008) -0.979* (0.012) -1.458* (0.037) Wales -0.639*
(0.033) -0.621* (0.017) -0.709* (0.013) -0.864* (0.014) -1.115* (0.022) -1.585* (0.061) Scotland -0.474*
(0.020) -0.512* (0.010) -0.535* (0.008) -0.646* (0.008) -0.874* (0.013) -1.280* (0.037)
N 125277 125277 125277 125277 125277 125277
Table 9. Estimate of the Log Annual Labour Income Finance Pay Differential, BHPS 1997-2008
OLS Fixed Effects
Finance 0.296* (0.128) 0.127* (0.022)
Finance*Graduates 0.582* (0.125) 0.172* (0.047) Finance*SMC 0.611* (0.132) 0.125* (0.049) Finance*2 Plus A Levels 0.166 (0.126) 0.120* (0.045) Finance*Other Q 0.008 (0.128) 0.097* (0.038)
N 52185 52185 52185 52185
R Squared 0.144 0.149 0.110 0.111
Notes: BHPS sample of men and women age 16-65. Conditioning on married, region, age and age squared. Year dummies are also included, clustering on industry. Excluding the non-finance public sector. Standard errors are in parentheses.
Table 10. BCS: OLS Estimate of the Finance Differential for Standardised Adult Test Scores
Standardised Numeracy Test Score Numeracy Level
Finance 0.364* (0.049) 0.419* (0.057)
Finance*Graduates 0.703* (0.119) 0.823* (0.140) Finance*SMC 0.427* (0.108) 0.524* (0.127) Finance* A Levels 0.565* (0.128) 0.715* (0.151) Finance*Other Q 0.187* (0.066) 0.181* (0.078)
N 5968 5968 5968 5968
R Squared 0.029 0.032 0.031 0.031
[image:31.595.67.538.347.497.2]Table 11. BCS: OLS Estimate of the Finance Differential for Standardised Childhood Test Scores
Standardised Maths Test (Age 10) Standardised Reading Test (Age 10)
Finance 0.391* (0.052) 0.419* (0.052)
Finance*Graduates 1.021* (0.127) 0.909* (0.128) Finance*SMC 0.436* (0.115) 0.470* (0.116) Finance*A Levels 0.756* (0.137) 0.728* (0.137) Finance*Other Q 0.089 (0.071) 0.172* (0.071)
N 5968 5968 5968 5968
R Squared 0.012 0.020 0.016 0.022
Notes: BCS sample of men and women born in 1970 and observed in 2004 (age 34). Conditioning on gender. Standard errors are in parentheses.
Table 12. NCDS: OLS Estimate of the Finance Differential for Standardised Childhood Test Scores
Standardised Maths Test (Age 11) Standardised Reading Test (Age 11)
Finance 0.402* (0.057) 0.235* (0.057)
Finance*Graduates 1.195* (0.183) 0.839* (0.183) Finance*SMC 0.725* (0.141) 0.420* (0.141) Finance*A Levels 0.639* (0.124) 0.442* (0.124) Finance*Other Q 0.090 (0.076) 0.005 (0.076)
N 6790 6790 6790 6790
R Squared 0.008 0.014 0.002 0.006
[image:32.595.64.550.343.494.2]Table 13. BCS and NCDS: Estimate of the Finance Monthly Gross Pay Differential in 2004 & 2008
Base Model Conditioning on Child Test Scores
Pooled OLS Fixed Effects Pooled OLS Fixed Effects
Finance 0.262* (0.026)
0.113* (0.048) Finance*Graduates 0.901*
(0.071)
0.270* (0.019)
0.744* (0.106)
0.461* (0.195) Finance*SMC 0.539*
(0.061)
0.034 (0.107)
0.415* (0.091)
0.169 (0.156) Finance*A Levels 0.293*
(0.061)
0.230** (0.133)
0.179* (0.090)
0.341** (0.177) Finance*Other Q -0.004
(0.036)
0.061 (0.069)
-0.090 (0.067)
0.158 (0.125)
Finance*Maths Score 0.011*
(0.003)
-0.011** (0.006)
Finance*Reading Score -0.011*
(0.004)
0.010 (0.008)
N 15642 15642 15642 15642 15642 15642 R Squared 0.040 0.051 0.005 0.005 0.052 0.005
Table 14. Hourly Wages, Non-Routine Task Inputs and Computer Use Complexity, 1997 and 2012
Non-Finance Finance
Difference in the Difference 1997 2012 2012-1997 1997 2012 2012-1997
Hourly Pay 6.561 6.966 0.405* (0.173)
9.134 11.27 2.138* (0.872)
1.732* (0.568) Numeracy 1.847 1.897 0.062
(0.056)
2.117 2.170 -0.024 (0.113)
-0.086 (0.121) Literacy 2.175 2.323 0.148*
(0.047)
2.746 2.705 -0.041 (0.087)
-0.189** (0.101) Problem Solving 2.697 2.751 0.054
(0.043)
2.892 2.810 -0.082 (0.084)
-0.135 (0.092) Influencing 1.954 2.165 0.210*
(0.040)
2.197 2.241 0.044 (0.076)
-0.166** (0.085) Computer Complexity 1.224 1.496 0.271*
(0.049)
2.004 2.179 0.177** (0.097)
-0.095 (0.106)
N 1102 1061 264 356
Table 15. OLS Estimates of the Finance Hourly Pay Differential 1997-2012
Using GB Skills Survey 1997-2012
Using GB Skills Survey 2001-2012
Finance 0.312*
(0.018)
0.306* (0.016)
Finance*HNVQ==4 0.544*
(0.025)
0.333* (0.023)
0.355* (0.024)
Finance*HNVQ==3 0.279*
(0.028) 0.136* (0.026) 0.113* (0.028) 0.115* (0.028)
Finance*HNVQ==2 0.075*
(0.023) 0.009 (0.022) -0.004 (0.024) -0.004 (0.024)
Finance*HNVQ==1 0.037
(0.049) 0.067 (0.043) 0.062 (0.046) 0.063 (0.046) Finance*No Quals -0.237*
(0.035) -0.093* (0.029) -0.079* (0.035) -0.081* (0.034)
Finance*Maths 0.492*
(0.081)
Finance*Computing 0.475*
(0.128)
Finance*Medical/Science 0.373*
(0.061)
Finance*Social Science 0.328*
(0.093)
Finance*Art/Humanities 0.336*
(0.076) Finance*Business/Manag
ement
0.404* (0.061)
Finance*Law 0.385*
(0.089)
Finance*Other Subject 0.266*
(0.031)
Year Dummies Yes Yes Yes Yes Yes Yes Controls No Yes Yes Yes Yes Yes Tasks and Computer Use No No No Yes Yes Yes
N 8294 6928
Table 16 Cross Country Finance Sector Differentials in Highest Qualifications and Adult Test Scores in 2012
ISCED 5/6 Numeracy Literacy Problem Solving N
Coef. S.E. Coef. S.E. Coef. S.E. Coef. S.E.
Austria -0.015 0.030 13.405* 3.432 12.679* 3.011 10.117* 3.202 2652
Belgium 0.144* 0.044 19.229* 4.098 19.474* 4.093 12.209* 3.957 2338
Canada 0.127* 0.027 10.499* 3.231 10.634* 2.673 6.106** 3.055 14368
Czech Rep 0.113 0.076 11.169** 5.690 10.298** 5.635 14.161* 6.802 2709
Denmark 0.067 0.047 13.028* 3.878 12.167* 3.460 6.511** 3.992 4064
Estonia 0.160* 0.055 22.032* 4.234 22.300* 4.120 26.006* 4.823 3695
Finland 0.120** 0.062 6.969 5.808 3.932 5.470 0.703 5.531 3354
France 0.203* 0.040 17.049* 3.449 14.981* 3.183 - - 3019
Germany -0.007 0.036 15.985* 4.390 12.129* 4.291 7.309** 4.334 3018
Ireland 0.108* 0.036 15.436* 4.299 15.107* 4.100 9.051* 3.749 2630
Italy 0.078 0.058 17.938* 5.672 18.800* 5.591 - - 1658
Japan 0.227* 0.054 7.763 5.762 6.210 5.064 0.800 6.744 2966
Korea 0.063 0.043 4.543 3.966 3.455 3.930 -1.553 4.011 2845
Netherlands -0.009 0.048 13.147* 3.803 13.353* 3.264 10.908* 3.677 2750
Norway 0.216* 0.064 23.566* 5.888 18.396* 5.726 19.616* 5.173 3214
Poland 0.290* 0.048 14.783* 6.236 18.042* 5.521 11.847 7.910 3046
Russian Fed 0.150* 0.073 14.275** 8.903 -5.583 9.668 18.526* 6.476 1453
Slovak Rep 0.116* 0.058 11.981* 5.580 7.300** 4.195 7.746 5.574 1974
Spain 0.167* 0.059 15.493* 5.571 12.207* 5.007 - - 1941
Sweden 0.097** 0.063 19.506* 6.314 18.549* 5.497 14.596* 6.042 2631
UK 0.167* 0.056 17.011* 5.112 13.916* 3.973 21.399* 3.953 4350
US 0.095** 0.055 9.668* 4.828 11.224* 4.869 8.167* 3.882 2735
Average 0.122* 0.011 14.29* 1.102 12.251* 1.038 10.751* 1.164 73410
Table 17 Cross Country Finance Sector Differentials in Non-Routine Task Inputs and Complex Computer Use in 2012
Numeric Tasks
Reading Tasks
Writing Tasks
Influencing Tasks
Computer Complexity
N
Coef. S.E. Coef. S.E. Coef. S.E. Coef. S.E. Coef. S.E.
Austria 0.605* 0.082 0.423* 0.059 0.435* 0.069 0.247* 0.060 0.415* 0.053 2652
Belgium 0.775* 0.114 0.472* 0.074 0.293* 0.072 0.185* 0.064 0.334* 0.043 2338
Canada 0.527* 0.069 0.328* 0.040 0.277* 0.043 -0.013 0.048 0.472* 0.033 14368
Czech Rep 0.706* 0.149 0.553* 0.151 0.696* 0.119 0.400* 0.115 0.492* 0.056 2709
Denmark 0.562* 0.091 0.322* 0.058 0.116* 0.056 0.034 0.068 0.343* 0.046 4064
Estonia 0.623* 0.104 0.303* 0.058 0.269* 0.055 0.165* 0.076 0.426* 0.045 3695
Finland 0.645* 0.091 0.253* 0.063 0.313* 0.064 0.032 0.101 0.317* 0.049 3354
France 0.376* 0.103 0.113* 0.050 0.267* 0.063 0.044 0.062 0.392* 0.035 3019
Germany 0.615* 0.083 0.340* 0.075 0.142* 0.060 0.070 0.069 0.469* 0.058 3018
Ireland 0.709* 0.095 0.201* 0.064 0.511* 0.071 -0.077 0.087 0.559* 0.054 2630
Italy 0.795* 0.196 0.466* 0.104 0.577* 0.103 0.393* 0.100 0.531* 0.066 1658
Japan 0.056 0.081 0.295* 0.099 0.432* 0.101 0.337* 0.120 0.096 0.069 2966
Korea 0.365* 0.091 0.592* 0.095 0.402* 0.122 0.320* 0.073 0.251* 0.050 2845
Netherlands 0.510* 0.105 0.176* 0.067 0.174* 0.078 -0.056 0.070 0.319* 0.045 2750
Norway 0.732* 0.162 0.113* 0.069 0.178* 0.076 0.020 0.059 0.336* 0.043 3214
Poland 0.517* 0.176 0.134* 0.082 0.456* 0.099 0.237* 0.079 0.582* 0.092 3046
Russian Fed 0.342 0.242 -0.004 0.181 0.284 0.192 0.345** 0.223 0.314 0.198 1453
Slovak Rep 0.539* 0.088 0.390* 0.097 0.460* 0.092 0.361* 0.124 0.427* 0.062 1974
Spain 0.784* 0.145 0.637* 0.125 0.526* 0.095 0.434* 0.118 0.402* 0.061 1941
Sweden 0.524* 0.105 0.278* 0.095 0.233* 0.068 0.116 0.092 0.291* 0.063 2631
UK 0.763* 0.119 0.179* 0.079 0.246* 0.067 0.109 0.094 0.393* 0.058 4350
US 0.357* 0.100 0.150* 0.056 0.296* 0.068 -0.026 0.068 0.348* 0.051 2735
Average 0.565* 0.027 0.305* 0.019 0.345* 0.019 0.167* 0.021 0.387* 0.015 73410