The purpose of this statistical release is to present basic provisional enrolment figures for schools and for children in funded pre-school education for 2014/15.
Key points:
There are 165,548 pupils in primary schools (years 1-7), and this continues to increase even though there are fewer primary schools.
In total 142,547 pupils are enrolled in post-primary schools, showing a decline for the fourth year in a row. This decrease is witnessed in enrolments to non-grammar schools, but grammar school enrolments remain stable. Enrolments of pupils in sixth form, however, continue to rise.
There has been a substantial increase in the
proportion of post-primary schools pupils that are entitled to free school meals from 19% to 26% among post-primary pupils. This is likely to be as a result of extension of the Working Tax Credit free school meal criterion to post-primary pupils.
9 December 2014
Coverage: Northern Ireland
Frequency: Annual
Theme: Children, Education and Skills
Issued by:
Statistics & Research Team Department of Education Rathgael House
Balloo Road Rathgill
BANGOR BT19 7PR
Telephone Press Office: 028 9127 9701
Statistics & Research Team: 028 9127 9717
Statistician: Paul Matthews
Email: [email protected]
Internet
http://www.deni.gov.uk/index/ facts-and-figures-new.htm
Statistical Bulletin
Enrolments at grant-aided schools 2014/15:
2 Contents
Section Title Page
Introduction 3
1 Schools in Northern Ireland 3
2 Enrolments in schools in Northern Ireland 5
3 Pupils entitled to free school meals 8
3 Introduction
The data in the following bulletin are taken from the school enrolments census, which was conducted in October 2014. Data collected through the school census exercise are used to inform Departmental policy development, implementation and evaluation.
This first release of the basic statistics contains information which is used in the process to allocate funding to schools. These figures are provisional and subject to change. A further statistical release, containing a more detailed set of tables based on finalised and validated data, will be published in February 2015.
Section 1: Schools in Northern Ireland
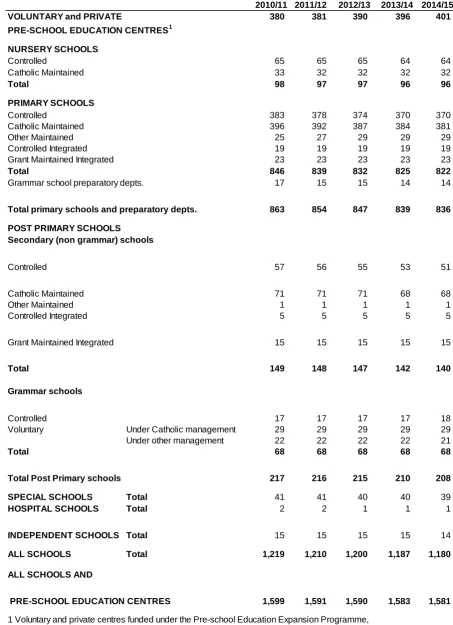
• The numbers of schools in Northern Ireland continues to decrease, from 1,219 in
2010 to 1,180 in 2014 (Table 1).
o In October 2014, there were 836 primary schools (including preparatory
departments), a decrease of 27 since October 2010.
o The number of post-primary schools was 208, compared to 217 in 2010.
This decrease is accounted for by a drop in the number of non-grammar schools (Table 1).
• However, the number of voluntary and private pre-school centres continues to
4
Table 1: Number of Schools and Pre-school Education Centres by Management Type
2010/11 2011/12 2012/13 2013/14 2014/15
VOLUNTARY and PRIVATE 380 381 390 396 401
PRE-SCHOOL EDUCATION CENTRES1 NURSERY SCHOOLS Controlled 65 65 65 64 64
Catholic Maintained 33 32 32 32 32
Total 98 97 97 96 96
PRIMARY SCHOOLS Controlled 383 378 374 370 370
Catholic Maintained 396 392 387 384 381
Other Maintained 25 27 29 29 29
Controlled Integrated 19 19 19 19 19
Grant Maintained Integrated 23 23 23 23 23
Total 846 839 832 825 822
Grammar school preparatory depts. 17 15 15 14 14
Total primary schools and preparatory depts. 863 854 847 839 836
POST PRIMARY SCHOOLS Secondary (non grammar) schools Controlled 57 56 55 53 51
Catholic Maintained 71 71 71 68 68
Other Maintained 1 1 1 1 1
Controlled Integrated 5 5 5 5 5
Grant Maintained Integrated 15 15 15 15 15
Total 149 148 147 142 140
Grammar schools Controlled 17 17 17 17 18
Voluntary Under Catholic management 29 29 29 29 29
Under other management 22 22 22 22 21
Total 68 68 68 68 68
Total Post Primary schools 217 216 215 210 208
SPECIAL SCHOOLS Total 41 41 40 40 39
HOSPITAL SCHOOLS Total 2 2 1 1 1
INDEPENDENT SCHOOLS Total 15 15 15 15 14
ALL SCHOOLS Total 1,219 1,210 1,200 1,187 1,180 ALL SCHOOLS AND
PRE-SCHOOL EDUCATION CENTRES 1,599 1,591 1,590 1,583 1,581
5 Section 2: Enrolments in schools in Northern Ireland
• The total number of pupils in all schools in October 2014 was 337,908. This has
steadily increased over the last four years (Table 2).
• Much of this increase is attributable to the rise in the number of pupils in
compulsory primary school education (Figure 1). In October 2014 the total number of year 1-7 pupils was 165,548 (Table 2). This has risen by almost 10,000 pupils compared to three years ago even though there are now 18 fewer primary schools. There are almost 3,300 more year 1-7 pupils compared with last year. The
increase observed is in line with the rise in the number of 4-10 year olds in NISRA’s
population estimates over the last three years1.
1
http://www.nisra.gov.uk/archive/demography/population/midyear/NI_sya(1961_2013).xls
130,000 135,000 140,000 145,000 150,000 155,000 160,000 165,000 170,000
2005/06 2006/07 2
0
0
7
/0
8
2008/09 2009/10 2010/11 2011/12 2012/13 2013/14 2
0
1
4
/1
[image:5.595.78.522.357.672.2]5
Figure 1 - Enrolments in primary and post-primary schools in Northern Ireland 2005/06 - 2014/15
6
• By contrast, enrolments in post-primary schools continue to decline. The number of
pupils in post-primary schools was 142,547, and this has dropped by more than 5,000 pupils in the last four years (Figure 1). Again this mirrors the decrease seen in NISRA’s population estimates in the same period. This trend only exists in secondary (non-grammar) schools; grammar school enrolments have remained stable in recent years (Table 2).
• However, this overall decline in post primary pupils masks a continual increase in
the number of post Year 12 pupils. Enrolments have risen by almost 2,000 in the last four years (29,288 in 2010/11 to 31,265 in 2014/15).
• The number of children in funded pre-school education, that is reception classes,
nursery schools and units, or voluntary and private pre-school centres, was 23,995. This has steadily increased by around 1,500 pupils in the last four years, and by almost 500 pupils in the last year alone. Much of this increase is attributable to the rise in pupils in voluntary and private pre-school education centres and nursery classes within primary schools.
• Special school enrolments have also gradually increased, rising by around 600
pupils in the last four years to 5,063 in 2014/15.
0 5,000 10,000 15,000 20,000 25,000 30,000
[image:6.595.75.523.461.770.2]2005/06 2006/07 2007/08 2008/09 2009/10 2010/11 2011/12 2012/13 2013/14 2014/15
Figure 2 - Enrolments in special schools and funded pre-school education in Northern Ireland 2005/06 - 2014/15
7 2010/11 2011/12 2012/13 2013/14 2014/15
VOLUNTARY and PRIVATE
PRE-SCHOOL EDUCATION CENTRES1 7,599 8,149 8,410 8,360 8,621
NURSERY SCHOOLS
Full-time 4,033 3,981 3,986 3,983 4,000
Part-time 1,873 1,930 1,924 1,869 1,882
Total nursery school pupils 5,906 5,911 5,910 5,852 5,882
PRIMARY SCHOOLS and PREPARATORY DEPARTMENTS
Nursery class pupils
Full-time 4,786 5,106 5,070 5,110 5,183
Part-time 3,649 3,502 3,633 3,842 3,981
Total nursery class pupils3 8,435 8,608 8,703 8,952 9,164
Primary: reception 491 444 417 343 328
Grammar preparatory: reception3 - - - -
-Total reception pupils 491 444 417 343 328
Primary schools (year 1 - 7) 152,333 153,740 157,082 160,453 163,735
Grammar school preparatory depts. (year 1 - 7) 2,119 1,954 1,832 1,800 1,813
Total year 1 - 7 pupils 154,452 155,694 158,914 162,253 165,548
Total primary pupils 163,378 164,746 168,034 171,548 175,040
POST PRIMARY SCHOOLS
Secondary (non grammar) schools 85,769 84,193 83,059 81,339 79,836
Grammar schools 62,133 62,554 62,599 62,634 62,711
Total post primary pupils 147,902 146,747 145,658 143,973 142,547
SPECIAL SCHOOLS2 Total 4,458 4,549 4,653 4,832 5,063
HOSPITAL SCHOOLS Total 200 191 78 72 112
INDEPENDENT SCHOOLS Total 631 681 687 688 643
ALL SCHOOLS Total 322,548 322,891 325,020 326,965 329,287
ALL SCHOOLS AND
PRE-SCHOOL EDUCATION CENTRES 330,147 331,040 333,430 335,325 337,908
1. Voluntary and private centres funded under the Pre-school Education Expansion Programme, which began in 1998/99.
[image:7.595.64.521.108.656.2]3. Nursery and reception pupils who are enrolled in preparatory departments of grammar schools have not been included as they are not funded by the Department.
Table 2: Number of Pupils in Schools and Children in Funded Pre-school Education by Type of Establishment attended
8 Section 3: Pupils entitled to free school meals2
• Based on provisional data, the percentage of children in schools entitled to free
school meals has risen from 26% last year to 30% this year (Table 3).
• This main reason for this increase is the sharp rise in post-primary pupils that are
free school meal entitled, increasing from 19% to 26%. The proportion of non-grammar pupils that are free school meals entitled has risen by ten percentage points to 37% this year. Entitlement increases by five percentage points to 12% among grammar school pupils (Table 3).
• This increase is likely to relate to the extension of the Working Tax Credit free
school meal criterion to post-primary pupils in September 20143. By comparison,
when entitlement was extended for primary school pupils in 2009/10 and 2010/11, the proportion of pupils entitled to free school meals increased from 19% (in 2009/10) to 27% (in 2011/12).
2
http://www.deni.gov.uk/index/support-and-development-2/5-schools_meals/school-milk-and-meals.htm
3 Eligibility under the Working Tax Credit free school meal criterion was introduced on a phased basis with
9
Table 3: Percentage of Childen Entitled to Free School Meals1, 4 , 5 by Type of Establishment attended 2010/11 2011/12 2012/13 2013/14 2014/15 VOLUNTARY and PRIVATE 11% 10% 10% 11% 11% PRE-SCHOOL EDUCATION CENTRES1, 2
NURSERY SCHOOLS 1
Full-time 39% 43% 45% 45% 48%
Part-time 9% 9% 8% 9% 11%
All nursery schools 29% 32% 33% 35% 36% PRIMARY SCHOOLS
Nursery class pupils 1, 4
Full-time 34% 36% 38% 43% 42%
Part-time 10% 11% 12% 11% 12%
Total nursery class pupils6 24% 26% 28% 30% 29%
Primary: reception 12% 13% 12% 17% 18%
Grammar preparatory: reception6 - - - - 0%
Total reception pupils 12% 13% 11% 17% 18%
Primary schools (year 1 - 7) 22% 27% 30% 31% 32%
Grammar school preparatory depts. (year 1 - 7) 0% 1% 1% 1% 1%
Total year 1 - 7 pupils 22% 27% 30% 31% 32% Total primary pupils 22% 27% 30% 31% 32% POST PRIMARY SCHOOLS
Secondary (non grammar) schools 26% 27% 28% 27% 37%
Grammar schools 7% 7% 7% 7% 12%
TOTAL POST PRIMARY PUPILS 18% 18% 19% 19% 26%
SPECIAL SCHOOLS na na 51% 51% 53%
ALL SCHOOLS3 Total 20% 23% 25% 26% 30% TOTAL SCHOOLS AND
PRE-EDUCATION CENTRES 20% 23% 25% 25% 29%
Seeker's allowance or Income Support is used instead of free school meal entitlement.
6. Nursery and reception pupils who are enrolled in preparatory departments of grammar schools have not been included as they are not funded by the Department.
4. Eligibility under the Working Tax Credit free school meal criterion was introduced on a phased basis with Nursery, Foundation Stage and Key Stage 1 pupils eligible from September 2010 and Key Stage 2 pupils eligible from September 2011. It was extended to post-primary pupils from September 2014.
1. For pupils and children in the nursery sector and in voluntary and private pre-school centres, where free school meal entitlement data is not appropriate, the number of pupils with (a) parent(s) in receipt of Job
2 Voluntary and private centres funded under the Pre-school Education Expansion Programme, which began in 1998/99.
3. Free school meal entitlement data is not collected for pupils at hospital schools. Figures for special schools and independent schools are not validated.
10 Notes for readers
National Statistics
1. The United Kingdom Statistics Authority has designated these statistics as National
Statistics, in accordance with the Statistics and Registration Service Act 2007 and signifying compliance with the Code of Practice for Official Statistics.
Designation can be broadly interpreted to mean that the statistics:
• meet identified user needs;
• are well explained and readily accessible;
• are produced according to sound methods, and
• are managed impartially and objectively in the public interest.
Once statistics have been designated as National Statistics it is a statutory requirement that the Code of Practice shall continue to be observed.
2. For general enquiries about National Statistics, contact the National Statistics Public
Enquiry Service on 0845 601 3034 minicom: 01633 812399
E-mail: [email protected] Fax: 01633 652747
Letters: Customer Contact Centre, Office for National Statistics, Rm 1.101, Government Buildings, Cardiff Road, Newport, NP10 8XG
3. You can also find National Statistics on the Internet: http://www.statistics.gov.uk
School Census
4. The statistics in this release have been derived from the annual School Census;
details about the survey may be found at
http://www.deni.gov.uk/census_description_for_web_14_15_r1.docx. For voluntary and private pre-school centres, and nursery schools, the census consists of a paper return comprising a number of tables; for post-primary, primary and special schools, it consists of a return comprising individual pupil records, made by Electronic Data Interchange.
5. The 2014/15 figures in this statistical release are based on information as at 10
October 2014. They may be subject to minor revision and these will be notified in accordance with our revisions policy. This can be accessed at
11
6. The figures for nursery classes relate to approved nursery classes in primary schools.
The figures for reception refer to pupils who were below compulsory school age at 1st July 2014, who were admitted to a reception class or group in primary school following
their 4th birthday. Schools may admit reception pupils throughout the year, but only
those who have been admitted by 31st October are counted in the school census.
7. Further statistics relating to school numbers and enrolments can be found on the DE
website (www.deni.gov.uk) under the Facts and Figures section.
The DE website presents figures taken from the school census, summarised at regional, Education and Library Board and school level. Statistics on pupil
attendance, pupil: teacher ratios, school leaver destinations and qualifications may also be accessed via the website.
8. Information on enrolments collected via the school census process are used to inform DE policy and procedures (particularly School Funding), as well as to inform Education and Library Boards (ELBs) of detailed information useful to them in their auditing processes.
Further enquiries
Request for further information should be addressed to:- Paul Matthews
Statistics and Research Team Department of Education Rathgael House
Balloo Road Rathgill BANGOR Co. Down BT19 7PR
Telephone (028) 9127 9717/ Fax (028) 9127 9594 e-mail: [email protected]
Special analyses of the school census can be undertaken on request.
Press enquiries should be made to the Department’s Press Office at the same address, telephone (028) 9127 9207 / fax (028) 9127 9271.
Feedback on this publication can be provided directly to Paul Matthews (contact details above) or via the feedback questionnaire on our website.