Aerosols by Mass Spectrometry
Thesis by Jason Douglas Surratt
In Partial Fulfillment of the Requirements For the Degree of
Doctor of Philosophy
California Institute of Technology Pasadena, California
2010
© 2010
Acknowledgements
I owe my sincerest gratitude to so many people who have instilled in me the inspiration, the desire, the knowledge, the work ethic, and the intellectual interest to successfully pursue a PhD. First, I am forever grateful to Professor Kay Sandberg at North Carolina State University for inspiring me to develop an extreme interest and enthusiasm for studying chemistry that I had not yet recognized earlier in my life.
encouraging me to apply for graduate school. I feel extremely fortunate to have been given the opportunity to work in Professor Tolbert’s lab as an undergraduate, as her lab generated within me an enthusiasm and deep interest in studying the chemistry of atmospheric aerosols.
publications that are central to my PhD Thesis. Additionally, these outside collaborations have created friendships and ongoing-working relationships with other known colleagues in our research field. With John’s unfaltering support and understanding, he has helped me to achieve my research and career goals. What is so amazing about John is even though I will start as a faculty member at the University of North Carolina at Chapel Hill later this year, he is still continuing to make sure I go down the right path and helping me find research opportunities that will potentially lead to my future success. I will always be forever grateful to John and I hope he knows how much I appreciate him taking a chance on me and allowing for me to join his lab.
I am extraordinarily lucky to have been part of such a friendly, collaborative, open-minded, hardworking, enthusiastic, and supportive research group. I have so many past and present group members to thank, especially those who have helped to make my experience at Caltech enjoyable on both the personal and scientific research levels, which includes: Song Gao, Nga (i.e., Sally) Lee Ng, Jesse Kroll, Arthur Chan, ManNin Chan, Shane Murphy, Kathryn (i.e., Beth) Kautzman, Puneet Chhabra, Armin Sorooshian, Harmony Gates, Roya Bahreini, Melita Keywood, Tomtor Varutbangkul, Tracey Rissman, Tim VanReken, Jill Craven, Christine Loza, Scott Hersey, Lindsay Yee, Andrew Metcalf, Lea Hildebrandt, Xerxes Lopez-Yglesias, Jason Gamba, Andy Downard, and Adam Olsen. I would also like to thank the “modelers” of the group, Daven Henze, Havala Pye, Anne Chen, Candy Tong, Amir Hakami, Julia, Lu, and Andi Zuend for their friendship and continued support. I especially want to thank Puneet for also being my roommate the last few years. Not only is he a great work colleague, he is also a wonderful and supportive friend and roommate. I hope he knows how much I appreciate him putting up with me the last few years. I also need to give a “special thanks” to Xerxes. He is not only a wonderful colleague, but also a very good and loyal friend. In fact, three days before my PhD thesis was due to the graduate office, my computer completely died on me. Without his help, my thesis would not have been submitted on time.
science. My close collaboration with Arthur also played a large role in the development of my PhD thesis to be presented. I want to also thank here ManNin Chan for being my partner in crime with the filter sampling efforts and their detailed chemical characterization the last two years. Even though I have been training him on how to apply several different mass spectrometry techniques, he is an extremely talented graduate student that I have also learned a lot of science from.
In addition to the Seinfeld research group, I am extremely grateful to Professor Paul Wennberg and his research group members, which includes John Crounse, Alan Kwan, Fabien Paulot, Melinda Beaver, Jason St. Clair, and Nathan Eddingsaas for their close collaboration, friendship, and support during the final years of my PhD. Paul and his group members were very open to collaborating with us during my PhD. Our collaboration was exciting, open, and very friendly, and I will always be incredibly thankful for having the opportunity to work so closely with Paul and his research group. Our recent work on isoprene has been so fun and exciting and I really feel lucky to have gained more knowledge from Paul and his lab on measuring reactive gas-phase species produced from the oxidation of isoprene. I am especially thankful to Nathan Eddingsaas for helping me gain a better understanding and appreciation for measuring reactive gas-phase species alongside detailed particle-gas-phase chemical measurements.
scientists and I hope they know I learned so much from them. I will always be forever grateful for the knowledge they bestowed upon me during our collaboration, and also how to think more outside-of-the-box. Their perspective on aerosol formation and how this relates to policy issues was truly inspirational and educational for me. The work we did together also played a major role in the development of my PhD thesis and I hope they all know how much I appreciate their valuable time, support, guidance, and friendship.
I am eternally grateful to Mona Shahgohli, the Director of the Chemistry Mass Spectrometry Facility, for her patience, guidance, training and support in helping me to develop are more in-depth understanding of mass spectrometry and how it might apply to the challenges I faced during my research. I also thank Mona for her unwavering friendship, trustworthiness, encouragement, and acceptance. Without her friendship and collaboration, my training as an independent research chemist would have not been complete. I also want to thank Nathan Dalleska, the Director of the Environmental Science and Engineering Mass Spectrometry Facility, for his constant support, help, and training on his GC/MS instruments. I also think Nathan for his friendship, encouragement, and also always willing to chat with me about science and just “life.”
annually into the troposphere, leads to secondary organic aerosol (SOA). Our research community did not previously consider isoprene as a precursor for SOA formation owing to the known-volatility of its oxidation products. Her initial findings played a major role in design and development of the research projects I worked on during my PhD thesis. Our strong and friendly collaboration resulted in many ways by “chance” or “luck-of-the-draw,” which to this day is incredibly humbling to me. Magda met Shane Murphy from my research group during an international aerosol conference that took place in Ghent, Belgium. Thankfully, Magda approached Shane after his well-presented talk to see if we had isoprene aerosol filter samples from our chamber experiments that she could analyze with her GC/MS technique. Since I am considered the “aerosol filter guy” in the laboratory, Shane put her in contact with me. The timing of her contact with me was absolutely perfect since I had already been working extensively on the detailed chemical characterization of the laboratory-generated isoprene SOA under low- and high-NOx
for science, kindness, and friendship have all played a major role in my development as an independent research scientist. I will always be forever grateful to her for working with me so openly, discussing research ideas so thoroughly, allowing me opportunities to visit her lab and working with her Post-Docs and graduate students, and finally for personally showing me her beautiful country in Belgium and for accepting me for whom I am. I want to also specifically thank her past and current research group members for the enjoyable and very productive research collaboration: Rafal Szmigielski, Katarzyna Szmigielska, Yadian Gómez-González, Reinhilde Vermeylen, and Ivan Kourtchev. Lastly, I also want to thank Magda’s husband Willy Maenhaut for his continued research collaboration, support, guidance, mentorship and friendship.
Abstract
Although secondary organic aerosol (SOA) makes up a substantial fraction of the
organic mass observed in tropospheric fine particulate matter, there remain significant uncertainties in the true impact of atmospheric aerosols on climate and health due to the lack of full knowledge of the sources, composition, and mechanisms of formation of SOA. This thesis demonstrates how the detailed chemical characterization of both laboratory-generated and ambient organic aerosol using advanced mass spectrometric techniques has been critical to the discovery of previously unidentified sources (i.e., role heterogeneous chemistry) of SOA.
The focal point of this thesis is given to the detailed chemical characterization of isoprene SOA formed under both high- and low-NOx conditions. Until recently, the
formation of SOA from isoprene, the most abundant non-methane hydrocarbon emitted into the troposphere, was considered insignificant owing to the volatility of its oxidation products. In conjunction with the chemical characterization of gas-phase oxidation products, we identify the role of two key reactive intermediates, epoxydiols of isoprene (IEPOX) and methacryloylperoxynitrate (MPAN), that are formed during isoprene oxidation under low- and high-NOx conditions, respectively. Increased uptake of IEPOX
by acid-catalyzed particle-phase reactions is shown to enhance low-NOx SOA formation.
The similarity of the composition of SOA formed from the photooxidation of MPAN to that formed from isoprene and methacrolein demonstrates the role of MPAN in the formation of isoprene high-NOx SOA. More specifically, the further oxidation of MPAN
in the presence of anthropogenic pollutants could be a substantial source of “missing urban SOA” not included in current SOA models.
Increased aerosol acidity is found to result in the formation of organosulfates, which was a previously unrecognized source of SOA. By comparing the tandem mass spectrometric and accurate mass measurements collected for both the laboratory-generated and ambient aerosol, previously uncharacterized ambient organic aerosol components are found to be organosulfates of isoprene, α-pinene, β-pinene, and
Table of Contents
Dedication………..iii
Acknowledgements………...iv
Abstract………....xiv
List of Tables……….xxiv
List of Figures………xxvi
List of Schemes………...l Chapter 1: Introduction………...1
1.1 Background and Motivation………....2
1.2 Organization of Thesis……….4
1.3 References………..10
Chapter 2: Chemical Composition of Secondary Organic Aerosol Formed from the Photooxidation of Isoprene……….13
2.1 Abstract………..14
2.2 Introduction………15
2.3 Experimental Section……….17
2.3.1 Chamber Experiments………...17
2.3.2 Filter Extractions………...19
2.3.3 Liquid Chromatography / Electrospray Ionization – Mass Spectrometry…19 2.3.4 ESI – Ion Trap Mass Spectrometry………...21
2.3.5 Matrix Assisted Laser Desorption Ionization – Time of Flight Mass Spectrometer………..22
2.3.7 Aerodyne Time of Flight Aerosol Mass Spectrometer……….23
2.3.8 Gas Chromatography / Mass Spectrometry………..23
2.3.9 Gas Chromatography – Flame Ionization Detection………25
2.3.10 Total Aerosol Peroxide Analysis………26
2.3.11 Particle-Into-Liquid Sampler Coupled to Ion Chromatography………….26
2.4 Results………27
2.4.1 High-NOx Condition……….28
2.4.2 Low-NOx Condition………..35
2.5 Discussion………..41
2.5.1 Gas-Phase Chemistry………41
2.5.2 High-NOx SOA……….43
2.5.2.1 Importance of MACR Oxidation………...43
2.5.2.2 Oligomers………..43
2.5.2.3 Organic Nitrates………44
2.5.2.4 2-MG as Monomeric Units………....45
2.5.2.5 Mono-Acetate and Mono-Formate Oligomers………..46
2.5.2.6 Heterogeneous Esterification Reactions………47
2.5.2.7 Additional Routes for SOA Formation……….52
2.5.3 Low-NOx SOA………..54
2.5.3.1 Hydroperoxides: Key Component to SOA Formation……….54
2.5.3.2 Oligomerization……….56
2.5.3.4 Formation Mechanism of Low-NOx SOA products Observed by
GC/MS………...58
2.5.3.5 Evolution of SOA Composition………59
2.5.3.6 Tracer Compounds for Isoprene Oxidation in the Remote Atmosphere………...60
2.6 Conclusions………61
2.7 Acknowledgements………63
2.8 References………..64
Chapter 3: Evidence for Organosulfates in Secondary Organic Aerosol…………..97
3.1 Abstract………..98
3.2 Introduction………99
3.3 Experimental Section………...100
3.3.1 Isoprene Chamber Experiments………..100
3.3.2 α-Pinene Chamber Experiments……….102
3.3.3 Ambient Aerosol Collection………...102
3.3.4 Filter Extraction and Chemical Analyses………...103
3.4 Results………..104
3.4.1 Sulfate Ester Standards………...104
3.4.2 Sulfate Esters from Isoprene Oxidation………..104
3.4.3 Sulfate Esters from α-Pinene Oxidation……….108
3.4.4 Sulfate Esters in Ambient Aerosol………..109
3.4.5 ESI-MS Quality Control Tests………110
3.5.1 Sulfate Esterification Reaction Mechanism………111
3.5.2 Isoprene Sulfate Esters and the role of NOx………...113
3.5.3 Atmospheric Implications………...…113
3.6 Acknowledgements………..114
3.7 Literature Cited………115
Chapter 4: Effect of Acidity on Secondary Organic Aerosol Formation from Isoprene………...131
4.1 Abstract………....132
4.2 Introduction………...133
4.3 Experimental Section………...134
4.3.1 Chamber Procedures………..…….134
4.3.2 Glass Fiber Filter Extraction and Organic Analysis………...137
4.3.3 Teflon Filter Extractions and [H+] air Determination………...138
4.4 Results………..138
4.5 Discussion………....143
4.5.1 Acidity and Particle-Phase Reactions……….143
4.5.2 Atmospheric Implications………...144
4.6 Acknowledgements………..145
4.7 Literature Cited………....146
Chapter 5: Organosulfate Formation in Biogenic Secondary Organic Aerosol….161 5.1 Abstract………....162
5.2 Introduction………..163
5.3.1 Chamber Experiments……….…167
5.3.2 Chamber Filter Sample Collection and Extraction Protocols……….170
5.3.3 Ambient Aerosol Sample Collection and Extraction Protocols…………..172
5.3.4 Ultra-Performance Liquid Chromatography/Electrospray Ionization – Time- of-Flight High-Resolution Mass Spectrometry………....173
5.3.5 High-Performance Liquid Chromatography/Electrospray Ionization – Linear Ion Trap Mass Spectrometry………175
5.4 Atmospheric Significance of Organosulfates………..176
5.5 Laboratory-Generated Organosulfates……….179
5.5.1 Monoterpene Oxidation Experiments……….………179
5.5.2 Isoprene Oxidation Experiments………...……182
5.6 Organosulfates in Ambient Aerosol……….……183
5.6.1 Organosulfates of Monoterpenes in Ambient Aerosol………...……184
5.6.1.1 m/z 294………...……184
5.6.1.2 m/z 296………...………191
5.6.1.3 m/z 249………...………196
5.6.1.4 m/z 227………...……200
5.6.1.5 m/z 279………...………202
5.6.1.6 m/z 310………...……204
5.6.1.7 m/z 373………...………205
5.6.1.8 Uncharacterized organosulfates detected at m/z 239, 281, 324, 326, 342, and 387 in SEARCH samples likely attributable to monoterpenes…...207
5.6.2.1 m/z 244………...………211
5.6.2.2 m/z 305………...………212
5.6.2.3 m/z 333 and 331………...……214
5.6.2.4 Other Organosulfates of Isoprene detected at m/z 155, 169, 211, 213 and 260………...………217
5.7 Conclusions………..……220
5.8 Acknowledgements………..………221
5.9 References………....………223
Chapter 6: Reactive Intermediates Revealed in Secondary Organic Aerosol Formation from Isoprene ……….……313
6.1 Abstract………314
6.2 Introduction………..315
6.3 Results and Discussion………...………316
6.3.1 Isoprene SOA Formation under Low-NOx Conditions: Role of Aerosol Acidity………..316
6.3.2 Identification of IEPOX as the Intermediate Responsible for Acid-Enhanced Isoprene SOA………...319
6.3.3 Mechanism of Isoprene SOA Formation under Low-NOx Conditions…...322
6.3.4 Isoprene SOA Formation under High-NOx Conditions: Role of MPAN...323
6.3.5 Identification of MPAN as Key Intermediate in Formation of SOA from Isoprene and MACR………325
6.5 Materials and Methods……….………329 6.5.1 Experimental Details………...329 6.5.2 Gas-Phase Measurements………..…….330 6.5.3 Aerosol-Phase Measurements………...………330 6.5.4 Materials……….…330 6.6 Acknowledgments………331 6.7 Supporting Information………...….332 6.7.1 Experimental Details of Chamber Operation………..……332 6.7.1.1 Low-NOx Experiments………..….332
6.7.1.2 High-NOx Experiments………..………332
6.7.2 Procedures to Confirm Purity of MPAN………....332 6.7.3 Details of the CIMS Technique………..332 6.7.3.1 Operating Conditions……….332 6.7.3.2 Correction of the MS/MS Daughter Ion Signal Associated to
IEPOX...333 6.7.4 Filter Extraction and Operation Protocols for the GC/EI-MS
Technique…...334 6.7.5 Materials...335
7.2 References...365 Appendix...367 Appendix A: Characterization of 2-Methylglyceric Acid Oligomers in Secondary
Organic Aerosol Formed from the Photooxidation of Isoprene using Trimethylsilylation and Gas Chromatography/Ion Trap Mass
Spectrometry………..368 Appendix B: Characterization of Polar Organic Components in Fine Aerosols in
the Southeastern United States: Identity, Origin, and Evolution….385 Appendix C: Characterization of Organosulfates from the Photooxidation of
Isoprene and Unsaturated Fatty Acids in Ambient Aerosol using Liquid Chromatography/(–)Electrospray Ionization Mass
Spectrometry………..413 Appendix D: Secondary Organic Aerosol (SOA) Formation from Reaction of
Isoprene with Nitrate Radicals (NO3)………..426
Appendix E: 3-Methyl-1,2,3-Butanetricarboxylic Acid: An Atmospheric Tracer for Terpene Secondary Organic Aerosol………...451 Appendix F: Chemical Composition of Gas- and Aerosol-Phase Products from the
List of Tables
Table 2.1. High-NOx chamber experiments conducted………68
Table 2.2. Quantified SOA products (in ng m-3) from High-NOx chamber
experiments...69 Table 2.3. Low-NOx chamber experiments conducted………...70
Table 2.4. Low-NOx isoprene SOA products elucidated by GC/MS………...71
Table 3.1. Summary of experimental conditions and sulfate ester formation from
isoprene photooxidation……….121 Table 3.2. Summary of experimental conditions and sulfate ester formation from
α-pinene photooxidation………122
Table 3.3. Proposed isoprene sulfate ester SOA products………..123 Table 3.4. Proposed α-pinene sulfate ester SOA products………...124
Table 4.1. Input conditions for isoprene/NO four-stage steady-state photooxidation experiment………..153 Table 4.2. Steady-state concentrations of gas-phase compounds………...154 Table 4.3. Reacted isoprene and steady-state particle-phase concentrations………...155 Table 5.1. Biogenic volatile organic compounds studied………...230 Table 5.2. Summary of experimental conditions and organosulfate formation from
monoterpene oxidation chamber experiments………...231 Table 5.3. Organosulfates of α-pinene………...232
Table 5.6. Organosulfates of γ-terpinene………....239
Table 5.7. Organosulfates of terpinolene………....240 Table 5.8. Organosulfates of β-pinene………....241
Table 5.9. Organosulfates of isoprene………242 Table 5.10. Organosulfates observed in southeastern U.S. aerosol………....245 Table 6.1. High-NOx MPAN SOA Constituents………...…340
Table 6.2. Summary of experimental conditions for low-NOx experiments……..……342
List of Figures
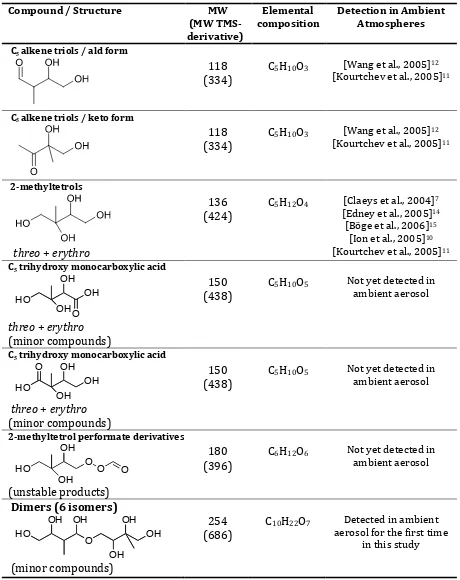
Figure 2.1. ESI-ITMS negative mode spectra collected via direct infusion analyses. (a) MS scan of a filter extract obtained from a 500 ppb isoprene, high-NOx,
seeded experiment. (b) MS scan of a filter extract obtained from a 500 ppb MACR, high-NOx, seeded experiment. These mass spectra show that MACR
oxidation produces many of the same SOA products as that of isoprene oxidation under high-NOx conditions. Common 102 Da differences between
ions in both spectra are observed indicating the presence of oligomers……72 Figure 2.2. MALDI positive mode spectrum obtained with a graphite matrix for a 500
ppb isoprene, high-NOx, dry seeded experiment (Experiment 9). Highlighted
Na+ adduct ions confirm the existence of the species detected by ESI…….73 Figure 2.3. (a) LC/MS TIC of a filter extract from a 500 ppb isoprene, high-NOx,
nucleation experiment. (b) LC/MS TIC of a filter extract from a 500 ppb MACR, high-NOx, nucleation experiment. The similar retention times and
mass spectra associated with each chromatographic peak in these two TICs indicate that MACR is an important SOA precursor from isoprene oxidation under high-NOx conditions. (c), (d), and (e) are LC/MS EICs of organic
nitrate species common to both MACR and isoprene high-NOx samples.
Figure 2.4. (a) Mass spectrum for the largest chromatographic peak (RT = 15.7 min) from Figure 2.3d (EIC of m/z 368 ion). (b) Upfront CID mass spectrum for the same chromatographic peak in Figure 2.3d (EIC of m/z 368 ion). The neutral losses observed in the upfront CID mass spectrum are associated with a trimeric organic nitrate species. This fragmentation pattern of m/z 368 is consistent with ion trap MS/MS results. The product ion m/z 266
corresponds to a neutral loss of 102 Da (common to all MS techniques), the product ion m/z 291 corresponds to a neutral loss of 77 Da (likely CH3
radical and NO3 radical, CH3NO3), the product ion m/z 305 corresponds to a
neutral loss of 63 Da (likely HNO3), the product ion m/z 203 corresponds to a
neutral loss of 165 Da, and the product ion m/z 164 corresponds to a neutral loss of 204 Da (two losses of common monomer)……….75 Figure 2.5. TOF-AMS spectra collected at low vaporizer temperatures for the following
high-NOx chamber experiments: (a) 50 ppb isoprene, 250 ppb NOx, H2O2 as
the OH precursor, no seed; (b) 500 ppb MACR, 800 ppb NOx, H2O2 as the
OH precursor, with seed; and (c) 500 ppb isoprene, HONO as the OH precursor, no seed. These spectra indicate that the OH precursor does not have a substantial effect on the chemistry observed, that MACR is an important SOA precursor from isoprene oxidation, and that the 102 Da differences observed in the offline mass spectrometry data are not a result of sample workup or ionization artifacts………....76 Figure 2.6. (a) TIC of a high-NOx isoprene nucleation experiment (Experiment 5)
residue (RT = 29.08 min). (c) EI mass spectrum for a linear dimer made up of two 2-MG residues (RT = 51.59 min). These two mass spectra confirm that 2-MG is present in high-NOx SOA and that it is involved in
particle-phase esterification reactions resulting in polyesters (as shown by the dimer structure above)………..77 Figure 2.7. MALDI positive mode spectrum obtained with a graphite matrix for a 500
ppb isoprene, low-NOx, acid seeded experiment (Experiment 14).
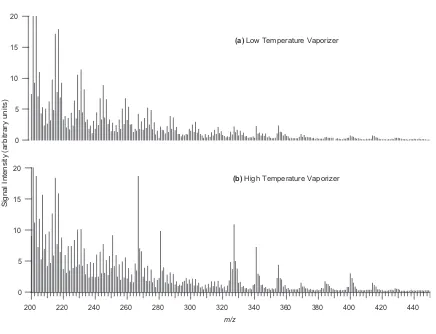
High-molecular mass species formed up to ~ 620 Da……….79 Figure 2.8. TOF-AMS spectra for a 500 ppb isoprene low-NOx experiment (Experiment
12). (a) Mass spectrum obtained with a low temperature vaporizer (~ 150ºC). (b) Mass spectrum obtained with a high temperature vaporizer (~ 600ºC). The spectrum is richer at higher temperature with some prominent peaks at higher m/z, indicating that the high-MW oligmers that are not easily
volatilized at < 200ºC………...80 Figure 2.9. Time evolution plots produced from the TOF-AMS instrument for selected
fragment ions and the total organic mass observed from a typical low-NOx
experiment (Experiment 13). All ion signal intensities are divided by the signal intensity of sulfate. Because sulfate concentration is a tracer for wall loss (neither created nor removed during the run), the ratio of ion signal to sulfate signal should give an indication of the behavior without wall loss. (a) Time evolution plot for high-mass fragment ions m/z 247 and 327. (b) Time evolution plot for the proposed peroxide fragment ion m/z 91 (C3H7O3),
total organic mass. These plots indicate that the chemical composition changes with experimental time, where the decomposition of organic peroxides correlates to oligomerization within low-NOx SOA. The missing
data points (11:30 to 12:00 hours) in these plots are due to the vaporizer in the TOF-AMS instrument being turned off………....81 Figure 2.10. (a) GC/MS TIC of isoprene low-NOx SOA. The insert shows the m/z 219
EIC for the dimeric products eluting between 58.8 and 59.2 min. Peak identifications: RTs 31.21, 32.25 and 32.61 min: C5 alkene triols; RTs
34.91 and 35.47 min: unstable products tentatively characterized as methyltetrol performate derivatives; RTs 38.22 and 38.97 min:
2-methyltetrols (2-methylthreitol and 2-methylerythritol, respectively). The EI spectra for the latter seven compounds are provided in Figure 2.20. The peaks labeled *1, *2 and *3 were also present in the laboratory controls and were identified as palmitic acid, stearic acid and palmitoyl monoglyceride, respectively. (b) averaged EI spectrum for the dimeric products eluting between 58.8 and 59.2 min and fragmentation scheme; and (c) averaged CI(CH4) spectrum for the latter products………82
Figure 2.11. Reaction mechanism of isoprene oxidation under low- and high-NOx
conditions. Dotted boxes indicate possible SOA precursors, whereas black boxes indicate known SOA precursors. For simplicity, only three of the eight initial isoprene hydroxyperoxy (RO2) radicals are shown. RO2 + RO2
reactions leading to diols and other hydroxycarbonyls have been omitted for simplicity. aMiyoshi et al.31 showed that [isoprene]
molar yields of MVK, MACR, and formaldehyde under low-NOx
conditions. bKroll et al.16 summarized molar yields of gas-phase products from isoprene oxidation under high-NOx conditions reported in the
literature………...84 Figure 2.12. ESI-ITMS negative mode product ion spectra from a high-NOx isoprene
SOA sample (Experiment 9). (a) MS2 spectrum for an isolated m/z 323 ion. Two neutral losses of 102 Da are observed as shown by the product ions m/z 221 and 119. (b) MS3 spectrum for an isolated m/z 323 ion generated
from the further fragmentation of the dominant daughter ion (= m/z 221) in the MS2 spectrum. These spectra indicate that 2-MG ([M – H]– ion = m/z 119) is a monomer for the oligomeric m/z 323 ion……….85 Figure 2.13. ESI-ITMS negative mode product ion mass spectra providing evidence for
mono-acetate and mono-formate oligomers in high-NOx SOA. (a) Product
ion mass spectrum for a mono-acetate dimer (m/z 161). (b) Product ion mass spectrum for a mono-formate trimer (m/z 249)………..86 Figure 2.14. Proposed charge-directed nucleophilic reaction occuring during collisional
activation in (–)ESI-ITMS, explaining the observation of 102 Da (2-hydroxy-2-methylpropiolactone) losses from oligomeric high-NOx
SOA……….87 Figure 2.15. (a) GC/MS EIC (= m/z 219) for high-NOx isoprene nucleation sample
derivatization. (c) EI mass spectrum for ethyl ester of 2-MG acid detected in part b (RT = 27.42 min). (d) EI mass spectrum for ethyl ester of linear 2-MG acid dimer detected in part b (RT =50.48 min). The
hydrolysis/ethylation followed by TMS derivatization results presented here confirm the existence of polyesters in high-NOx SOA………...88
Figure 2.16. Proposed mechanism for SOA formation from isoprene photooxidation under high-NOx conditions. Symbol used: ?, further study needed in order
to understand the formation (in gas/particle phase) of 2-MG. aElemental
compositions confirmed by high resolution ESI-MS. bElemental composition of mono-nitrate tetramer (MW = 471) confirmed by high resolution ESI-MS. cElemental compositions of mono-acetate tetramer and pentamer (MW = 366 and 468, respectively) confirmed by high
resolution ESI-MS………...90 Figure 2.17. Proposed gas-phase formation mechanism for a C4 hydroxydialdehyde
monomer, possibly accounting for a fraction of the unidentified SOA mass
in high-NOx experiments……….91
Figure 2.18. Low-NOx SOA formation pathways as elucidated by GC/MS. Boxes
indicate products detected in low-NOx SOA. Symbols used: &, further
study needed for the formations of the hypothetical carbonyl diol and epoxydiol intermediates which may result from the rearrangements of RO2
performate derivatives (shown in Table 2.4) were omitted for simplicity, however, these could serve as precursors for 2-methyltetrols if in the presence of acid and water………..92 Figure 2.19. (a) GC/MS EIC using specific ions for the TMS derivatives of 2-
methyltetrols (m/z 219), C5 alkene triols (m/z 231), and hemiacetal dimers
(m/z 219 and 335) for a PM2.5 aerosol sample collected in Rondônia, Brazil,
during the onset of the wet season from 10-12 November 2002 (39 h collection time). The insert shows a detail of the isomeric hemiacetal dimers, formed between 2-methyltetrols and C5 dihydroxycarbonyls, which
elute between 57 and 59 min; (b) averaged EI mass spectrum (only limited mass range m/z 50 – 500 available) for the TMS derivatives of the isomeric hemiacetal dimers………...93 Figure 2.20. EI mass spectra for low-NOx SOA products detected in the GC/MS TIC of
Figure 2.10a. (a), (b), and (c) correspond to mass spectra of isomeric C5
alkene triols. (d) and (e) correspond to mass spectra of diastereoisomeric 2-methyltetrol performate derivatives. (f) and (g) correspond to mass spectra of diastereoisomeric 2-methyltetrols………...94 Figure 3.1. (–)LC/ESI-MS upfront CID mass spectra for selected isoprene sulfate ester
SOA products shown in Table 3.2. (A) Product ion mass spectrum for sodium propyl sulfate standard (anionic mass of intact propyl sulfate ester = 139 Da). (B) Product ion mass spectrum for a 2-methyltetrol sulfate ester detected in a Caltech high-NOx H2O2 AS seed photooxidation experiment.
in a Caltech low-NOx AAS seed photooxidation experiment. (D) Product ion
mass spectrum for a C5 trihydroxy nitrate sulfate ester detected in EPA-299
Stage 2………..125 Figure 3.2. Time evolution of the SO42– and NH4+ aerosol mass concentrations from the
PILS/IC analysis. (A) Caltech high-NOx H2O2 isoprene experiment with AS
seed aerosol. (B) Caltech low-NOx isoprene experiment with AAS seed
aerosol. A control experiment was conducted in which seed aerosol is atomized from a solution of 0.015 M AS into the Caltech experimental chamber, and no other reactants such as VOCs or NOx were present. This
control experiment produced a similar result to that of Figure 3.2A,
indicating that the only loss mechanism for sulfate in this case was wall loss. Of the Caltech isoprene experiments, only the low-NOx AAS seed aerosol
experiment showed a significant decrease in the SO42– aerosol mass
concentration, indicating that it was likely lost to reaction………..126 Figure 3.3. (–)ESI-ITMS product ion mass spectra for sulfate esters of α-pinene
oxidation products. (A) Product ion mass spectrum for m/z 294 detected in EPA-211 Stage 5. (B) Product ion mass spectrum for m/z 265 detected in EPA-211 Stage 4. (C) Product ion mass spectrum for m/z 310 detected in EPA-211 Stage 5. (D) Product ion mass spectrum for m/z 326 detected in EPA-211 Stage 5. These sulfate esters were always present when α-pinene
was photooxidized in the presence of SO2………...127
with each chromatographic peak; therefore, the comparison of these EICs suggests that the photooxidation of isoprene in the presence of acid seed produces these sulfate esters observed in the ambient aerosol. In all chamber experiments involving isoprene in the presence of AS seed aerosol, AAS seed aerosol, or SO2, the m/z 215 ion was detected……….128
Figure 3.5. (–)LC/ESI-MS extracted ion chromatograms for m/z 294. The retention times of the m/z 294 compounds were the same as well as the mass spectra associated with each chromatographic peak; therefore, the comparison of these EICs suggests that the photooxidation of α-pinene in the presence of
NOx and acid seed produces these sulfate esters in ambient aerosol. No m/z
294 compounds were detected in experiments involving only isoprene and
acid seed (or SO2)……….129
Figure 3.6. Proposed reactions for the formation of sulfate esters from 2-methyltetrol and pinonaldehyde, a representative alcohol and aldehyde generated by the photooxidation of isoprene and α-pinene, respectively. Solid boxes indicate
(–)ESI-MS detected species. Dashed boxes indicate other proposed products possibly formed………130 Figure 4.1. Organic carbon concentration as a function of aerosol acidity. The range of
ambient [H+]air shown here include both average and maximum values
(episodes of high photochemical activity) observed at several locations in the eastern U.S. aLioy et al. (27). bKoutrakis et al. (28). cLiu et al. (29).
Figure 4.2. Extracted ion chromatograms (m/z 165, 321, and 409) for the isoprene / NO photooxidation steady-state experiment. Note that the absolute scales on the three panels are the same. Peak identifications: (1) 2-methylglyceric acid; (IS) cis-ketopinic acid internal standard; (2) methylthreitol; and (3) 2-methylerythritol. Internal standard peak areas are within 10% of each
other………..157 Figure 4.3. Extracted ion chromatograms (m/z 407, 495, and 597) for isoprene / NO
photooxidation steady-state experiment. Compounds detected as
trimethylsilyl derivatives: MW 422 (+); MW 510 (*) (compound tentatively identified by Surratt et al. (11) as a 2-methylglyceric acid dimer); MW 612 (♦). Note that the absolute scales on the three panels are the same………158
Figure 4.4. Estimated concentrations of several particle-phase SOA
products (ng m-3)...159 Figure 4.5. (+)MALDI-TOFMS spectra show that increasing particle-phase acidity leads
to increased abundances and MWs of isoprene SOA products. Each of the filter samples is based on 20.16 m3 of sampled chamber air; therefore, owing to the same amount of sample extract applied to the target plate and same amount of chamber air sampled, these spectra are directly comparable. Note that the absolute scales on the three panels are the same………...160 Figure 5.1. UPLC/(–)ESI-TOFMS base peak chromatograms (BPCs) for filter extracts of
PM2.5 aerosol collected from the SEARCH network during the June 2004
an asterisk, which correspond to known SOA acidic products (i.e. m/z 187, azelaic acid; m/z 203, 3-methyl-1,2,3-butanetricarboxylic acid; m/z 171, norpinic acid; m/z 185, pinic acid), all other peaks correspond to
organosulfates or nitrooxy organosulfates formed from the oxidation of isoprene and/or monoterpenes. The source of the m/z 239 organosulfates remains unknown. Although most of the chromatographic peaks correspond to organosulfates, this does not mean that all of the organic mass on the filters is from these compounds. Due to the use of methanol as the extraction solvent, the type of chromatographic column and the mobile phase system employed, some of the organic mass on the filter will not be extracted and/or observed by the UPLC/(–)ESI-TOFMS technique due to some of the organic mass not being eluted from the column or not being detected in the negative ion mode………...257 Figure 5.2. UPLC/(–)ESI-TOFMS extracted ion chromatograms (EICs) of m/z 294. The
RTs, accurate masses, and mDa errors between the theoretical masses of the TOFMS suggested molecular formulae and the accurate masses of the detected m/z 294 ions are listed above each chromatographic peak. All the chromatographic peaks highlighted in the figure share the same elemental composition of C10H16NO7S–. In order to form the m/z 294 nitrooxy
organosulfates in the monoterpene photooxidation experiments, the presence of both NOx (i.e., intermediate-NOx or high-NOx levels) and highly acidified
oxidation of α-pinene; however, the presence of highly acidified sulfate seed
aerosol is also required (Table 5.2). Although the β-pinene experiment
produced one of the m/z 294 isomers observed in the ambient aerosol, in subsequent figures the tandem MS data reveal that α-pinene is the only
monoterpene examined in this study that appears to be the sole source of these compounds in ambient aerosol collected from the southeastern U.S. Besides the suite of monoterpenes examined in this study, other known highly emitted monoterpenes (e.g., myrcene and ocimene)79,80 in the southeastern U.S. should be examined in future experiments to determine their potential for forming the m/z 294 nitrooxy organosulfates in organic aerosol………..259 Figure 5.3. MS2/MS3 data obtained for m/z 294 compounds from an
α-pinene/NO3/highly acidic seed experiment with RTs (a) 37.6, (b) 43.6 and
(c) 45.3 min. These compounds are denoted in the text and Scheme 5.1 by 1(295), 2(295) and 3(295), respectively………...260 Figure 5.4. MS2/MS3 data obtained for m/z 294 compounds from a SEARCH sample
(BHM 6/20/04) with RTs (a) 37.4, (b) 43.4 and (c) 45.1 min. These compounds are denoted in the text and Scheme 5.1 by 1(295), 2(295) and 3(295), respectively………..261 Figure 5.5. Proposed formation mechanism for the three major isomers of the m/z 294
nitrooxy organosulfates observed in ambient aerosol from the oxidation of α
observed product ions formed in the tandem MS experiments. For isomers 1 and 2(295), it remains unclear how the NO3-initiated oxidation produces
these compounds in the presence of highly acidified sulfate seed aerosol. a
Aschmann et al.74,75 observed a hydroxynitrate of this MW in the gas-phase from the OH-initiated oxidation of α-pinene in the presence of NO……...262
Figure 5.6. MS2 (m/z 296) TICs obtained from (a) a d-limonene/H2O2/NO/highly acidic
seed experiment and (b) a SEARCH sample (Birmingham, Alabama
6/20/04)………....263 Figure 5.7. MS2/MS3 data obtained for the three m/z 296 compounds from a d-limonene/
H2O2/NO/highly acidic seed experiment with RTs 24.1, 25.4 and 28.3 min.
The compounds are denoted by 1–3(297) in the text and Scheme 5.2…...264 Figure 5.8. Proposed formation mechanism for the three major m/z 296
nitrooxy-organosulfate isomers observed from the photooxidation of
limonene/limonaketone in the presence of NOx and highly acidified sulfate
seed aerosol. Numerals 1–3(297) correspond to the isomeric structural assignments based upon the explanations shown in Scheme 5.2 for the observed product ions formed in the tandem MS experiments. a Lee et al.82 observed an organic nitrate species of this MW in the gas-phase from the photooxidation of limonene in the presence of NOx as the [M + H]+ ion using
PTR-MS………....265 Figure 5.9. UPLC/(–)ESI-TOFMS extracted ion chromatograms (EICs) of m/z 249 for
the following: (a) α-pinene/NO3/highly acidic seed experiment; (b) α
-pinene/H2O2/NO/highly acidic seed experiment; (d) SEARCH sample
collected from the CTR field site on 6/11/2004. The RTs, accurate masses, and mDa errors between the theoretical masses of the TOFMS suggested molecular formulas and the accurate masses of the detected m/z 249 ions are listed above each chromatographic peak. All the chromatographic peaks highlighted in the figure share the same elemental composition of
C10H17O5S-. α-/β-Pinene were the only monoterpenes found in this study to
produce the m/z 249 organosulfates with the same RTs, accurate masses, and elemental compositions as those observed in the SEARCH field samples..266 Figure 5.10. MS2 spectra obtained for the two m/z 249 compounds with RTs 31.2 and
32.2 min from (a, b) a β-pinene/H2O2/NO/highly acidic seed experiment and
(c, d) a SEARCH field sample (BHM 6/20/04). The compounds are denoted by 1(250) and 2(250) in the text, Figure 5.12 and Scheme 5.3………...267 Figure 5.11. MS2 spectra obtained for the two m/z 249 compounds with RTs 24.4 and
29.3 min from (a, b) an α-pinene/H2O2/NO/highly acidic seed experiment
and (c, d) a SEARCH field sample (CTR 6/11/24). The compounds are denoted by 3(250) and 4(250) in the text, Figure 5.12 and Scheme 5.3. The ion at m/z 205 is due to an interference………...268 Figure 5.12. Proposed formation mechanism for the four m/z 249 organosulfates
observed in ambient aerosol from the OH-initiated oxidation of β-pinene
and α-pinene. Numerals 1–2(250) correspond to the isomeric structural
assignments for the m/z 249 β-pinene organosulfates, which are based upon
experiments (Figure 5.10). Iinuma et al.26 also observed the formation of isomer 1(250) from a β-pinene ozonolysis acid seed experiment, and
detected this same isomer in a Norway spruce-dominated forest in Bavaria, Germany. Numerals 3–4(250) correspond to the isomeric structural
assignments for the m/z 249 α-pinene organosulfates, which are based upon
the explanations for the observed product ions formed in the tandem MS experiments (Figure 5.11)………...269 Figure 5.13. MS2 (m/z 227) TICs obtained from (a) an α-pinene/H2O2/NO/highly acidic
seed experiment and (b) a SEARCH sample (BHM 6/20/04)…………....270 Figure 5.14. MS2/MS3 data for the m/z 227 compounds from (a) an α-pinene/H2O2/
NO/highly acidic seed experiment with RT 4.3 min and (b) a SEARCH sample (BHM 6/20/04) with RT 4.1 min………...271 Figure 5.15. UPLC/(–)ESI-TOFMS extracted ion chromatograms (EICs) of m/z 279 for
the following: (a) α-pinene/H2O2/NO/highly acidic seed experiment; (b) α
-pinene/NO3/highly acidic seed experiment; (c) β-pinene/H2O2/NO/highly
acidic seed experiment; (d) SEARCH sample collected from the CTR field site on 6/11/2004. The RTs, accurate masses, and mDa errors between the theoretical masses of the TOFMS suggested molecular formulae and the accurate masses of the detected m/z 279 ions are listed above each
chromatographic peak. All the chromatographic peaks highlighted in the figure share the same elemental composition of C10H15O7S–…………...272
Figure 5.16. MS2 (m/z 279) TICs obtained from (a) an
α-pinene/H2O2/NO/highly acidic
compounds with RTs 19.1 (or 18.9) and 19.9 min are denoted by 1(280) and 2(280) in the text and in Scheme 5.5………...273 Figure 5.17. MS2/MS3 data for (a) the first- (19.1 min) and (b) second-eluting (19.9 min)
m/z 279 compounds from the α-pinene/H2O2/NO/highly acidic seed
experiment………...274 Figure 5.18. MS2/MS3 data for (a) the first- (19.1 min) and (b) second-eluting (19.9 min)
m/z 279 compounds from the β-pinene/H2O2/NO/highly acidic seed
experiment………...275 Figure 5.19. MS2/MS3 data for the first- (18.9 min) and second-eluting (19.7 min) m/z
279 compounds from the SEARCH sample (CTR 6/11/04)………...276 Figure 5.20. MS2 (m/z 310) TICs obtained from (a) an α-pinene/H2O2/NO/highly acidic
seed experiment, (b) a β-pinene/H2O2/NO/highly acidic seed experiment and
(c) a SEARCH sample (BHM 6/20/04). The compounds with RTs 27.0 and 34.5 min from the ambient sample are denoted by 1–2(311) in the text and Scheme 5.6………..277 Figure 5.21. MS2/MS3 data for the m/z 310 compounds with RTs (a) 27.0 and (b) 34.5
min from the SEARCH sample (BHM 6/20/04)………...…278 Figure 5.22. MS2 (m/z 373) TIC obtained from a SEARCH sample (BHM 6/20/04). The
compounds with RTs 31.9 and 32.6 min are denoted by 1(374) and 2(374) in the text and Scheme 5.7………...……279 Figure 5.23. MS2/MS3 data for the m/z 373 compounds with RTs (a) 31.9 and (b) 32.6
Figure 5.24. MS2 (m/z 244) TICs obtained from (a) an isoprene/NOx/SO2 EPA
photooxidation experiment and (b) a SEARCH sample (CTR 6/11/04)...281 Figure 5.25. MS2/MS3 data for the m/z 244 compounds from (a) an isoprene/NO
x/SO2
EPA photooxidation experiment and (b) a SEARCH sample (CTR
6/11/04)……….……282 Figure 5.26. MS2 (m/z 305) TICs obtained from (a) an isoprene/NOx/SO2 EPA
photooxidation experiment and (b) a SEARCH sample (CTR 6/11/04). The compounds with RTs 15.7 and 19.0 min in the ambient sample are denoted by 2(306) and 4(306) in the text and Scheme 5.9………...283 Figure 5.27. MS2/MS3 data obtained for the five first-eluting m/z 305 compounds from
an isoprene/NOx/SO2 EPA photooxidation experiment. It is noted that
MS2/MS3 data obtained for the three last-eluting m/z 305 compounds from the same isoprene experiment (Figure 5.26a) are shown in Figure 5.42...284 Figure 5.28. MS2/MS3 data obtained for the five m/z 305 compounds from a SEARCH
sample (CTR 6/11/04)………...285 Figure 5.29. Proposed formation mechanism for the two major m/z 305
nitrooxy-organosulfate isomers observed in ambient aerosol (Figure 5.26b) from either the photooxidation of isoprene in the presence of NOx or NO3
-initiated oxidation of isoprene under dark conditions, with both in the presence of acidified sulfate seed aerosol. Numerals 2 and 4(306) correspond to the isomeric structural assignments based upon the
species of this MW in the gas-phase from the NO3-initiated oxidation of
isoprene under dark conditions as the [M + CF3O– ] ion using chemical ionization MS………...……286 Figure 5.30. MS2 (m/z 334 and 332) TICs obtained from (a, c) an isoprene/NOx/SO2 EPA
photooxidation experiment and (b, d) a SEARCH sample (CTR 6/11/04), respectively………....……287 Figure 5.31. MS2/MS3 data obtained for the m/z 333 compounds from an
isoprene/NOx/SO2 EPA photooxidation experiment eluting at (a) 3.8 and
(b) 4.2 min……….…288 Figure 5.32. MS2/MS3 data obtained for m/z 333 compounds from a SEARCH sample
(CTR 6/11/04) eluting at 4.8 min...289 Figure 5.33. MS2/MS3 data obtained for m/z 331 compounds from an isoprene/NOx/SO2
EPA photooxidation experiment eluting at 5.0 min………...…290 Figure 5.34. MS2/MS3 data obtained for m/z 331 compounds from a SEARCH sample
(CTR 6/11/04) eluting at (a) 4.1 and (b) 5.1 min………..………291 Figure 5.35. MS2 spectra obtained for m/z 294 compounds from an
α-pinene/H2O2/NO/highly acidic seed experiment with RTs (a) 37.6, (b)
43.6 and (c) 45.3 min……….…292 Figure 5.36. MS2/MS3 data obtained for m/z 294 compounds from a β-pinene/
H2O2/NO/highly acidic seed experiment with RTs (a) 43.7 and (b) 46.4
min……….293 Figure 5.37. UPLC/(–)ESI-TOFMS extracted ion chromatograms (EICs) of m/z 296 for
β-phellandrene + d-limonene/H2O2/NO/highly acidic seed experiment; (c)
limonaketone/H2O2/NO/highly acidic seed experiment; (d) SEARCH
sample collected from the JST field site (i.e., Downtown Atlanta, Georgia) on 6/26/2004. The RTs, accurate masses, and mDa errors between the theoretical masses of the TOFMS suggested molecular formulas and the accurate masses of the detected m/z 296 ions are listed above each chromatographic peak. All the chromatographic peaks highlighted in the figure share the same elemental composition of C9H14NO8S–……...…294
Figure 5.38. MS2/MS3 data obtained for the three m/z 296 compounds 1–3(297) from a limonaketone/H2O2/NO/highly acidic seed experiment. The compounds
are denoted by 1–3(297) in the text and Scheme 5.2………295 Figure 5.39. MS2/MS3 data obtained for the three m/z 296 compounds from a SEARCH
sample (BHM 6/20/04) with RTs 22.4, 24.0 and 27.5 min………...296 Figure 5.40. MS2/MS3 data for the m/z 310 compounds with RTs (a) 27.2 min from an
α-pinene/H2O2/NO/highly acidic seed experiment and (b) 34.0 min from a
β-pinene/H2O2/NO/highly acidic seed experiment………....……297
Figure 5.41. UPLC/(–)ESI-TOFMS extracted ion chromatograms (EICs) of m/z 373 for the following: (a) d-limonene/H2O2/NO/highly acidic seed experiment; (b)
β-phellandrene + d-limonene/H2O2/NO/highly acidic seed experiment; (c)
chromatographic peaks highlighted in the figure share the same elemental composition of C10H17N2O11S–………...………298
Figure 5.42. MS2/MS3 data obtained for the three last-eluting m/z 305 compounds from
an isoprene/NOx/SO2 EPA photooxidation experiment (Figure 5.26a)…299
Figure 6.1. Comparison of important gas- and particle-phase products produced from isoprene under low-NOx conditions in the presence of either neutral (blue
lines) or highly acidified (red lines) sulfate seed aerosol. In most cases, only one structural isomer is shown……….…344 Figure 6.2. (–)CIMS time traces: (A) Reactive uptake of gas-phase BEPOX in the
presence of either neutral (blue line) or highly acidified (red line) sulfate seed aerosol under dark conditions. (B) Hydroxy hydroperoxide (orange line) and BEPOX (red line) produced from butadiene under low-NOx conditions. (C)
ISOPOOH (neutral seed = light blue line; highly acidic seed = orange line) and IEPOX (neutral seed = blue line; highly acidic seed = red line) produced from isoprene under low-NOx conditions. Signals of the IEPOX are
normalized to that of the ISOPOOH when lights are turned off……...…345 Figure 6.3. Mechanism for the enhancement of SOA formation from isoprene under
lower-NOx conditions due to increased aerosol acidity. SOA constituents in
shaded and dashed boxes are observed by GC/MS and UPLC/(–)ESI-TOFMS, respectively. Only the β-IEPOX is considered here, but this also
applies to δ-IEPOX………...…346
Figure 6.4. UPLC/(–)ESI-TOFMS BPCs. The numbers listed above each peak
H]– ions are of the same oligoester series (Table 6.1). m/z 97, 199, and 215 correspond to sulfate, an organosulfate of 2-MG (16), and an organosulfate of 2-methyltetrols (15, 16), respectively………..……347 Figure 6.5. Possible chemical mechanism for the formation of isoprene SOA under
high-NOx conditions. Detailed chemical structures of the high-NOx SOA
constituents resulting from the oligoester formation can be found in Table 6.1………...…348 Figure 6.6. GC/EI-MS mass spectra for isoprene low-NOx SOA constituents formed in
the highly acidified sulfate seed aerosol experiment chemically characterized in Figure 6.1G–J. (A1–A2) Mass spectra corresponding to the IEPOX compounds characterized for the first time in low-NOx isoprene SOA. (B1–
B3) Mass spectra corresponding to the three isomers of the C5-alkene triols.
(C1–C2) Mass spectra corresonding to the diasteroisomeric 2-methyltetrols. (D1) Averaged mass spectrum corresponding to all 6 major isomers of the previously charaterized hemiacetal dimers………...…349 Figure 6.7. UPLC/(–)ESI-TOFMS mass spectra for isoprene low-NOx SOA constituents
formed in the highly acidified sulfate seed aerosol experiment chemically characterized in Figure 6.1K and Figure 6.1L, respectively. (A) Mass
Figure 6.8. (A1–F1) Particle-phase constituents formed from the dark reactive uptake of BEPOX in the presence of either neutral (blue lines) or highly acidic (red lines) sulfate seed aerosol. (A2–F2) Corresponding mass spectra for each chemically characterized particle-phase constituent shown in A1–F1. For simplicity, the mass spectra shown are only those of the most abundant isomers (chromatographic peaks) found in the EICs of A1–F1. All particle-phase constituents shown in A1–F1 are more abundantly formed from the uptake of the BEPOX in the presence of highly acidic sulfate seed aerosol, which is consistent with the low-NOx isoprene SOA constituents shown in
Figure 6.1. The particle-phase products characterized here were also observed in photooxidation of butadiene under low-NOx conditions and in
the presence of highly acidified sulfate seed aerosol. These data further confirm the role of IEPOX in forming low-NOx isoprene SOA under acidic
conditions………...……352 Figure 6.9. (A) GC/MS EICs of m/z 248 from 50 mg of BEPOX dissolved in 0.5 mL of
0.1 M H2SO4 in water (green line) and a reactive uptake experiment of
BEPOX in the presence of highly acidified sulfate seed aerosol (black line). The two chromatographic peaks differ only slightly in terms of retention time owing to the samples being analyzed by the GC/EI-MS technique on separate days. (B) Corresponding mass spectrum for the chromatographic peak shown in A for the 50 mg BEPOX standard dissolved in 0.5 mL of 0.1 M H2SO4 in water (green line). The mass spectrum corresponding to the
BEPOX in the presence of highly acidified sulfate seed aerosol (black line) is presented in Figure 6.8A2. This comparison shows that some of the BEPOX remains unreacted in the particle phase and could have resulted there due to semi-volatile partitioning……….…354 Figure 6.10. PILS/IC time traces of sulfate aerosol mass concentrations observed in
experiments examining the reactive uptake of BEPOX in the presence of either neutral or highly acidified sulfate seed aerosol. In addition, a PILS/IC time trace is shown for the peak area of a tentatively assigned organosulfate compound observed only in the SOA formed from the reactive uptake of BEPOX in the presence of highly acidified sulfate seed aerosol. In both the neutral and highly acidified sulfate aerosol
experiments, the seed aerosol was injected first and allowed to stabilize. Time zero indicates when the BEPOX was injected. The sulfate aerosol mass concentration decayed by ~58% of its initial loading 1 h after the BEPOX was injected in the presence of highly acidified sulfate seed aerosol. The sulfate aerosol mass concentration remained relatively constant after the injection of BEPOX in the presence of neutral sulfate seed aerosol. The large decay of sulfate mass in the highly acidified sulfate seed aerosol experiment indicates that it is lost due to reaction with
BEPOX………..……355 Figure 6.11. UPLC/(–)ESI-TOFMS EICs of organosulfates formed from the reactive
organosulfates. Accurate mass measurements for each observed ion allowed for the determination and verification for the presence of the latter compounds by providing elemental composition (i.e., molecular formula) information. The elemental compositions for each ion are denoted in red. Numbers marked above the chromatographic peaks are the retention times for these compounds………...……356 Figure 6.12. UPLC/(–)ESI-TOFMS EICs associated with three major classes of
oligoesters previously observed in isoprene high-NOx SOA (12, 26). For
simplicity, only one structural isomer is shown in each of these EICs. These EICs were obtained from three different experiments in which the photooxidation of the same mixing ratio of MACR was conducted with varying levels of initial [NO2]/[NO] ratio. Increasing the initial
[NO2]/[NO] ratio for these high-NOx MACR experiments shown here
results in the enhancement of both the previously characterized high-NOx
SOA constituents and the high-NOx SOA masses. These enhancements are
due to the formation and further reaction of MPAN under high-NO2
List of Schemes
Chapter 1
1.1Background and Motivation
Organic compounds contribute a large fraction (i.e., 20–90%) towards the total
mass of tropospheric fine particulate matter (PM2.5, with aerodynamic diameter < 2.5 µm)
(Kanakidou et al., 2005; Hallquist et al., 2009). High concentrations of PM2.5 are known
to have adverse health effects(Hallquist et al., 2009, and references therein) and play a
role in global climate change (Kanakidou et al., 2005; Hallquist et al., 2009). Although
there are many sources for organic compounds found in PM2.5, which includes primary
emissions (e.g., diesel engine exhaust), SOA formation often accounts for a large, and at
times, dominant fraction of the organic mass found in tropospheric PM2.5 (Hallquist et al.,
2009). SOA has been traditionally viewed to form in the troposphere from the oxidation
of volatile organic compounds (VOCs), where the resultant low vapor pressure oxidation
products partition between the gas and aerosol phases.
Although the application of both off-line and on-line advanced analytical
techniques have increased our understanding of SOA formation pathways, such as the
detection of high-molecular-weight species indicating the potential role of heterogeneous
chemistry, in recent years (e.g., Docherty et al., 2005; Gao et al., 2004ab; Iinuma et al.,
2004; Kalberer et al., 2004; Tobias et al., 2000; Tolocka et al., 2004), current models
predict notably less SOA mass than is typically observed in the atmosphere (de Gouw et
al., 2005; Heald et al., 2005; Volkamer et al., 2006). A large source for this
underestimation is due, in large part, to the lack of full chemical characterization of
organic constituents found in tropospheric PM2.5, likely resulting in significant sources or
chemical formation pathways of SOA not being identified or well characterized, and thus,
Much of the current efforts in the research community are now focused on trying to
identify this missing source of SOA (Hallquist et al., 2009).
Until recently, the formation of SOA from the oxidation of isoprene, the most
abundant non-methane hydrocarbon emitted annually into the troposphere, was
considered insignificant (Claeys et al., 2004), and as a result, has not been included in
SOA models. This was largely due to the known volatility of first-generation gas-phase
oxidation products, such as methacrolein (MACR), methyl vinyl ketone (MVK), and
formaldehyde, from isoprene oxidation in the presence of nitrogen oxides (NOx = NO +
NO2), and a previous chamber study that concluded that isoprene oxidation does not lead
to SOA formation (Pandis et al., 1991). Recent field observations of certain organic
aerosol compounds, diastereoisomeric methyltetrols (methylerythritol and
2-methylthreitol) and 2-methylglyceric acid, attributable to isoprene oxidation, and the
experimental observation that isoprene under highly acidic conditions can lead to the
formation of polymeric, humic-like substances through heterogeneous reactions,
re-opened the issue of SOA formation from isoprene (Claeys et al., 2004; Edney et al.,
2005; Limbeck et al., 2003; Wang et al., 2005). Subsequent to their ambient
identification, Edney et al. (2005) and Böge et al. (2006) detected 2-methyltetrols in SOA
formed from laboratory chamber studies of isoprene. Recent work in our laboratory has
shown that SOA formation from isoprene oxidation can be significant (Kroll et al., 2005,
2006). More specifically, higher SOA yields from isoprene are observed under low-NOx
(or NOx-free) conditions (i.e., upwards of 3%); in this regime, peroxy radicals (RO2)
radicals react primarily with HO2, a pathway that tends to produce lower-volatility
2006, 2008, and references therein; Presto et al., 2005). Under high-NOx conditions, RO2
radicals react with NO to produce alkoxy (RO) radicals, or as a minor pathway, organic
nitrates (RONO2); for small VOCs (≤ C10), like isoprene, these RO radicals generally
fragment into smaller more volatile products, resulting in small amounts of SOA (~1%
mass yields for high-NOx SOA) (Kroll et al., 2005, 2006). For isoprene, as well as other
VOCs, these differences in SOA yields remain unclear due to lack of understanding of
the detailed reaction pathways leading to SOA.
1.2Organization of Thesis
Although isoprene is now recognized to yield significant amounts of aerosol
under low- or high-NOx conditions, as well as being enhanced with increasing aerosol
acidity, the detailed chemical mechanisms of isoprene SOA formation have remained
elusive, especially those that are relevant in the Earth’s atmosphere. Much of this has
been a direct result of the lack of detailed chemical characterization of the isoprene SOA
constituents using suitable mass spectrometry techniques. The chemical characterization
of individual SOA constituents provides significant insights into the chemical formation
pathways of SOA, especially when combined with detailed gas-phase chemical
measurements.
Owing to the fact that SOA formation from isoprene oxidation likely contributes
significantly to the ambient organic aerosol budget (Carlton et al., 2009, and references
therein; Henze and Seinfeld, 2006), its detailed chemical formation pathways need to be
fully elucidated so that the research community can accurately include it into global SOA
isoprene SOA need to be resolved, and thus, are central to this thesis. These include the
following:
1.) Why is there a difference in the isoprene SOA yields between low- and
high-NOx conditions? Specifically, what oxidation products from isoprene are
responsible for forming SOA under both NOx regimes? What are the
subsequent reactions of these oxidation products that lead to isoprene SOA
formation? Does heterogeneous chemistry play a major role? Are the
reactions we uncover under these different NOx regimes relevant to the
troposphere?
2.) Are there ambient tracer compounds that can be used to identify when
isoprene SOA forms under low- and high-NOx conditions in the troposphere,
as well as be used in source apportionment efforts?
3.) What are the precise acid-catalyzed reactions that cause the laboratory
observed enhancements in isoprene SOA mass with increasing aerosol
acidity? Are these reactions relevant to ambient organic aerosol formation?
4.) For the chemical formation mechanisms we uncover from studying the
chemical composition of isoprene SOA, how might these relate to other SOA
precursors, such as the monoterpenes (e.g., α-pinene)?
In this thesis, the applications of both off-line and on-line advanced mass
spectrometry techniques are used to address these above questions. The reactions we
uncover that lead to the formation of isoprene SOA are then evaluated in certain cases for
other SOA precursors; for example, the formation of SOA from the photooxidation (i.e.,
emitted from anthropogenic sources, under both low- and high-NOx conditions is
examined in detail in Appendix F. Also, many of the mass spectrometry techniques
applied in this thesis are used in the chemical characterization of a new atmospheric
tracer (i.e., 3-methyl-1,2,3-butanetricarboxylic acid) for terpene SOA formation in
Appendix E.
In Chapter 2, the chemical composition of SOA from the photooxidation of
isoprene over the full range of NOx conditions is investigated through a series of
controlled laboratory chamber experiments. Oligomerization was observed to be an
important SOA formation pathway in all cases; however, the nature of the oligomers
depends strongly on the NOx level, with acidic products formed under high-NOx
conditions only. We present, to our knowledge, the first evidence of particle-phase
esterification reactions in SOA, where the further oxidation of the isoprene oxidation
product methacrolein under high-NOx conditions produces polyesters involving
2-methylglyceric acid (2-MG) as a key monomeric unit. These oligomers comprise ~
22−34% of the high-NOx SOA mass. In Appendix A, a detailed discussion of the EI
mass spectral behavior of the TMS derivatives of 2-MG, 2-MG dimer and trimers are
presented in a complimentary GC/MS study. Under low-NOx conditions, organic
peroxides contribute significantly to the low-NOx SOA mass (~ 61% when SOA forms
by nucleation and ~ 25−30% in the presence of seed particles). The contribution of
organic peroxides in the SOA decreases with time, indicating photochemical aging.
Hemiacetal dimers are found to form from C5 alkene triols and 2-methyltetrols under
low-NOx conditions; these compounds are also found in aerosol collected from the
chamber experiments. Chapter 2 serves as the foundation for building up our
understanding of the detailed formation pathways of isoprene SOA in the subsequent
chapters.
In Chapter 3, the chemical composition of SOA from the photooxidations of
isoprene and α-pinene, in the presence or absence of sulfate seed aerosol, is investigated
through a series of controlled chamber experiments in two separate laboratories. By
using electrospray ionization – mass spectrometry, sulfate esters in SOA produced in
laboratory photooxidation experiments are identified for the first time. Sulfate esters are
found to account for a larger fraction of the SOA mass when the acidity of seed aerosol is
increased, a result consistent with aerosol acidity increasing SOA formation. Many of
the isoprene and α-pinene sulfate esters identified in these chamber experiments are also
found in ambient aerosol collected at several locations in the southeastern United States
(also see Appendix B for a study of the composition of atmospheric aerosol collected
from this region) and in Europe (also see Appendix C for the characterization of
organosulfates of isoprene and unsaturated fatty acids in ambient aerosol collected from
K-puszta, Hungary). It is likely that this pathway is important for other biogenic
terpenes, and may be important in the formation of humic-like substances (HULIS) in
ambient aerosol.
In Chapter 4, the effect of particle-phase acidity on SOA formation from isoprene
is investigated in a laboratory chamber study, in which the acidity of the inorganic seed
aerosol was controlled systematically. The observed enhancement in SOA mass
chemical analyses. Aerosol mass concentrations for the 2-methyltetrols, as well as the
newly identified sulfate esters, both of which serve as tracers for isoprene SOA in
ambient aerosols, increased significantly with enhanced aerosol acidity. Aerosol
acidities, as measured in nmol H+ m-3, employed in the present study are in the same range as those observed in tropospheric aerosol collected from the eastern U.S.
Owing to the results obtained in Chapters 3 and 4, in Chapter 5 the mechanism
and ubiquity of organosulfate formation in biogenic SOA is investigated by a
comprehensive series of laboratory photooxidation (i.e., OH-initiated oxidation) and
nighttime-oxidation (i.e., NO3-initiated oxidation under dark conditions) experiments
using nine monoterpenes (α-pinene, β-pinene, d-limonene, l-limonene, α-terpinene,
γ-terpinene, terpinolene, Δ3-carene, and β-phellandrene) and three monoterpenes (α-pinene, d-limonene, and l-limonene), respectively. Organosulfates were characterized
using liquid chromatographic techniques coupled to electrospray ionization combined
with both linear ion trap and high-resolution time-of-flight mass spectrometry.
Organosulfates are formed only when monoterpenes are oxidized in the presence of
acidified sulfate seed aerosol, a result consistent with prior work. Archived
laboratory-generated isoprene SOA and ambient filter samples collected from the
southeastern U.S. were reexamined for organosulfates. By comparing the tandem mass
spectrometric and accurate mass measurements collected for both the
laboratory-generated and ambient aerosol, previously uncharacterized ambient organic
aerosol components are found to be organosulfates of isoprene, α-pinene, β-pinene, and
limonene-like monoterpenes (e.g., myrcene), demonstrating the ubiquity of organosulfate