Measuring E-Learning Systems Success
A Dissertation submitted by
Ahmed Younis AL-Sabawy
For the award of
Doctor of Philosophy
School of Information Systems
Faculty of Business and Law
i
ii Book Chapters
Alsabawy, Ahmed Younis, Cater-Steel, Aileen and Soar, Jeffrey (2012) A model to
measure e-learning systems success. In: Belkhamza, Zakariya and Wafa, Syed Azizi,
(eds.) Measuring organisational information systems success: new technologies and practices. Business Science Reference (IGI Global), Hershey, PA, USA, pp. 293-317.
Alsabawy, Ahmed Younis and Cater-Steel, Aileen and Soar, Jeffrey (2013) E
-learning service delivery quality: a determinant of user satisfaction. In: Kats, Yefim
(ed.) Learning Management Systems and Instructional Design: Metrics, Standards, and Applications. (IGI Global), USA.
Conference Proceedings - Refereed
Alsabawy, Ahmed Younis, Cater-Steel, Aileen and Soar, Jeffrey (2011) Measuring
e-learning system success (Research in progress). In: PACIS 2011: Quality Research
in Pacific Asia, 7-11 Jul 2011, Brisbane, Australia.
Alsabawy, Ahmed Younis, Cater-Steel, Aileen and Soar, Jeffrey (2012) The effect of
service delivery quality on customer value of e-learning systems. In: Conferencia
Ibérica de Sistemas y Tecnologías de la Información (CISTI 2012), 20-23 June 2012, Madrid, Spain.
Alsabawy, Ahmed Younis, Cater-Steel, Aileen and Soar, Jeffrey (2012) IT infrastructure and its role in the success of e-learning systems: measurement and
causal models. In: EUNIS’12 A 360o perceptive on IT/IS in Higher Education, 20,
21 and 22 of June 2012, University of Trás-os-Montes e Alto Douro, Vila Real, Portugal.
Alsabawy, Ahmed Younis, Cater-Steel, Aileen and Soar, Jeffrey (2012) Identifying
the determinants of e-learning service delivery quality. In: ACIS 2012: 23rd
Australasian Conference on Information Systems: Location, Location, Location, 3-5 Dec 2012, Geelong, Australia.
Journal Articles: Accepted
iii
Alsabawy, Ahmed Younis, Cater-Steel, Aileen, and Soar, Jeffrey ‘Factors affecting e-learning service delivery quality: the student perspective’ paper submitted to “The Internet and Higher Education’ journal ‘Under Review’.
Alsabawy, Ahmed Younis, Cater-Steel, Aileen, and Soar, Jeffrey ‘The Effect of IT Infrastructure Services and Quality Aspects on Perceived Usefulness of E-Learning Systems’ paper submitted to ‘Computers in Human Behaviour’ journal ‘Under Review’.
Alsabawy, Ahmed Younis, Cater-Steel, Aileen, and Soar, Jeffrey ‘Issues in Evaluating the Success of E-Learning Systems’ paper submitted to ‘Systems’ journal ‘Under Review’.
Report
v
I certify that the ideas, results, analyses and conclusions reported in this dissertation are entirely my own effort, except where otherwise acknowledged. I also certify that the work is original and has not been previously submitted for any other award, except where otherwise acknowledged.
Candidate signature
______________________________ ______________________________
Ahmed Younis AL-Sabawy Date
ENDORSEMENT
Principal Supervisor
______________________________ ______________________________
Associate Professor Aileen Cater-Steel Date
Co-Supervisor
______________________________ ______________________________
vi
First of all, I would like to present my gratitude to Allah (God) for assisting me in the completion of this dissertation.
My deepest gratitude to Associate Professor Aileen Cater-Steel, the principal supervisor of the study. She has great knowledge and experience in the information systems field and she guided and motivated me immensely to achieve my research objectives effectively and in a timely manner. She gave me a lot of time and she was available for me always. I do not have sufficient words that could describe the efforts that Dr. Aileen put in towards my research.
I would like to thank Dr. Jeffery Soar, as my co-supervisor, for his enduring support, especially at the beginning of my study when Dr. Aileen was on leave. His advice and suggestions helped me in selecting the study topic. I wish to thank the Deans of Faculties at USQ who allowed me to conduct the study with academic staff and students: Professor Allan Layton (Faculty of Business and Law); Professor Peter Goodall (Faculty of Arts); Professor Janet Verbyla (Faculty of Sciences); Professor Frank Bullen (Faculty of Engineering and Surveying). I would like to thank Mr. David Bull (Director Open Access College) for permitting me to undertaken the study with academic staff members of Open Access College. Special thanks go to Mr. Scott Sorley (Executive Director ICT Services) who assisted me in collecting the data from ICT staff.
Also my thanks to Dr. Shahab Abdulla, Mr. Nick Erbacher and Dr. Belal Yousif for supporting me to gather the data. My great thanks to students, academic staff, and ICT staff at USQ who participated as respondents in my study. Without your assistance this study would not have been completed. Thanks are due to the Ministry of Higher Education and Scientific Research of Iraq for giving me the opportunity to complete my PhD study.
Thanks also go to Dr. Talal Yusaf who assisted me in getting admission to study at USQ and for his support in the data collection.
I would like to acknowledge the people who assisted me during my study: Dr. Latif Al-Hakim; Dr. Abdul Hafeez-Baig; Dr. Michael Lane; Dr. Dave Roberts; Torben Marcussen; and Shelly Grist, and Samantha Davis (Office of Research Graduate Studies). I would like to appreciate the efforts of Philip Holmes-Smith (Australian Consortium for Social and Political Research Incorporated) and Mrs. Abeer Al-Azawi for their worthy suggestions about the statistical methods.
Thanks for my PhD students colleagues Sara Saeed Al Mutawa, Moyassar Zuhair Al-Taie, Layla AL-Hameed, and Sophia Imran. My thanks also go to my friends for their support, especially, Raed Ahmed, Ahmed Naji, Khalid Hashim, Sinan Harjan and Houda Saeed.
I also acknowledge the work put in by the editor Libby Collett to edit and improve the English usage within the thesis.
I am particularly grateful to Zahraa Mohammed Daibes for her moral support and encouragement during my study. My faithful thanks to you Zahraa.
vii
1.1. Chapter introduction ... 2
1.2. Background to the study ... 2
1.3. Motivation for the study ... 6
1.4. Study problem ... 8
1.5. Study objectives ... 10
1.6. Significance of study ... 11
1.7. Dissertation outline ... 12
1.8. Chapter summary ... 13
CHAPTER TWO: LITERATURE REVIEW ... 16
2.1. Chapter introduction ... 16
2.2. Information technology infrastructure services ... 17
2.2.1. Issue of investment in IT infrastructure and its impact on ensuring organisational performance ... 17
2.2.2. Issue of IT infrastructure flexibility ... 21
2.2.3. Issue of IT infrastructure impact on information systems success ... 23
2.3. Information system quality ... 25
2.3.1. Software quality ... 26
2.3.2. Information system quality ... 30
2.3.3. Web-based system quality... 32
2.4. Information quality ... 35
2.4.1. Information quality of traditional information systems ... 35
2.4.2. Information quality of web-based applications and e-learning systems 39 2.5. Service delivery quality ... 42
2.5.1. Service delivery quality and traditional information systems ... 43
2.5.2. Online service delivery quality ... 44
2.5.3. Service delivery quality in e-learning systems... 47
2.6. Perceived usefulness ... 50
2.6.1. System use ... 50
2.6.2. Perceived usefulness ... 52
2.7. User satisfaction ... 58
2.7.1. User satisfaction approaches ... 58
2.7.2. User satisfaction with e-learning systems ... 62
2.8. Value of e-learning systems ... 64
2.8.1. Customer Value (Internal Customers) ... 65
2.8.2. Customer Value (External Customers) ... 67
2.8.3. Organisational Value ... 68
2.8.4. Social (Societal) Benefits ... 71
2.9. Information systems success approaches ... 73
2.9.1. Technology Acceptance Model (TAM) approach ... 74
2.9.2. User satisfaction approach ... 84
2.9.3. User involvement approach... 84
2.9.4. DeLone and McLean approach ... 92
2.10. E-learning system success: definition, platforms, and approaches ... 98
2.10.1. Technology Acceptance Model (TAM) approach ... 100
2.10.2. User satisfaction approach ... 105
2.10.3. E-learning quality approach ... 105
viii
3.1. Chapter introduction ... 116
3.2. Study model... 116
3.3. Research philosophy ... 120
3.4. Study approach ... 122
3.5. Study hypotheses ... 123
3.5.1. Hypotheses of direct effect ... 124
3.5.2. Hypotheses of mediator effect ... 132
3.6. Chapter summary ... 134
CHAPTER FOUR: RESEARCH METHODOLOGY ... 136
4.1. Chapter introduction ... 136
4.2. Research method ... 136
4.2.1. Case study ... 136
4.2.2. Experimental design... 137
4.2.3. System development in information systems research ... 137
4.2.4. Action research ... 138
4.2.5. Ethnography ... 138
4.2.6. Historical research ... 138
4.2.7. Delphi method ... 139
4.2.8. Survey research ... 139
4.3. Research sampling... 141
4.4. Data collection method... 144
4.5. Questionnaire administration ... 146
4.5.1. Format of questionnaire ... 146
4.5.2. Scale of measurement ... 146
4.5.3. Pilot study ... 147
4.5.4. The final items of the questionnaires ... 149
4.6. Data Analysis ... 162
4.6.1. Structural Equation Modelling (SEM) ... 162
4.6.2. Partial Least Squares Structural Equation Modeling (PLS-SEM) ... 172
4.6.3. Mediating effect ... 174
4.6.4. Content analysis ... 176
4.7. Validity and Reliability ... 177
4.7.1. Validity ... 178
4.7.2. Reliability ... 179
4.8. Response rate... 181
4.9. Response and Non-Response bias ... 182
4.10. Ethical considerations ... 184
4.11. Chapter summary ... 184
CHAPTER FIVE: DATA ANALYSIS OF STUDENTS SAMPLE ... 188
5.1. Introduction ... 188
5.2. Descriptive statistics ... 188
5.2.1. IT infrastructure services ... 189
5.2.2. E-learning system quality ... 190
5.2.3. Information quality ... 190
5.2.4. Service delivery quality ... 190
5.2.5. Perceived usefulness ... 191
5.2.6. User satisfaction ... 191
ix
5.4.1. Stage One: One-factor congeneric measurement model ... 194
5.4.2. Stage two: Exogenous and endogenous factors first-order CFA ... 206
5.4.3. Stage three: Measurement model ... 212
5.4.4. Stage Four: Testing the validity and reliability ... 215
5.4.5. Testing the study model and hypotheses ... 219
5.5. Outcomes of hypotheses tests ... 235
5.6. Content Analysis of Students’ Comments ... 238
5.6.1. Service Delivery Quality ... 238
5.6.2. System quality ... 243
5.6.3. Information quality... 245
5.6.4. Perceived Usefulness ... 248
5.6.5. User satisfaction ... 248
5.6.6. Self-efficacy and IT infrastructure services support ... 249
5.7. Chapter summary ... 250
CHAPTER SIX: DATA ANALYSIS OF ACADEMIC STAFF SAMPLE ... 254
6.1. Introduction ... 254
6.2. Descriptive statistics ... 254
6.2.1. IT infrastructure services... 254
6.2.2. System quality ... 255
6.2.3. Information quality... 255
6.2.4. Service delivery quality... 256
6.2.5. Perceived usefulness ... 256
6.2.6. User satisfaction ... 256
6.2.7. Customer value... 257
6.2.8. Organisational value... 257
6.3. Treatment of missing data, outliers, and normality for academic staff sample ... 258
6.4. Establish the measurement model and test study model and hypotheses of academic staff sample ... 258
6.4.1. First stage: Measurement model ... 260
6.4.2. Second Stage: Structural model of academic staff sample ... 268
6.4.3. Third stage: Testing the mediation of SDQ on perceived usefulness 273 6.4.4. Testing the mediation of SDQ on user satisfaction ... 279
6.5. Outcomes of hypotheses tests ... 283
6.6. Content analysis of comments from academic staff ... 286
6.6.1. Service delivery quality... 287
6.6.2. System Quality ... 289
6.6.3. IT infrastructure services support... 290
6.6.4. Perceived usefulness ... 291
6.6.5. Skill ... 291
6.6.6. Information quality... 291
6.6.7. User satisfaction ... 291
6.7. Chapter summary ... 292
CHAPTER SEVEN: DATA ANALYSIS OF ICT STAFF SAMPLE ... 294
7.1. Introduction ... 294
7.2. Descriptive statistics of ICT staff sample ... 294
7.2.1. IT infrastructure services... 295
x
7.2.5. Perceived usefulness ... 296
7.2.6. User satisfaction ... 296
7.2.7. Customer value ... 296
7.2.8. Organisational value ... 296
7.3. Measurement model of ICT staff sample ... 297
7.4. Testing the reliability and validity of the model ... 306
7.5. Testing the structural model of ICT staff sample ... 309
7.6. Content Analysis of ICT Staff Comments ... 338
7.7. Chapter summary ... 338
CHAPTER EIGHT: DISCUSSION OF RESULTS ... 342
8.1. Introduction ... 342
8.2. Measurement model ... 342
8.2.1. IT Infrastructure services ... 342
8.2.2. System quality ... 343
8.2.3. Information quality ... 344
8.2.4. Service delivery quality ... 345
8.2.5. Perceived usefulness ... 346
8.2.6. User satisfaction ... 347
8.2.7. Customer value ... 348
8.2.8. Organisational value ... 349
8.3. The structural model and hypotheses ... 350
8.3.1. IT infrastructure services hypotheses ... 351
8.3.2. System quality hypotheses ... 357
8.3.3. Information quality hypotheses ... 362
8.3.4. Service delivery quality hypotheses ... 366
8.3.5. Perceived usefulness hypotheses ... 371
8.3.6. User satisfaction hypotheses ... 374
8.3.7. Mediation effect hypotheses ... 376
8.4. Discussion of content analysis results ... 384
8.5. Chapter summary ... 389
CHAPTER NINE: CONCLUSION AND RECOMMENDATIONS ... 392
9.1. Chapter Introduction ... 392
9.2. Conclusion ... 392
9.2.1. Objective one: E-learning systems success factors ... 393
9.2.2. Objective two: test the proposed model ... 395
9.2.3. Objective three: direct and mediation effect ... 396
9.2.4. Objective four: IT infrastructure services and e-learning systems success 400 9.3. Study contributions ... 401
9.3.1. Contribution to knowledge and theory ... 401
9.3.2. Contribution to practice ... 403
9.4. Recommendations ... 404
9.5. Limitations and future studies ... 408
9.6. Closing remarks... 410
REFERENCES ... 411
xi
Figure 2.1 ISO/IEC 9126-1 External and Internal Quality Attributes ... 29
satisfaction approaches... 61
Figure 2.2 The customer value framework ... 67
Figure 2.3 Theory of Reasoned Action ... 74
Figure 2.4 Technology Acceptance Model (TAM)... 75
Figure 2.5 Technology Acceptance Model (TAM2)... 78
Figure 2.6 Unified Theory of Acceptance and Use of Technology (UTAUT) ... 79
Figure 2.7 Integrated model of user satisfaction and technology acceptance ... 80
Figure 2. 8 Technology Acceptance Model 3 (TAM3)... 81
Figure 2.9 Unified Theory of Acceptance and Use of Technology (UTAUT 2) ... 82
Figure 2.10 DeLone and McLean model of information system success ... 93
Figure 2.11 Updated DeLone & McLean’s model of information system success ... 96
Figure 3.1 Study Model ... 119
Figure 4. 1 Mediating Effect ... 174
Figure 5.1One-factor congeneric measurement model of IT infrastructure (First iteration) ... 195
Figure 5.2 One-factor congeneric measurement model of IT infrastructure (Final iteration) ... 195
Figure 5.3 One-factor congeneric measurement model of system quality (First iteration) ... 198
Figure 5.4 One-factor congeneric measurement model of system quality (Final iteration) ... 198
Figure 5.5 One-factor congeneric measurement model of information quality (First iteration) ... 199
Figure 5.6 One-factor congeneric measurement model of information quality (Final iteration) ... 199
Figure 5.7 CFA measurement model of SDQ (First iteration)... 201
Figure 5.8 CFA measurement model of SDQ (Final iteration) ... 201
Figure 5.9 One-factor congeneric measurement model of perceived usefulness (First iteration) ... 203
Figure 5.10 CFA One-factor congeneric measurement model of perceived usefulness (Final iteration)... 203
Figure 5.11 One-factor congeneric measurement model of user satisfaction (First iteration) ... 204
Figure 5.12 CFA One-factor congeneric measurement model of user satisfaction (Final iteration)... 204
Figure 5.13 CFA One-factor congeneric measurement model of customer value (First iteration) ... 205
Figure 5.14 One-factor congeneric measurement model of customer value (Final iteration) ... 205
Figure 5.15 Results of CFA of exogenous constructs ... 208
Figure 5.16 Results of CFA of endogenous constructs (Initial model) ... 211
Figure 5.17 Results of CFA of endogenous constructs (Final iteration) ... 212
Figure 5.18 Measurement model of student sample ... 214
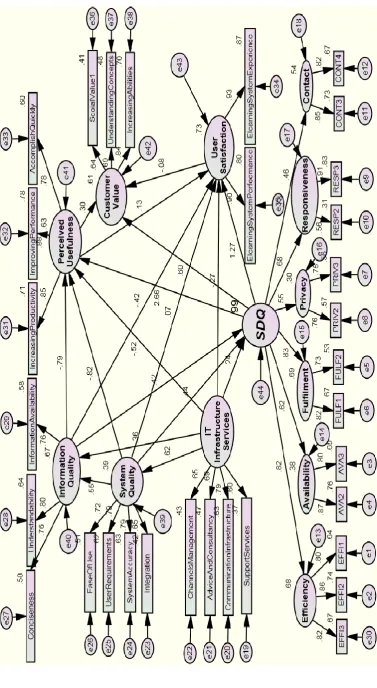
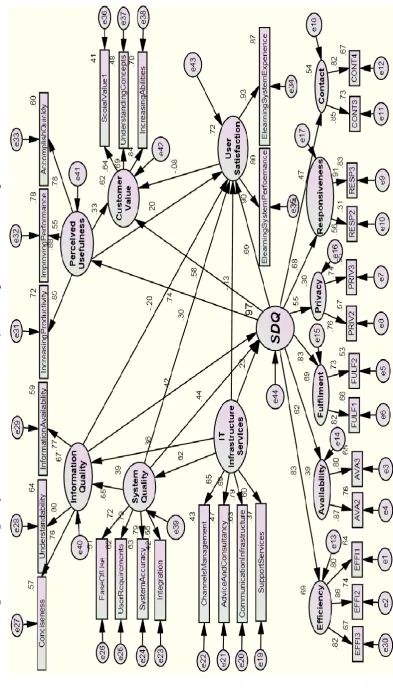
Figure 5.19 Test of the study model for Student Sample ... 221
xii
Figure 6.2 Test the study model of Acadmic staff Sample ... 270 Figure 6. 3 Results of regression analysis of the initial model without mediation paths for Acadmic staff sample ... 275 Figure 6.4 Results of conducting the model after testing the mediation role of SDQ ... 278 Figure 6. 5 Results of regression analysis of the initial model without mediation paths of user satisfaction for Academic staff sample ... 280 Figure 7. 1 Measurement Model of ICT staff sample (First iteration) ... 298 Figure 7.2 Measurement Model of ICT staff sample (Final iteration) ... 303 Figure 7.3 PLS analysis of impact of IT infrastructure services on System quality ... 311 Figure 7.4 PLS analysis of impact of IT infrastructure services on information quality ... 311 Figure 7.5 PLS analysis of impact of IT infrastructure services on SDQ... 312 Figure 7.6 PLS analysis of impact of IT infrastructure services on perceived
usefulness ... 313 Figure 7.7 PLS analysis of impact of IT infrastructure services on user satisfaction ... 313 Figure 7.8 PLS analysis of impact of system quality on information quality ... 314 Figure 7.9 PLS analysis of impact of system quality on service delivery quality ... 315 Figure 7.10 PLS analysis of impact of system quality on perceived usefulness ... 316 Figure 7.11 PLS analysis of impact of system quality on user satisfaction ... 316 Figure 7.12 PLS analysis of impact of information quality on service delivery quality ... 317 Figure 7.13 PLS analysis of impact of information quality on perceived usefulness ... 318 Figure 7.14 PLS analysis of impact of information quality on user satisfaction ... 318 Figure 7.15 PLS analysis of impact of service delivery quality on perceived
usefulness ... 319 Figure 7.16 PLS analysis of impact of service delivery quality on user satisfaction ... 320 Figure 7.17 PLS analysis of impact of service delivery quality on customer value 321 Figure 7.18 PLS analysis of impact of service delivery quality on organisational value ... 321 Figure 7.19 PLS analysis of impact of perceived usefulness on user satisfaction ... 322 Figure 7.20 PLS analysis of impact of perceived usefulness on customer value .... 323 Figure 7.21 PLS analysis of impact of perceived usefulness on organisational value ... 323 Figure 7.22 PLS analysis of impact of user satisfaction on customer value... 324 Figure 7.23 PLS analysis of impact of user satisfaction on organisational value ... 324 Figure 7.24 Testing the model of system quality impact on perceived usefulness with mediation... 328 Figure 7.25 Testing the final model of system quality impact on perceived usefulness with full mediation by service delivery quality ... 330 Figure 7.26 Testing the model of IT infrastructure services impact on user
xiii
Figure 7.29 Testing the final model of information quality impact on user
xv
Table 2.1 Terms used to search the relevant literature... 16
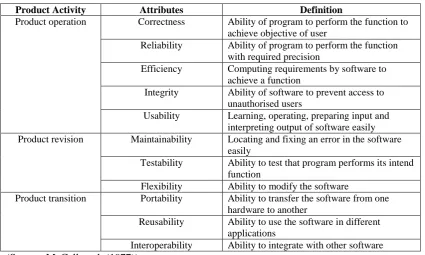
Table 2.2 Definitions of software quality factors... 28
Table 2.3 Selected research on website quality ... 33
Table 2.4 Summary of studies dealing with e-learning system quality ... 34
Table 2.5 Research measuring information quality ... 35
Table 2.6 Information Quality Product-Service Model ... 37
Table 2.7 Summary list of studies related to online quality service ... 45
Table 2.8 Perceived usefulness determinants ... 54
Table 2.9 Selected studies with shared aspects among the user ... 61
Table 2.10 Selected studies conducted to identify factors affecting user satisfaction ... 63
Table 2.11 Categories of IT benefits ... 69
Table 2.12 Dimensions of organisational effectiveness in higher education institutions ... 72
Table 2.13 Studies investigating the role of user involvement in the success of information systems ... 87
Table 2.14 Studies that investigated the role of user involvement in electronic systems ... 91
Table 2.15 Some Studies That Adopted TAM in the E-Learning System Arena .... 103
Table 2.16 Quality Fields and Their Dimensions ... 108
Table 2.17 Some Studies That Dealt With E-Learning Quality... 109
Table 3.1 List of Studies Supportive of Proposed Model ... 116
Table 4.1 Some indicators about USQ’s market ... 142
Table 4.2 Summary of pilot study ... 148
Table 4.3 Items of IT Infrastructure services ... 149
Table 4.4 Items of system quality ... 152
Table 4.5 Items of information quality ... 153
Table 4.6 Measurement of SDQ for students ... 155
Table 4.7 Measurement of SDQ for Academic staff... 155
Table 4.8 Measurement of SDQ for ICT staff ... 156
Table 4.9 Items of perceived usefulness ... 157
Table 4.10 Items of user satisfaction... 159
Table 4.11 Items of customer value ... 160
Table 4.12 Items of organisational value ... 161
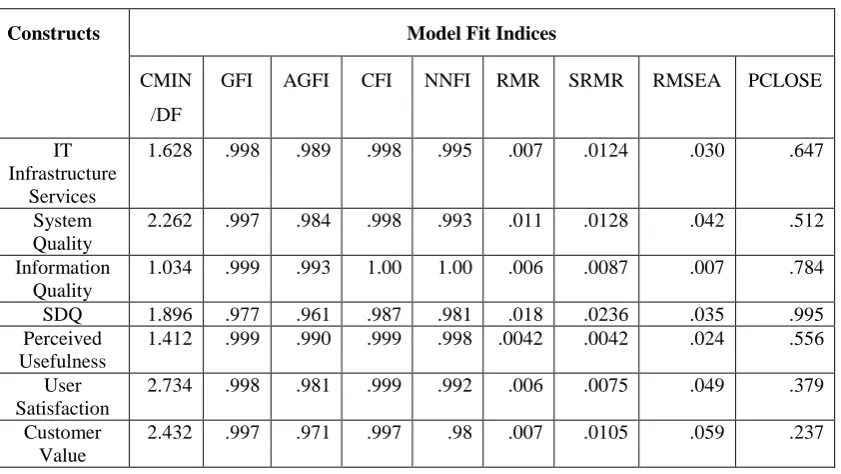
Table 4.13 Model fit indicess used in this study ... 172
Table 4.14 Response rate of the three samples ... 181
Table 5.1 Results of one-factor congeneric measurement model of system quality 198 Table 5.2 CFA Goodness-of-fit indicators of the SDQ... 202
Table 5.3 Summary of conducting one-factor congeneric measurement model (Student Sample) ... 206
Table 5.4 Results of CFA measurement model ... 215
Table 5.5 Reliability indicators ... 217
Table 5.6 Results of the one-factor congeneric measurement model ... 218
Table 5.7 Analysis of discriminant validity ... 219
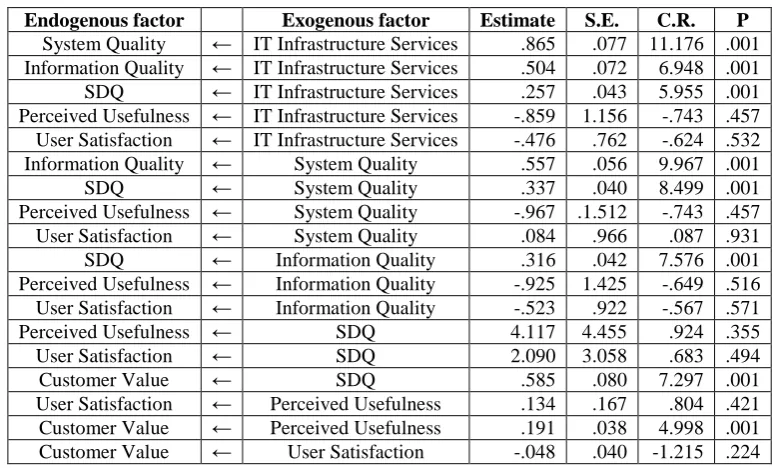
Table 5.8 Results of regression analysis of the model ... 222
xvi
Table 5.11 Comparison between the initial model without mediation and initial
model with mediation for students’ sample (Perceived Usefulness) ... 226
Table 5.12 Study model with mediation role of SDQ between predictor factors and perceived usefulness for student sample ... 227
Table 5.13 Results of testing mediation role of SDQ between the predictor factors and user satisfaction ... 229
Table 5.14 Comparison between the initial model without mediation and initial model with mediation for students’ sample (User Satisfaction) ... 230
Table 5.15 Results of regression analysis of the final model ... 232
Table 5. 16 Themes and sub-themes of content analysis of students’ comments.... 239
Table 6.1 Loading and cross loading of the constructs of the Academic staff sample ... 263
Table 6.2 Reliability indicators of academic staff sample ... 265
Table 6.3 Discriminant validity of Academic staff sample ... 267
Table 6.4 Indicators of validation of measurement and structural models ... 268
Table 6.5 The results of regression analysis of testing the academic staff model ... 271
Table 6.6 R2 values in the model of academic staff ... 271
Table 6.7 Results of testing mediation role of SDQ between the predictor factors and perceived usefulness for academic staff sample ... 274
Table 6.8 Regression results of testing the initial model of SDQ mediation for Academic staff sample (Perceived Usefulness) ... 276
Table 6.9 Comparison between the initial model without mediation and initial model with mediation (SDQ) for academic staff sample... 276
Table 6.10 Results of conducting the model after testing the mediation role of SDQ for academic staff sample (Perceived Usefulness) ... 277
Table 6.11 Results of testing mediation role of SDQ between the predictor factors and user satisfaction ... 279
Table 6.12 Results of regression analysis of the initial model without mediation (User Satisfaction) ... 281
Table 6.13 Comparison between the initial model without mediation and initial model with mediation (User satisfaction) ... 281
Table 6.14 Indicators of evaluation the final structral model of academic staff ... 282
Table 6.15 Themes and sub-themes of content analysis of academic staff comments ... 287
Table 7.1 Factors loading and t-value for ICT staff measurement model ... 299
Table 7.2 Indicators of ICT measurement model quality at the first iteration ... 300
Table 7.3 Eliminated items from the measurement model of ICT staff sample ... 301
Table 7.4 Cross loading of ICT staff model ... 304
Table 7.5 Reliability indicators of ICT staff sample after eliminted the weak items ... 306
Table 7.6 Discriminant validity of ICT staff sample ... 308
Table 7.7 the results of calculating R2, GoF, and Q2 for each PLS model for ICT staff ... 325
Table 7.8 Results of testing mediation role of SDQ between the predictor factors and perceived usefulness ... 327
xvii
xviii
Appendix A: Ethics Approval of USQ………. 461 Appendix B: Pilot study responses from three types of e-learning systems
stakeholders... 463 Appendix C: Student questionnaire………... 491 Appendix D: Academic staff questionnaire………... 497 Appendix E: ICT staff questionnaire………... 503 Appendix F: Statistical descriptives and normality test of student sample…. 509 Appendix G: Statistical descriptives and normality test of Academic staff
sample……….. 515 Appendix H: Statistical descriptives and normality test of Academic staff
sample………
xix
AGFI Adjusted Goodness-of-Fit Index AHP Analytic hierarchy process AST Adaptive Structuration Theory
AVA* Availability
AVE Average variance extracted BELS Blended E-Learning Systems C.R. Critical Ratio
CAS Computerized Accounting System CEO Chief executive officer
CFA Confirmatory Factor Analysis CFI Comparative Fit Index 2 Chi-square
CIO Chief information officer
CIS Customer Information Satisfaction
CONT* Contact
CPQ Consumer Products Questionnaire CSE Computer Self-Efficacy
CSF Critical Success Factors
CUSV* Customer value
DDLM Demand-Driven Learning Model DP Data Processing
DSS Decision Support Systems
EASE Electronic Assignment Submission Environment ECM Expectation-Confirmation Model
EDMS Electronic document management system EDT Expectancy Disconfirmation Theory
EFFI* Efficiency
eLSE e-Learning Systematic Evaluation ERP Enterprise resource planning e-SELFQUAL Online self-service quality e-SQ electronic Service Quality ESS Enterprise System Success eTailQ eTail Quality
ETM Educational Technology Model eTransQual Electronic transaction quality
FULF* Fulfilment
GFI Chi-Square, Goodness-of-Fit Index GoF Goodness-of-Fit
H2 Cross-validated communality
HELAM Hexagonal E-learning Assessment Model ICE Integrated Content Environment
ICT Information and communication technology IIT Image Interactivity Technology
IQ* Information Quality
IS Information system
ISSDOs Information System Service Delivery Organisations IT Information technology
ITIS Information technology infrastructure services
KMS Knowledge Management System LMSs Learning management systems ML Maximum likelihood
MOOC Massive Open Online Course NFI Normed Fit Index
NNFI Non-normed Fit Index
xx
PeSQ Perceived e-service quality PGFI Parsimony Goodness of Fit Index PIQ Perceived Information Quality PIRQ Perceived Internet Retailing Quality PLS Partial Least Squares
PLS-SEM Partial Least Squares Structural Equation Modeling PNFI Parsimony Normed Fit Index
PRATAM The Perceived Resources and Technology Acceptance Model
PRIV* Privacy
PSP/IQ Product and Service Performance Model for Information Quality PWQ Perceived web quality
Q2 predictive relevance QES Quality of Electronic Service QMS Quality Management System
QUIS Questionnaire for User Interface Satisfaction R&D Research and development
R2 Coefficient of determination
RESP* Responsiveness
RFID Radio Frequency Identification RMR Root Mean-square Residual
RMSEA Root Mean Square Error of Approximation
S.R.W. * Standardized Regression Weight
SATF* User satisfaction
SCT Social Cognitive Theory SDQ Service delivery quality SEM Structural Equation Modelling SMC Squared Multiple Correlation SOLE Soft Library Evolution
SQ* System Quality
SQM Software Quality Metrics
SQMAT Software Quality Measurement and Assurance Technology SRMR Standardise Root Mean-square Residual
TAM Technology Acceptance Model TLI Tucker-Lewis Index
TPB Theory of Planned Behaviour TQM Total Quality Management TRA Theory of Reasoned Action TRA Theory of Reasoned Action TTF Task-Technology Fit
UDA User Development computer Applications UIS User information satisfaction
USEF* Perceived usefulness
UTAUT Unified Theory of Acceptance and Use of Technology VET Vocational Education and Training
VLE Virtual Learning Environments WBL Web-Based Learning
WEBCT Web Course Tools
WebCT CCMS WebCT course content management system WebQual Web site quality
WWW World Wide Web ZOT Zone of Tolerance 2/df) Normed Chi-square
1
CHAPTER ONE
This chapter provides the introduction to explain this study. The study background
describes the main issues in the e-learning systems area and the issues to be
resolved in this study. The second part of the chapter provides the motivation for
conducting this study. The study problems are then outlined in the third part of this
chapter. The objectives of the study are presented in section four while section five
describes the significance of the study. Finally, the final section of this chapter
2
CHAPTER ONE: INTRODUCTION
1.1. Chapter introduction
Research should be conducted based on issues and problems that need to be resolved. The identification of the research problem, objectives and motivation to conduct the research are considered to be essential steps in this process. Accordingly, the first stage of this study is to overview the issues related to the success of e-learning systems that will be addressed in this research. In recent years, many universities and educational institutions have made considerable investments in e-learning systems. These systems deliver educational services via electronic channels. However, these universities and educational institutions still face problems in relation to evaluating the success of these systems. The issues and problems associated with evaluating the success of e-learning systems, the research motivation, and the objectives of this study are provided in this chapter.
1.2. Background to the study
Information technology (IT) has become an essential contributor to organisational success due to the critical role of IT in enabling the achievement of individual and organisational goals. The introduction of IT is no longer limited to back-office business functions, but has grown to include core processes in health, education, transport, banking, and other fields. The advantages generated by using technologies such as the Internet, hardware and software have pushed organisations to employ IT to facilitate more and more of their activities. Shannak (1999) argues that organisational performance is considered impracticable without Information Technology. The impact of using IT is extended to include the macro economy of different countries. Doig (2002) states that ‘The information revolution is sweeping through our economy. No company can escape its effects’ (p. 1).
3
technology in generating rapid change in higher education cannot be ignored. The education sector has received substantial benefits from using IT in its domain. The introduction of IT has supported communication between teachers and students, and communication between universities worldwide. Also, IT has enabled easier access to library resources in this sector. The introduction of IT in higher education is deemed to be the main key to quality improvements (Turoff, 1999).
E-learning is the main outcome of adopting and using the new and more advanced IT innovations in the education sector. These e-learning systems have also been adopted by non-educational organisations (Wang & Wang, 2009). Daneshgar and Toorn (2009) suggest that ‘In order to sustain competitive advantages in today’s economy, characterised by rapid change, knowledge-intensive and technological-orientation, organisations are adopting e-learning to facilitate the achievement of lifelong learning, and to retain employees’ (p.16). The introduction of e-learning systems enables non-educational organisations to receive valuable benefits. For example, IBM saved USD200 million in 1999, providing five times the learning at one-third the cost of their previous methods; and Rockwell Collins reduced training expenditure by 40 percent with only a 25 percent conversion rate to web-based training (Strother, 2002). According to Giga Information Group, use of an e-learning system to train employees rose from 21 percent in 2002 to 75 percent in 2005 (Wang & Wang, 2009).
4
institutions attempt to find effective approaches to enhance the process of knowledge transfer and to achieve their objectives. E-learning has been an effective way to achieve these two purposes.
In the USA, 90 percent of 2-year and 89 percent of 4-year public education institutions offered distance education courses in 2000-2001 with enrolments of 1,472,000 and 945,000 respectively out of total enrolment of 3,077,000 (Holsapple & Lee-Post, 2006). Updated statistics about the adoption of e-learning systems shows that in the USA, 44 percent of students took online courses in 2009 and this is expected to rise to over 80 percent in 2014 (Daniel, 2012a). Most universities in the United Kingdom are supporting their educational services and students via Virtual Learning Environments (VLE) (Ogba, Saul, & Coates, 2012).
Learning Management Systems (LMSs) have been adopted by 95 percent of all higher education institutions in the United Kingdom (McGill & Klobas, 2009). It is worth mentioning that transnational courses are delivered by most Australian universities via educational software (Shurville, O'Grady, & Mayall, 2008). According to the Australian Flexible Learning Framework (2009), a survey of registered training organisations (RTOs) indicated that 39 percent of all Vocational Education and Training (VET) activities were based on e-learning systems.
5
Information System Committee (JISC) and Higher Education Academy (HEA) (England), and National Digital Learning Resources (NDLR) (Ireland) (Pantò & Comas-Quinn, 2013).
Some issues are still being encountered in e-learning. One of these issues is the high incompletion rates by students in courses (Crawford & Persaud, 2013). For example, in 2012 the MIT released its first MOOC (Massive Open Online Course) and the number of students enrolled was 155,000; however, the number of students who passed a course as a whole was only 7,000: a dropout rate of more than 95 percent (Daniel & Uvalić-Trumbić, 2013). This high rate of drop out was justified by Programme’s Head, MIT, ‘If you look at the number of passes in absolute terms, it’s as many students as might take the course in 40 years at MIT’ (as cited in Daniel & Uvalić-Trumbić, 2013, p. 2). Pisutova (2012) offered another reason for this issue and states that ‘For face-to-face as well as traditional online courses, the drop-out rates are significant in quality assessment. MOOCs with their less that 10% completion rate would not score very high in this sense’ (2012, p. 299). Bates (2011) also agrees about the role of quality issue in failure of e-learning systems because some educational institutions still fail to meet best quality standards for e-learning. From these indicators it can be seen that the issue of high rate of drop-out may be related to the issues of courses, services, and education quality. The issues of e-learning systems mentioned above are interlinked and are related to, and can be classed as, part of e-learning systems success. It is illogical to consider these issues in isolation.
6
be a central concern for the researchers and stakeholders of these systems. For example, MacDonald and Thompson (2005) state that ‘Educators and researchers have voiced concern over the lack of rigorous evaluation studies of e-learning programs’ (p. 1). According to Ardito et al. (2006) an effective methodology to evaluate e-learning system success is still unavailable. The issue of lack of an effective methodology to evaluate e-learning system success is no longer restricted to the higher education field, but now extends to non-educational organisations. Wang et al. state that ‘Little research has been conducted to assess the success and/or effectiveness of e-learning systems in an organisational context’ (2007, p. 1792). The issue of evaluating the success of information systems generally and e-learning systems in particular has become more complicated due to the differing viewpoints of stakeholders. Different groups of stakeholders deal with e-learning systems, for instance, students, academic staff, ICT staff, top management and developers. However, these stakeholders exhibit substantial differences in their objectives and often conflicting viewpoints exist (Ozkan & Koseler, 2009; Sedera, Tan, & Dey, 2007). This issue is still a key concern in the information systems field: ‘The concern is that different employment cohorts have differing experiences of the system. Yet, IS studies have, in the main, attempted to quantify the impacts of IS by analysing data collected from only a single employment cohort’ (Gable, Sedera, & Chan, 2008, p. 8).
Another issue is that the selection of factors to measure the success of e-learning systems often focuses on a single factor, especially user satisfaction, and ignores the success of e-learning systems: ‘over three-quarters of all evaluations conducted are targeting users’ satisfaction and not learning success, transfer, or return of investment of an educational process’ (Ehlers & Hilera, 2012, p. 1).
Evaluating the success of e-learning systems is a key issue in this field. The variety of stakeholders and their objectives and the selection of factors could impact the success of e-learning systems–which makes this issue more complicated.
1.3. Motivation for the study
7
software and platforms used to provide users with online services have also received substantial attention. Australia is one of the leading countries in distance and online education. In Australia, the first department of Correspondence Studies was created by the University of Queensland in 1911 (Daniel, 2012a). Currently, most Australian universities have adopted e-learning systems to provide students around the world with educational services (Shurville et al., 2008). The growth in the adoption of e-learning systems reflects it significance in the field of education, thus, it needs more research to understand the issues and recommend solutions. This study deals with success of e-learning systems and will be useful in enhancing the understanding of factors affecting the success of these types of systems.
The second motivation for this study is the gap in the literature. E-learning systems are considered to be multidisciplinary so the evaluation of these systems depends on different points of view (Ozkan & Koseler, 2009). Before 1990, the evaluation of e-learning systems success received little attention from researchers. According to McGorry (2003), the main direction of research was on the differences between traditional and distance education. After 1990, the direction of research in this field started to focus on the issue of the quality of e-learning (MacDonald & Thompson, 2005; McGorry, 2003). This direction was supported after attention was paid to this issue by some educational institutions such as the WesternInterstate Commission for Higher Education (WICHE) and the Institute for Higher Education Policy (Frydenberg, 2002). Quality is considered to be an essential factor in assessing e-learning system success, however, there are other factors that should be considered in the evaluation process.
8
stakeholders such as academic staff, students and ICT staff are considered in this model. Three instruments are designed to measure e-learning system success, but with different users. The diversity of stakeholders who evaluate e-learning systems will provide a holistic picture about these systems and their outputs.
Another gap in the literature is the role of IT infrastructure services in the success of e-learning system success. There are few studies dealing with issues in the e-learning system arena. This issue is confirmed by Xu et al. (2010) who state that ‘Despite the abundance of research on IT infrastructure capabilities, the questions of how organisations can leverage IT infrastructure capabilities to achieve IT project success remains unanswered’ (2010, p. 124).
The third motivation is related to the advantages that can be obtained from this study and provided to practitioners. This study is conducted empirically and includes three types of stakeholders: students, academic staff and ICT staff. Obtaining results from these stakeholders can be useful in identifying the issues in e-learning systems and the factors influencing the success of these systems. Obtaining results can be useful to generate recommendations to senior managers of universities, educational institutions and practitioners to solve the problems and enhance the performance of e-learning systems.
1.4. Study problem
9
ERP systems were behind schedule or over budget and the success rate is around 33 percent.
Electronic applications such as e-commerce, e-learning, e-health and e-banking have become commonplace throughout the last decade. However, these applications are still facing the challenge of failure. For instance, the initiatives of e-commerce still encounter problems. Pather (2006) states that ‘There is little understanding of the crucial importance of managing the technology through which the Internet and Web delivers e-Commerce opportunities’ (p. iii).
E-learning systems also encounter the problem of failure. Despite the considerable resources invested in e-learning systems, some organisations continue to fail to meet the targeted advantages (Strother 2002). According to Rovai and Downey (2009), the British Government spent $113 million in 2000 to establish an e-learning project called The United Kingdom e-University (UKeU). In February 2004, the British Government announced that UKeU had failed because it did not meet recruiting targets. In another example, New York University online (NYU) closed due to economic conditions. The challenge of failure is not limited to e-learning systems projects that are in the establishment stage, but includes those already in place. In this regard, Bates (2011) identified three main issues from 11 case studies and a literature review: increased cost of online education due to the high investment in information technology and supporting staff without replacing activities; there is no evidence about improvements in learning outcomes; and some educational institutions still fail to meet best quality standards for e-learning.
10
2006; McGorry, 2003; Y. S. Wang et al., 2007). Consequently, the key research questions are:
What are the key factors considered to be important in measuring e-learning system success?
Is the model to measure e-learning system success proposed in this study valid and reliable to evaluate e-learning systems from different points of view (with different users)?
1.5. Study objectives
This study deals with the issue of e-learning systems success. Different factors are considered to evaluate their success. Furthermore, the variety of stakeholders is taken into account in this study to evaluate the success of e-learning systems. Accordingly, measuring e-learning system success is the main objective of this study. To achieve this objective, a model has been proposed. More specifically, the objectives of this study are:
1. To determine what factors affect e-learning systems success and place them in a holistic model.
The focus of this objective is to select factors from the literature that impact the success of e-learning systems. Then, the selected factors are placed in a model to measure the success of e-learning systems. The relationships among the factors in the proposed model are established based on the theoretical justifications from information systems and e-learning systems literature.
2. To test the validity and reliability of the proposed model and confirm that the model is suitable to measure the success of e-learning systems from different points of view.
11
3. To determine the type and power (significance) of relationships between those factors in the context of the proposed model, and to measure the direct and indirect effects between constructs of the study model.
Two types of relationships are investigated in the study model: direct and mediation. This objective is stated to identify the type of relationships between the constructs of study model, positive or negative, and the significance of these relationships. In addition, service delivery quality is selected to be a mediation construct in the study model. Accordingly, the role of service delivery quality is examined in this study. 4. To identify the role of IT infrastructure services in the success of e-learning
systems.
One of the issues presented in this study is the role of IT infrastructure services in the success of e-learning systems. IT infrastructure services is included in the study model as a foundation construct to achieve the success of e-learning systems. Accordingly, this objective is formulated to investigate IT infrastructure services as a construct to measure e-learning systems success.
1.6. Significance of study
E-learning systems have become essential in universities and substantial funds are invested annually on these systems (Georgina & Olson, 2008). Hence, assessing e-learning systems success is a crucial issue. The process of evaluating e-e-learning systems success is significant because it assists in managing, maintaining and developing these systems; and in diagnosing the problems that need to be solved. The main purpose of the evaluation process is to ensure that the objectives of implementing the systems are achieved. The differences in goals of stakeholders create a difficulty in assessing the success of e-learning systems. Most of the previous research that has dealt with the e-learning systems success issue was limited to one type of stakeholder (i.e. students) and ignored the other categories of stakeholders. The significance of this study is in identifying the factors impacting on the success of e-learning systems and placing these factors in a proposed model. Four views have been considered in designing the study model:
12
2. Attitude view: this view includes the factors that deal with user behaviour in using e-learning systems and the satisfaction gained from the use of these systems.
3. Marketing view: includes the factors relating to the product of e-learning systems (e-learning service). These factors relate to service delivery quality and IT infrastructure service.
4. Organisational view: this view relates to net benefits generated from using e-learning systems. The net benefits constructs have been prepared based on organisational effectiveness literature, especially through the contributions of Cameron (1978, 1981, 1986).
Another contribution of the study will be through the constructs of e-learning systems value. Perez-Mira (2010) states that ‘Individual impact per se is the most ambiguous to define … Organisational impact does not have a clear and defined measurement variable’ (p. 25). Different views of value will be employed to measure the net benefits of e-learning systems dealing with customer value and organisational value. These two types of value will provide a comprehensive picture about the value generated by e-learning systems. IT infrastructure services has been used as a construct in this model. To the author’s knowledge, this factor has rarely been used as a construct to measure information systems and e-learning system success. Thus, the validity and reliability of this construct in measuring e-learning success will be tested in the context of this model.
This study will provide universities with a model and instruments for the evaluation of e-learning system success. This study will also assist them to identify the problems and shortfalls in the success of e-learning systems. Based on the findings, some recommendations will be proposed to enhance the performance of e-learning systems and to solve the problems and shortfalls in these systems.
1.7. Dissertation outline
13
Chapter 2 is allocated to reviewing the literature related to this study. The emphasis of this chapter is an overview of the studies dealing with success of information systems and e-learning systems. In addition, the review includes literature related to the constructs of the study model.
The proposed model to measure the success of e-learning systems in this study is presented in Chapter 3. This chapter comprises the proposed model, studies that support establishing this model, and selection of the constructs of the model, research philosophy and approach, and formulation of the hypotheses based on the relationships among the model constructs.
In Chapter 4, the research methodology is outlined. It includes the study method and the justification for its adoption, study sample, study instrument, data collection method, data analysis, and the ethical considerations in this study.
The next three chapters provide an overview of the analysis of the data: Chapter 5 presents the data analysis of the student sample; Chapter 6 is allocated to analysis of data of the academic staff sample; and Chapter 7 presents results for the ICT staff sample.
The study results obtained from Chapters 5, 6 and 7 are discussed in detail in Chapter 8. Finally, Chapter 9 provides a conclusion to the study and focuses on an overview of the achievement of the study objectives, contributions, recommendations, and suggestions for future research.
1.8. Chapter summary
15
CHAPTER TWO
This chapter reviews the literature related to the study. This chapter includes three
main parts. The first part focuses on the studies related to the constructs of the study
model. The issues, measures, and conceptual framework of each construct are
presented first. The second and third parts are allocated to the approaches of
16
CHAPTER TWO: LITERATURE REVIEW
2.1. Chapter introduction
The previous chapter provided an introduction to this study. The main objective of this study is to propose a model to measure the success of e-learning systems success from different points of view. The constructs included in the study model are obtained from the literature on information systems and e-learning systems. However, there is a wide range of studies dealing with evaluation of information systems and e-learning systems and that requires an effective technique to review these studies. Thus, the literature review begins with the suggested constructs of the study model: information technology infrastructure services; system quality; information quality; service delivery quality; perceived usefulness; user satisfaction; customer value; and organisational value. Then, the literature related to evaluation and success of information and e-learning systems is reviewed via specific approaches suggested to classify studies that have dealt with this subject.
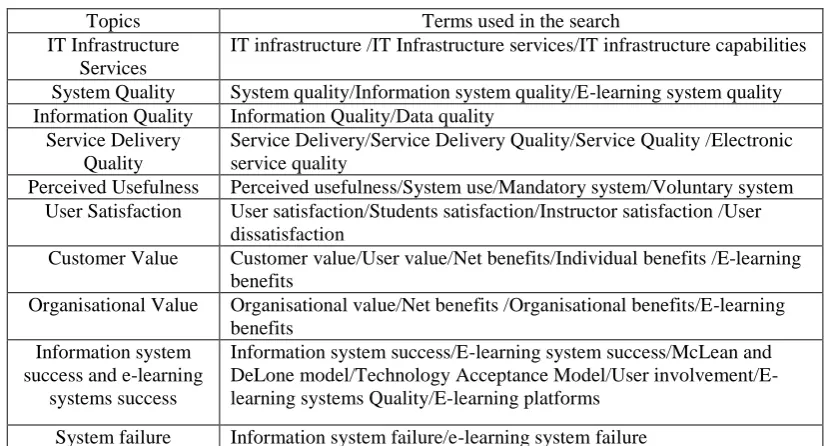
[image:38.595.63.477.507.730.2]A systemic literature review was undertaken of relevant contributions in the information systems and e-learning systems fields. Search parameters included all the constructs of the study model, information system success, and e-learning system success. To include most of the relevant literature in this study, different key words were employed as shown in Table 2.1.
Table 2.1 Terms used to search the relevant literature
Topics Terms used in the search IT Infrastructure
Services
IT infrastructure /IT Infrastructure services/IT infrastructure capabilities System Quality System quality/Information system quality/E-learning system quality Information Quality Information Quality/Data quality
Service Delivery Quality
Service Delivery/Service Delivery Quality/Service Quality /Electronic service quality
Perceived Usefulness Perceived usefulness/System use/Mandatory system/Voluntary system User Satisfaction User satisfaction/Students satisfaction/Instructor satisfaction /User
dissatisfaction
Customer Value Customer value/User value/Net benefits/Individual benefits /E-learning benefits
Organisational Value Organisational value/Net benefits /Organisational benefits/E-learning benefits
Information system success and e-learning
systems success
Information system success/E-learning system success/McLean and DeLone model/Technology Acceptance Model/User involvement/E-learning systems Quality/E-involvement/E-learning platforms
17
Google Scholar was used as it provides instant access to all database that were linked to University of Southern Queensland (USQ) for instance EBSCO, Sciences Direct, Emerald Management eJournals, and SAGE Management and Organisation Studies. The search was not limited to a single term but included more than one term during the search process to obtain as much relevant literature as possible related to these terms. For instance, the term IT infrastructure services was searched along with terms such as information system success and e-learning systems. This strategy was conducted with all the other terms used to search the relevant literature. Search parameters and publications reviewed were within the period from the 1970s to 2013.
2.2. Information technology infrastructure services
Significant attention has been paid to information technology infrastructure services (King & Flor, 2008; Sobol & Klein, 2009). This attention is considered to be as a result of the crucial role of IT infrastructure services on organisational outcomes and growth. Substantial proportions of the budgets of companies are allocated to investment in IT infrastructure services. According to Byrd and Turner (2000), 58 percent of an organisation's IT budget is spent on IT infrastructure services. The added value of IT infrastructure services is extended to include fast response, organisational learning, fact-based decision making, productivity improvement, inter-organisational coordination and organisational flexibility (Davenport & Linder 1994). IT infrastructure services are vitally significant to organisations working in dynamic environments and aiming to re-engineer their business processes (Duncan 1995). However, there are still some issues confronting organisations in regard to IT infrastructure services. Decision making on investment in IT infrastructure services flexibility and the role of IT infrastructure services in the success of information systems is believed to be the main recent issue concerning this domain. Most of the research carried out in this arena attempts to address these issues.
2.2.1. Issue of investment in IT infrastructure and its impact on ensuring
organisational performance
18
are indispensable aspects of IT infrastructure to boost organisational efforts in achieving competitive advantage: core technologies; technical functionality; business applications; business information and business process support.
In the context of information systems professionals, Lee, Trauth, & Farwell (1995) studied the skills and knowledge requirements of information systems professionals as an essential infrastructure aspect of IT. Their study concluded that ‘the requirements from IS professionals are becoming more demanding in multiple dimensions, particularly in the areas of business functional knowledge and interpersonal/ management skills’ (Lee et al., 1995, p. 313). Four skills and knowledge requirements of IS professionals were agreed as critical for IT infrastructure were: technical specialties knowledge; knowledge of technology management; business functional knowledge; and interpersonal and management skills.
Broadbent and Weill (1997); Broadbent et al. (1999), Weill and Vitale (2002); and Weill et al. (2002) have added important contributions in addressing the issue of investment in IT infrastructure services. Broadbent and Weill (1997) proposed a new approach to assist managers in identifying significant IT capabilities to achieve organisational goals. According to the above authors, there are three elements of IT infrastructure necessary to enhance business processes: human IT infrastructure; shared IT services; and IT for business process.
19
classified into two categories: five core IT infrastructure services and 18 additional IT infrastructure services.
In 1999, Broadbent et al. (1999) continued to develop a framework of IT infrastructure. This effort is considered to be an expansion of their 1997 study. In this contribution, the four dimensions of a firm’s context have been recognised as critical aspects in evaluating patterns of IT infrastructure capability: industry differences; marketplace volatility; business unit’s synergies; and strategy formation processes. Another construct of this framework is IT infrastructure capability. IT infrastructure capability is believed to be the result of combining two elements, functionality and connectivity. To define these elements, Broadbent et al. (1999) state that ‘functionality is defined by the infrastructure services offered firm-wide. Connectivity is identified by the infrastructure reach and range’ (p. 162). In this empirical study, 23 services were identified and categorised into eight groups based on the nature of the services. These groups were application management, communication management, data management, IT R&D, services management, security management, standards management, and IT management.
20
and Education (2). The main contributions of this study were firstly increasing the number of IT services identified in large organisations from 23 in 1997 to 70 in 2001; and, secondly, an increase in spending on these services compared to previous years.
King and Flor (2008) conducted a study on IT infrastructure in the global domain. The purpose of that study was to investigate the role of global strategic orientation in global IT infrastructure capabilities, employing global integration as a mediator. Various elements of IT infrastructure have been used to measure this factor such as: hardware platform; operating system; network and telecommunication technologies; and databases. Shared support services have also been employed to measure IT infrastructure, which contains the management of communication networks, data management, and the identification and testing of new technologies. The range and reach of IT infrastructure capabilities has also been explored in this measurement. The main result of this research is the findings that human resources significantly affected the reach, range, support services and planning of the global IT infrastructure.
The effects of the CIO’s background and IT infrastructure on economic performance were studied by Sobol and Klein (2009). Technical services, application services, management services, hardware and data services were used to measure IT infrastructure. IT orientation (utilitarian, strategic) has been employed in this study. Size, performance, market and knowledge were used to measure economic performance. In regard to IT infrastructure, results confirmed that IT infrastructure services significantly affected financial performance. Also, the findings pointed to some IT infrastructure components becoming more important due to growth in organisations and market size. A study by Chen and Tsou (2012) adopted IT infrastructure (as a measure of IT capability) as a determinant of firm performance. The findings of the study concluded that the impact of IT capability on organisational performance is mediated by service process.
21
used to assess the range of IT infrastructure services. The findings of the study confirm that IT infrastructure positively affected IT-dependent information agility. Also, the technical and behavioural capabilities of IT personnel positively influenced IT infrastructure services.
The impact of IT assets (IT infrastructure and enterprise information systems) on organisational capabilities was investigated by Luo, Fan, and Zhang (2012) who state that ‘Our empirical study results show that IT can lead to higher level of organisational capabilities’ (p. 186).
The studies above clearly demonstrate the decision of investment in IT infrastructure services is still viewed as a key issue in this field. Furthermore, there are issues which to date have not yet been investigated, for example, the issue of IT infrastructure integration. In this regard, Bradley, Pratt, Thrasher, Byrd, and Thomas (2012) state that ‘After extensive research we found no studies that investigated a likely antecedent to IT infrastructure integration—IT capability intentions’ (p. 2971). Accordingly, the impact of IT infrastructure services on organisational activities still needs further investigation by researchers.
2.2.2. Issue of IT infrastructure flexibility
Some of the research dealing with IT infrastructure issues adopted another direction: the flexibility of IT infrastructure. The flexibility aspect is considered to be valuable for organisations because this factor supports the ability to use infrastructure technology competitively (Duncan, 1995). However, there is a shortfall in the measurement of IT infrastructure flexibility. To fill this gap, Duncan (1995) conducted a study to explore characteristics of flexibility. The first stage in this study used the Delphi method to investigate this critical issue from a practitioner's point of view. The next step comprised of extensive semi-structured interviews conducted with information systems planning executives from three major insurance firms in Texas and a major investment bank in New York. One of the most important results of this study is the identification of infrastructure flexibility dimensions: platform; network/telecom; data and applications.
22
eight aspects of flexibility: IT connectivity; application functionality; IT compatibility; data transparency; technology management; business knowledge; management knowledge; and technical knowledge. Analysis of results indicated that the instrument is valid and reliable.
Attempts to investigate the role of flexibility in enhancing business value are continuing. Fink and Neumann (2009) designed a model to study the impact of human IT infrastructure and technical IT infrastructure on business value—strategic alignment and IT-based competitive advantage. Organisational size and reporting level of the top IT executive were considered as organisational moderators of business value. A total of 293 IT managers participated as a sample for this study. The results concluded that human IT infrastructure and technical IT infrastructure enabled flexibility.
Organisational responsiveness and competitive advantage are deemed to be strategic objectives in organisations. Bhatt et al. (2010) studied the effect of IT flexibility on organisational responsiveness and its subsequent impact on competitive advantage. The empirical study confirmed that IT infrastructure significantly affected information generation and dissemination. Also, IT infrastructure flexibility was a critical factor in enhancing organisational responsiveness. The same findings were generated from a study by Prasad, Heales, and Green (2010) that confirmed the vital role of flexible IT infrastructure in enhancing internal process performance, which in turn significantly influenced customer service process performance and firm-level performance.
IT infrastructure flexibility also impacted organisational agility. A study by Chen and Siau (2012) confirmed the significant role of IT infrastructure flexibility as an antecedent of organisational agility.
23
related to the impact and role of IT infrastructure flexibility still need to be explored and investigated.
2.2.3. Issue of IT infrastructure impact on information systems success
The impact of IT infrastructure services on information systems success is still under investigation by researchers. However, there is not sufficient evidence about the role of IT infrastructure in enhancing the success of information system projects. In this regard, (Xu et al., 2010) state that ‘Despite the abundance of research on the IT infrastructure capabilities, the question of how organisations can leverage IT infrastructure capabilities to achieve IT project success remains unanswered’ (p. 124).
To investigate the role of IT infrastructure in the success of information systems, some studies adopt this factor as an essential factor affecting system success. Finlay and Forghani (1998) studied the factors affecting the success of Decision Support Systems (DSS). The result confirmed that learning and support IT infrastructure surrounding the DSS development is deemed to be a significant factor impacting on the success of these systems. The empirical study of Shaw (2002) support the view that the technological changes in IT infrastructure impact user acceptance of information technology. Shang and Seddon (2002) explored IT infrastructure as a fundamental source to generate the benefits of ERP and attain success. The benefits of IT infrastructure in the context of ERP were building business flexibility for current and future changes to reduce IT costs and to increase IT infrastructure capability.