Implementation of Conditional Moment
Closure in a Zero-Dimensional Model for HCCI
Engines and Comparison with Experiment
A Dissertation Submitted by
Abdul Aziz Hairuddin
B. Eng (Mechanical)
for the award of
Doctor of Philosophy
© 2014
To my beloved parents,
ABSTRACT
Homogeneous charge compression ignition (HCCI) engines have been an active research area recently due to their advantages in reducing emissions levels. Regulatory bodies, such as those in Europe, the United States and Japan, are imposing stringent vehicle emissions quality standards. Most automotive manufacturers are moving towards fuel efficient vehicles by developing hybrid (combination of two or more power sources) vehicles or improving on any conventional engine technology that can reduce emissions levels. Hybrid vehicles are receiving increasing attention from most manufacturers because they offer advantages including reduced emissions and providing good mileage per fuel tank. The HCCI engine has the potential to replace the current conventional engine used in hybrid vehicles, which can reduce the emissions levels further.
To improve the development work, simulations are undertaken to reduce research costs while maintaining good productivity because of their cost efficiency compared to experiments. For engine research, a zero-dimensional model is known for its advantage in reducing computational time compared with a multi-dimensional Computational Fluid Dynamics (CFD) approach. CFD yields more accurate results but requires greater computational resources and time, while a zero-dimensional model offers versatility in a reduced simulation time. However, the zero-dimensional model has the limitation of a shorter combustion duration and rapid pressure rise compared to the experiment. Also, the zero-dimensional model is incapable of using the actual intake air temperature and needs to be set higher than the actual.
The goals of the thesis are to write a new computer program that implements the combined model and develop a new experimental test rig for HCCI. The main focus of the thesis is to obtain an improved result for the combined model against the zero-dimensional model, while the experimental results will be used for the purpose of validation. The thesis consists of nine chapters. The first two chapters after the introduction cover the HCCI engine background and performance irrespective of the fuel being used and a background to turbulence, which introduces some turbulent theories and conservation equations. Chapter 4 discusses the details of the numerical part, which consists of all the formulations being used in the combined model. Then Chapter 5 will validate the combined models against two experimental works from others, which use diesel and gasoline fuelled HCCI engines. Chapters 6 and 7 introduce the experimental work setup and engine performance comparison between SI and HCCI modes. Chapter 8 continues the validation of the combined model based on the HCCI engine developed in the experimental work, followed by the Conclusion.
CERTIFICATION OF DISSERTATION
I certify that the ideas, designs and experimental work, simulation and software, results, analyses and conclusion set out in this dissertation are entirely my own effort, except where otherwise indicated and acknowledged.
I further certify that the work is original and has not been previously submitted for assessment in any other course or institution, except where specifically stated.
ABDUL AZIZ HAIRUDDIN W0108673
_______________________________ Signature of Candidate
_______________________________ Date ENDORSEMENT
_______________________________ Signature of Principal Supervisor, Dr. Andrew Wandel
_______________________________ Date
_______________________________ Signature of Associate Supervisor, Assoc. Prof. Dr. Talal Yusaf
ACKNOWLEDGEMENTS
First and foremost, a special thank you to my principal supervisor, Dr. Andrew Wandel, for his strategic advice, guidance, constructive criticism and technical assistance with the numerical part of the study. To my associate supervisor, Assoc. Prof. Dr. Talal Yusaf, for his generosity, grounding advice and help with the experimental part of the study. I am truly appreciative of their help and support throughout the duration of my studies, which has helped me broaden my knowledge and develop new skills.
I would also like to thank P7 technical staff Joshua Hopf and Dr. Paul Baker for their help in developing my experimental setup. Mechanical workshop technicians Brian Aston and Chris Galligan for their help in fabricating the experimental apparatus. I have not forgotten Dean Beliveau and Richard Landers who helped develop the data acquisition system. Also to Adrian Blokland and Terry Byrne for providing technical support and help with providing the required resources.
A big thank to my parents and siblings for their endless support throughout my studies. My wife and daughter who helped brighten life in Australia. Also to my extended family members for their direct or indirect support. Their support in this manner is much appreciated.
Last but not least, I would like to express my greatest appreciation to the Ministry of Education Malaysia and Universiti Putra Malaysia which sponsored my studies. Without them, I would not have been able to achieve my goal.
ABDUL AZIZ HAIRUDDIN University of Southern Queensland
LIST OF PUBLICATIONS AND PRESENTATIONS
2013
Hairuddin, AA, Wandel, AP & Yusaf, T 2013, ‘Implementation of CMC in a 0-D single-zone model of a diesel HCCI engine’, in the Proceedings of the Australian Combustion Symposium (ACS2013), 6-8 Nov 2013, Perth, Australia.
Hairuddin, AA, Wandel, AP & Yusaf, T 2013, ‘A homogeneous charge compression ignition engine: an introduction’, in the 3rd Malaysian Postgraduate Conference (MPC 2013), 4-5 Jul 2013, Sydney, Australia.
Hairuddin, AA, Wandel, AP & Yusaf, T 2013, ‘The effect of different heat transfer models on a diesel homogeneous charge compression ignition (HCCI) engine’,
International Journal of Automotive and Mechanical Engineering, vol. 8, pp. 1305-17, ISSN 2229-8649.
Hairuddin, AA, Yusaf, T & Wandel, AP 2014, 'A review of hydrogen and natural gas addition in diesel HCCI engines', Renewable and Sustainable Energy Reviews, vol. 32(April 2014), pp. 739-61.
2012
Hairuddin, AA, Yusaf, TF & Wandel, AP 2012, ‘HCCI engine: numerical and experimental approach’, in the USQ Combustion Meeting, 26 Sep 2012, Toowoomba, Australia. (Unpublished)
2011
Noor, MM, Hairuddin, AA, Wandel, AP & Yusaf, TF 2011, ‘Implementation of conditional moment closure using the Taylor expansion and finite differences’, in the 1st International Conference of Mechanical Engineering Research (ICMER 2011), 5-8 Dec 2011, Kuantan, Malaysia.
Hairuddin, AA, Yusaf, TF & Wandel, AP 2011, ‘Predicting the combustion behaviour of a diesel HCCI engine using a zero-dimensional single-zone model’, in the Australian Combustion Symposium 2011 (ACS 2011), 29 Nov-1 Dec 2011, Newcastle, Australia.
2010
TABLE OF CONTENTS
Dedication ... iii
Abstract ... iv
Certification of Dissertation ... vi
Acknowledgements ... vii
List of Publications and Presentations ... viii
Table of Contents ... x
List of Figures ... xvii
List of Tables ... xxvii
Chapter 1 ... 1
Introduction ... 1
1.1 Background ... 1
1.2 Introduction ... 3
1.3 Research Focus ... 5
1.4 Objectives ... 8
1.5 Thesis Outline ... 9
Chapter 2 ... 11
Literature Review ... 11
2.1 Introduction ... 11
2.2 Performance Comparison ... 11
2.2.1 State of the Art Current Internal Combustion Engines ... 11
2.2.2 Fuels Used in HCCI Engines ... 13
2.2.3 Natural Gas and Hydrogen with Diesel Operating Conditions ... 16
2.2.4 Gasoline Operated HCCI Engines ... 18
2.2.5 Peak Pressure and Temperature ... 19
2.2.6 Brake Thermal Efficiency ... 20
2.2.7 Brake Mean Effective Pressure ... 21
2.2.8 Exhaust Gas Emissions ... 23
2.2.9 Knocking ... 25
2.3 Injection Methods for Homogeneous Mixtures ... 26
2.3.3 Late Injection ... 29
2.4 Ignition Control in HCCI Engines ... 30
2.4.1 Pre-Heat Intake Air ... 31
2.4.2 Pressurized Intake Air ... 32
2.4.3 Hydrogen Addition ... 32
2.4.4 Exhaust Gas Recirculation (EGR) ... 35
2.4.5 Addition of Dimethyl Ether (DME) ... 36
2.4.6 Charge Stratification ... 36
2.5 Numerical Study of HCCI Engines ... 37
2.5.1 Chemical Kinetics ... 37
2.5.2 Numerical and CFD Environments ... 45
2.5.3 Single-Zone and Multi-Zone Models ... 46
2.5.4 Multi-Dimensional Models: CFD ... 48
2.5.5 Effect of Operating Parameters on Ignition Delay Time ... 49
2.5.6 Heat Transfer Model ... 53
2.5.7 Turbulence Models: RANS vs. LES ... 54
2.5.8 Mixing Models for Non-premixed Combustion ... 57
2.6 Conditional Moment Closure (CMC) Model in HCCI Engines ... 62
2.6.1 CMC Modelling in Zero-Dimensional Simulations ... 63
2.6.2 CMC Modelling in Multi-Dimensional Simulations ... 64
2.7 Conclusion ... 65
Chapter 3 ... 67
Turbulence Modelling background ... 67
3.1 Introduction ... 67
3.2 Conservation Equations ... 68
3.2.1 Mass ... 68
3.2.2 Momentum ... 68
3.2.3 Species ... 69
3.2.4 Energy ... 69
3.3 Chemical Reactions ... 70
3.4 PDF and Statistical Descriptions ... 72
3.5 Turbulence Modelling ... 73
3.5.1.1 Reynolds Averaging ... 75
3.5.1.2 Favre Averaging ... 75
3.5.2 Turbulence Models ... 77
3.5.2.1 Zero-equation models ... 77
3.5.2.2 One-equation models ... 78
3.5.2.3 Two-equation models ... 79
3.5.3 Turbulent Reacting Flows ... 79
3.5.3.1 Dissipation and Scalar Transport ... 79
3.5.3.2 Mixture Fraction ... 80
3.5.4 Turbulent Combustion Models ... 81
3.5.4.1 Eddy Break-Up ... 81
3.5.4.2 Flamelet Models ... 82
3.5.4.3 Presumed PDF Methods ... 84
3.6 Conclusion ... 85
Chapter 4 ... 87
Numerical Models ... 87
4.1 Introduction ... 87
4.2 Single-Zone Model ... 88
4.2.1 Zero-Dimensional Modelling ... 88
4.2.1.1 Engine Parameters ... 88
4.2.1.2 Valve Geometry ... 92
4.2.1.3 Conservation of Mass ... 96
4.2.1.4 Conservation of Species ... 96
4.2.1.5 Conservation of Energy ... 96
4.2.1.6 Heat Loss Model in Zero-Dimensional Model ... 98
4.2.2 Quasi-Dimensional Modelling ... 98
4.2.2.1 Turbulence Models ... 99
4.2.2.2 Heat Loss Model in Quasi-Dimensional Model ... 100
4.3 Mixing Model: Conditional Moment Closure ... 101
4.3.1 Conditional Transport Equations ... 101
4.3.1.1 Conditional Mass Fraction ... 102
4.3.1.2 Conditional Enthalpy Equation ... 107
4.3.2.1 Conditional Scalar Dissipation ... 108
4.3.2.2 Presumed PDF ... 109
4.3.2.3 Chemical Source Term ... 112
4.3.2.4 Other sub-models ... 112
4.4 Implementation of CMC in Zero-Dimensional Model ... 114
4.4.1 Interfacing the Zero-Dimensional and CMC Codes ... 114
4.4.2 Numerical Solutions ... 116
4.4.2.1 Zero-Dimensional Solution ... 116
4.4.2.2 CMC Solution ... 119
4.4.2.3 Chemical Kinetics Mechanism: Cantera ... 122
4.4.3 Boundary Conditions ... 123
4.5 Conclusion ... 124
Chapter 5 ... 127
Validation of CMC Models ... 127
5.1 Introduction ... 127
5.1.1 Chemical Reactions Mechanism for n-Heptane ... 128
5.1.2 Chemical Reactions Mechanism for Gasoline ... 128
Part 1: Diesel HCCI ... 130
5.2 Experimental Data ... 130
5.3 Zero-Dimensional Single-Zone Model... 130
5.3.1 Validation ... 131
5.3.2 Heat Transfer Coefficient Models ... 132
5.3.2.1 Heat Fluxes ... 135
5.3.2.2 Heat Transfer Behaviour of Different AFR ... 137
5.4 CMC with Zero-Dimensional Model ... 139
5.4.1 Boundary and Initial Conditions ... 139
5.4.2 Comparison with Experiment ... 140
5.4.3 Turbulence Interactions ... 142
5.4.4 CMC Characteristics ... 144
5.4.4.1 Independence Test: Effects of Different 𝑪𝑫 ... 144
5.4.4.2 Grid Independence Test: Number of Bins of the CMC Model .. 147
5.4.4.3 Scalar Dissipation Rate ... 149
5.4.4.5 Conditional Temperature ... 164
5.5 Behaviour of CMC and Zero-D ... 167
5.5.1 Effect of Intake Temperature ... 167
5.5.2 Effect of Air-to-Fuel Ratio (AFR) ... 171
Part 2: Gasoline HCCI ... 173
5.6 Experimental Data ... 173
5.7 CMC with Zero-Dimensional Model Validation ... 173
5.7.1 Independence Test ... 175
5.7.2 Chemical Reactions ... 178
5.7.3 Conditional Temperature ... 182
5.8 Conclusion ... 183
Chapter 6 ... 185
Experimental Methodology ... 185
6.1 Introduction ... 185
6.2 Experimental Apparatus ... 187
6.2.1 Engine Test Bed ... 187
6.2.2 Dynamometer ... 190
6.2.3 Instrumentations ... 191
6.2.3.1 Thermocouples and Pressure Sensors ... 191
6.2.3.2 Rotary Encoder ... 193
6.2.3.3 Lambda Sensor ... 193
6.2.3.4 Airflow Meter ... 193
6.2.3.5 Exhaust Gas Analyser ... 194
6.2.4 Fuel Measurement ... 194
6.3 Modification to an HCCI Engine ... 195
6.3.1 Air Intake Heater ... 196
6.4 Electronic Control Unit (ECU) ... 201
6.4.1 ECU Program ... 202
6.5 Experimental Techniques ... 207
6.6 Conclusion ... 209
Chapter 7 ... 211
Experimental Performance Study of a Gasoline HCCI Engine ... 211
7.2 Power Curve Comparison of SI Engine with Manufacturer Data ... 211
7.3 Experimental Conditions ... 213
7.4 Engine Performance Comparison ... 214
7.4.1 In-Cylinder Pressure ... 214
7.4.2 Engine Power ... 218
7.4.3 Fuel Consumption ... 220
7.4.4 Engine Efficiency ... 223
7.4.5 Emissions Levels ... 224
7.4.5.1 NOx ... 225
7.4.5.2 Unburned HC ... 228
7.4.5.3 CO and CO2 ... 229
7.5 Conclusion ... 231
Chapter 8 ... 233
CMC in a Zero-Dimensional Single-Zone Model of a Gasoline HCCI Engine ... 233
8.1 Introduction ... 233
8.2 Comparison with Experiment ... 233
8.2.1 Boundary and Initial Conditions ... 233
8.2.2 Validation ... 234
8.3 CMC Characteristics ... 236
8.3.1 Independence Test: Constant 𝑪𝑫 ... 236
8.3.2 Independence Test: Number of Bins of the CMC Model ... 240
8.3.3 Conditional Mass Fractions ... 242
8.3.4 Conditional Temperature ... 246
8.4 Parametric Study ... 247
8.4.1 Intake Temperature ... 247
8.4.2 Compression Ratio (CR) ... 250
8.5 Conclusion ... 252
Chapter 9 ... 253
Conclusion ... 253
9.1 Summary and Future Work ... 253
LIST OF FIGURES
Figure 1.1 Simulated earth surface air temperature increase by the year 2060 (Rob 2005). ... 2 Figure 1.2 The differences between SI, CI and HCCI engines, reproduced from William and Charles (2011). ... 4 Figure 1.3 Concentration of radicals H, OH, H2O2 and HO2 for a pressure of 0.2 MPa
Figure 2.10 Summary of ignition burn rate and delay time for different type of fuels (Tanaka et al. 2003). ... 39 Figure 2.11 General layout of the quasi-dimensional simulation showing the interacting adiabatic core, thermal boundary layer and crevice regions, reproduced from (Fiveland & Assanis 2002). ... 46 Figure 2.12 Multi-zone model geometric configuration difference (a) HCCI engine, reproduced from (Komninos, Hountalas & Kouremenos 2004) (b) SI engines, reproduced from (Liu & Chen 2009). ... 47 Figure 2.13 Effects of various turbulence models in in-cylinder pressure trace compared with experiment in the single-zone zero-dimensional model (Agarwal et al.
1998). ... 48 Figure 2.14 The effect of initial temperature on ignition delay time for different fuels (Tanaka, Ayala & Keck 2003). ... 50 Figure 2.15 The effect of equivalence ratio on the ignition delay and burn rate for n -heptane, iso-octane and primary reference fuel (PRF) (Tanaka, Ayala & Keck 2003). ... 51 Figure 2.16 The effect of different pressure on the auto-ignition delay time for a stoichiometric mixture of n-heptane/air (Puduppakkam et al. 2010). ... 51 Figure 2.17 Effect of EGR on ignition delay for n-heptane fuel (Taylor 2006). ... 52 Figure 2.18 Ignition timing stability captured over time-lapse (Olsson et al. 2002). 53 Figure 2.19 Heat transfer model comparison with experiment, (a) heat transfer coefficient, (b) in-cylinder temperature difference, reproduced from (Soyhan et al.
Figure 2.24 Result for in-cylinder pressure at 1000 rpm between simulation and
experiment, as reported by Kwon et al. (2011). ... 63
Figure 2.25 In-cylinder pressure comparison between CMC model using CFD and experiment, reproduced from (De Paola et al. 2008). ... 64
Figure 3.1 Turbulent kinetic energy spectrum as a function of the wavenumber, reproduced from (Peters 2000). ... 74
Figure 4.1 Engine geometry of the piston and crank mechanisms. ... 89
Figure 4.2 Instantaneous piston speed: zero at TDC and BDC, maximum at the middle of the stroke. ... 91
Figure 4.3 Valve geometry for most engines with parameters defining the valve.... 92
Figure 4.4 Valve lift profile for typical poppet valves with mechanical lifters. ... 94
Figure 4.5 Discharge coefficient for one valve event ... 95
Figure 4.6 Coupling between CMC and zero-dimensional single-zone model. ... 115
Figure 4.7 A flow chart for zero-dimensional single-zone model simulation ... 118
Figure 4.8 The fundamental difference between EFDM and IFDM (Chapra & Canale 2006). ... 121
Figure 4.9 Bin configuration of the CMC model ... 123
Figure 5.1 A validation for reduced gasoline mechanism used in this study (Golovitchev 2003). LLNL prf is a detailed gasoline mechanism from Lawrence Livermore National Laboratory. CTH is a reduced gasoline mechanism from Chalmers University of Technology. ... 129
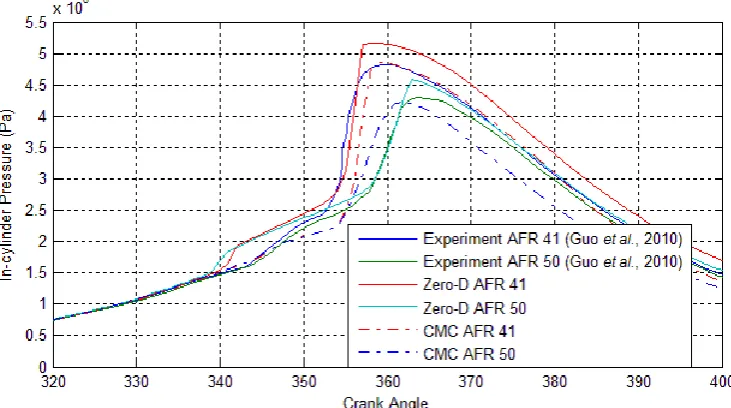
Figure 5.2 Comparison between zero-dimensional model (with modified Woschni heat transfer coefficient model) with experimental data and another single-zone model (Guo et al. 2010). CR=10.0, N=900 rpm, Tin=40°C, Pin=95 kPa, AFR=50. ... 132
Figure 5.3 Combustion phasing for different heat transfer coefficient models showing high temperature region (HTR) and low temperature region (LTR). In-cylinder pressure on the left and temperature on the right for different heat transfer coefficient models. ... 134
Figure 5.4 Heat release rate (left) and heat transfer coefficient (right) comparison among Woschni, modified Woschni and Hohenberg models. ... 135
Figure 5.5 Comparison of heat transfer coefficient with same scaling factor. ... 136
Figure 5.7 In-cylinder pressure comparison with different AFRs and different heat transfer coefficient models, CR=10.0, N=900 rpm, Tin=40°C, Pin=95 kPa. ... 138
Figure 5.8 Heat release rate comparison with varying AFRs and different heat transfer coefficient models, CR=10.0, N=900 rpm, Tin=40°C, Pin=95 kPa. ... 138
Figure 5.9 Initial condition of the air-fuel mixture in the intake manifold. ... 140 Figure 5.10 Comparison of the in-cylinder pressure between experiment (Guo et al.
2010), zero-dimensional model from Guo et al. (2010), zero-dimensional model without CMC and CMC with zero-dimensional model. ... 141 Figure 5.11 Zero-dimensional CMC and a multi-dimensional simulation (STAR EBU) compared with experiment (Wright 2005) ... 141 Figure 5.12 Combustion behaviours when the intake temperature was changed for both models. ... 142 Figure 5.13 Intake mass flow rate and piston speed pattern for the simulated engine. CR=10.0, N=900 rpm, Tin=40°C, Pin=95 kPa, AFR=50 ... 143
Figure 5.14 The difference in mean kinetic energy, turbulent kinetic energy and turbulent dissipation rate across the crank angle cycle. ... 144 Figure 5.15 In-cylinder pressure comparison between experiment and CMC model with varying 𝐶𝐷. ... 145 Figure 5.16 Effects of varying 𝐶𝐷 on the mean SDR (left) and mixture fraction variance (right). ... 146 Figure 5.17 Oxidiser and fuel behaviour for the entire simulation with varying 𝐶𝐷
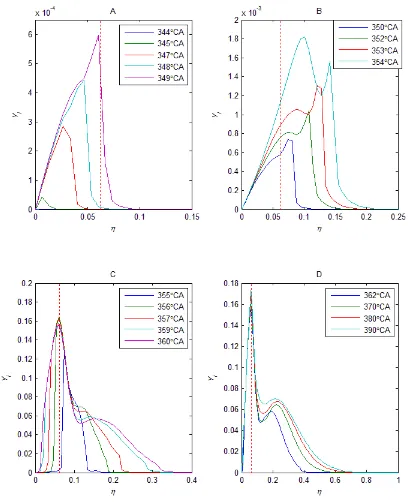
Figure 5.23 Mean mass fractions behaviour during combustion event compared with in-cylinder temperature trace, A: C7H16 and O2, B: OH and H2O2 C: H and HO2, D:
CO and CO2. ... 155
Figure 5.24 PDF of mixture fraction during the combustion event. ... 158 Figure 5.25 Conditional mass fraction of n-heptane (C7H16) during combustion with
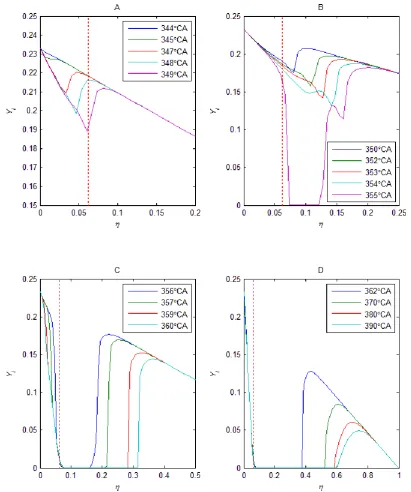
varying CA. The x-axis range is slowly increased from image A-D because the ignition started at the lean side before propagating to the rich side of the mixture fraction space. The dotted red line shows the location of the stoichiometric mixture fraction. ... 159 Figure 5.26 Conditional mass fraction of oxygen (O2) during combustion with varying
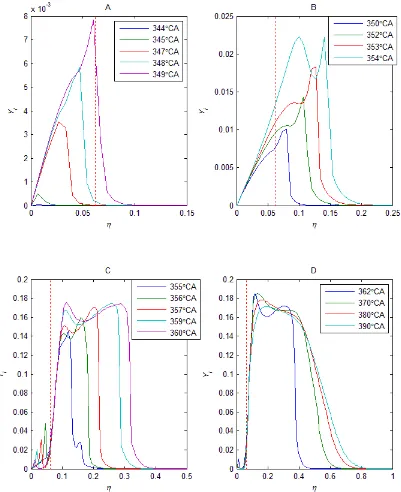
CA. The x-axis range is slowly increased from image A-D because the ignition started at the lean side before propagating to the rich side of the mixture fraction space. The dotted red line shows the location of the stoichiometric mixture fraction. ... 160 Figure 5.27 Conditional mass fraction of hydroxyl (OH) radical during combustion with varying CA. The dotted red line shows the location of the stoichiometric mixture fraction. ... 161 Figure 5.28 Conditional mass fraction of hydrogen peroxide (H2O2) during
combustion with varying CA. The x-axis range is slowly increased from image A-D because the ignition started at the lean side before propagating to the rich side of the mixture fraction space. The dotted red line shows the location of the stoichiometric mixture fraction. ... 162 Figure 5.29 Conditional mass fraction of carbon monoxide (CO) during combustion with varying CA. The x-axis range is slowly increased from image A-D because the ignition started at the lean side before propagating to the rich side of the mixture fraction space. The dotted red line shows the location of the stoichiometric mixture fraction. ... 163 Figure 5.30 Conditional mass fraction of carbon dioxide (CO2) during combustion
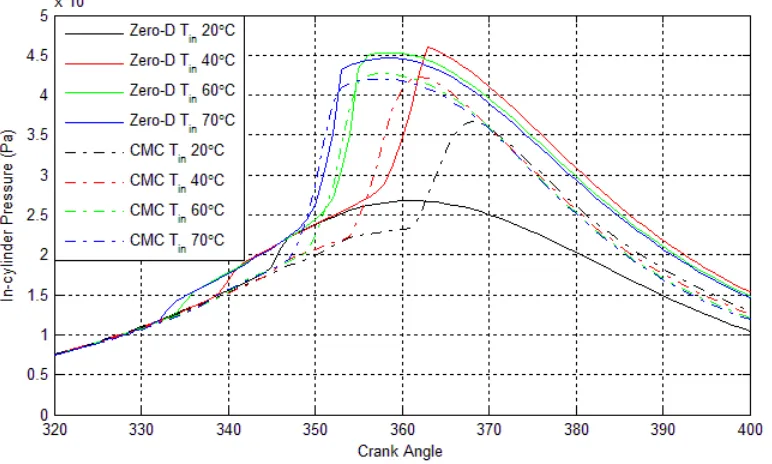
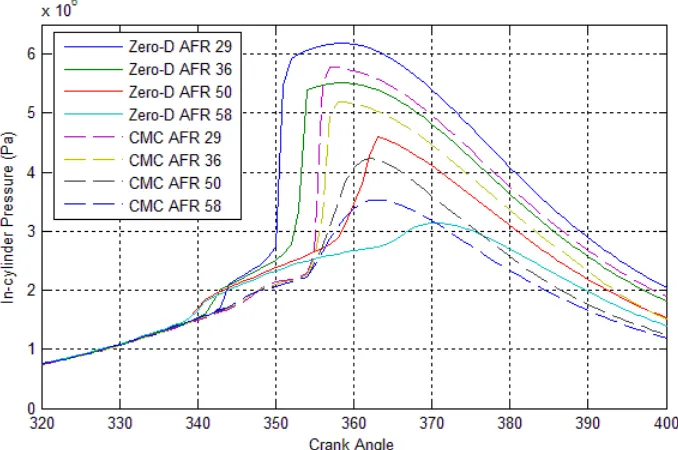
Figure 5.32 A comparison between experiment, zero-dimensional model and CMC model with various intake air temperatures. ... 168 Figure 5.33 The effect of different intake air temperatures on in-cylinder pressure trace between zero-dimensional and CMC models. ... 168 Figure 5.34 Effect of varying intake air temperature on ignition timing and start of combustion (SOC) temperature for CMC and zero-dimensional models. ... 170 Figure 5.35 In-cylinder peak pressure comparison between CMC and zero-dimensional models with varying intake air temperature. ... 170 Figure 5.36 A comparison between experiment, zero-dimensional and CMC models with various AFR. ... 171 Figure 5.37 The effect of different AFR on in-cylinder pressure trace between zero-dimensional and CMC models, where the stoichiometric AFR for n-heptane is 15.1. ... 172 Figure 5.38 In-cylinder peak pressure comparison between CMC and zero-dimensional models with varying AFR. ... 172 Figure 5.39 In-cylinder pressure comparison between the experiment (Puduppakkam
et al. 2009), the CMC and zero-dimensional models, where the zero-dimensional model was tested with different intake temperatures. ... 174 Figure 5.40 A comparison between the CMC model and the experiment, where the CMC model varies with 100 and 150 bins. ... 176 Figure 5.41 A comparison of constant of 𝐶𝐷 used in the gasoline study and compared with the experiment. ... 177 Figure 5.42 Global mean SDR (left) and variance (right) comparison over the entire simulation with varying 𝐶𝐷. ... 177 Figure 5.43 Oxidisers and fuels behaviour for the entire simulation with varying 𝐶𝐷. ... 178 Figure 5.44 Mean mass fraction for the entire simulation for fuels (C7H16, C8H18,
C7H8) and oxidisers (N2, O2) ... 179
Figure 5.45 Mean mass fractions behaviour during the combustion event compared with in-cylinder temperature trace, A: C7H16, C8H18, C7H8 and O2, B: OH and H2O2 C:
H and HO2, D: CO and CO2. ... 181
Figure 7.1 The comparison of SI engine power and torque between manufacturer data and experiment. Manufacturer uses carburettor with short intake manifold while experiment uses long intake manifold with EFI. ... 212 Figure 7.2 Airflow module used in the air intake manifold of modern engines to implement the effect of short or long air intake (Proton 2013). ... 213 Figure 7.3 In-cylinder pressure comparison for SI mode in this study between no load (left) and full load (right). ... 215 Figure 7.4 In-cylinder pressure for HCCI engine when knocking occurred. Straight blue line is the TDC location at 360°CA with encoder having a 0.5°CA resolution. ... 216 Figure 7.5 In-cylinder pressure comparison between SI and HCCI engines. ... 217 Figure 7.6 In-cylinder pressure rate of change comparison between SI and HCCI engines. ... 218 Figure 7.7 Engine power comparison between SI and HCCI modes ... 219 Figure 7.8 FC comparison between SI and HCCI engines, where the FC for the HCCI engine was recorded over a range of intake air temperatures and uses the minimum and maximum. ... 221 Figure 7.9 BSFC for the HCCI engine over a range of intake air temperatures ... 222 Figure 7.10 BSFC comparison between SI and HCCI engines with the HCCI engine using the minimum and maximum values over a range of intake air temperatures . 222 Figure 7.11 HCCI engine efficiency for a range of intake air temperatures. ... 224 Figure 7.12 Engine efficiency comparison between SI and HCCI engines, where the HCCI engine has a minimum and maximum range for a set of air intake temperatures. ... 224 Figure 7.13 Emissions levels of HC and NOx (above) and CO2 and CO (below) for
HCCI engines for a range of intake air temperatures. ... 225 Figure 7.14 NOx comparison between SI and HCCI modes, where HCCI mode has a
minimum and maximum range for different intake air temperatures. ... 227 Figure 7.15 Unburned HC comparison between SI and HCCI modes, where HCCI mode has a minimum and maximum range for different intake air temperatures. .. 229 Figure 7.16 CO2 and CO comparison between SI and HCCI modes, where HCCI mode
Figure 8.2 In-cylinder pressure comparison between CMC and zero-dimensional models. Tin = 250°C, CR= 9, AFR=16, N=1500rpm. ... 235
Figure 8.3 In-cylinder pressure comparison between experiment and CMC model with varying 𝐶𝐷. Tin = 250°C, CR= 9, AFR=16, N=1500rpm. ... 236
Figure 8.4 Oxidisers (O2 and N2) and fuels (C7H16, C8H18 and C7H8) behaviour for the
entire simulation for 𝐶𝐷 = 1.5 and 𝐶𝐷 = 1.0. Tin = 250°C, CR= 9, AFR=16,
N=1500rpm. ... 237 Figure 8.5 Oxidisers (O2 and N2) and fuels (C7H16, C8H18 and C7H8) behaviour for the
entire simulation for 𝐶𝐷 = 2.5 and 𝐶𝐷 = 2.0. Tin = 250°C, CR= 9, AFR=16,
N=1500rpm. ... 238 Figure 8.6 The effect of different 𝐶𝐷 values on mean scalar dissipation rate (A) and variance (B) for the entire simulation. ... 239 Figure 8.7 Turbulent quantities (𝑘 and 𝜀) behaviour when 𝐶𝐷 varies. Images B and D are enlarged at the peak of images A and C. ... 240 Figure 8.8 In-cylinder pressure comparison between experiment and CMC model with varying number of bins. Tin = 250°C, CR= 9, AFR=16, N=1500rpm. ... 241
Figure 8.9 In-cylinder peak pressure comparison for different number of bins of the CMC model. ... 241 Figure 8.10 Mean mass fractions behaviour during combustion event compared with in-cylinder temperature trace for Honda engine, A: C7H16, C8H18, C7H8 and O2, B: OH
and H2O2 C: H and HO2, D: CO and CO2. ... 243
Figure 8.11 Conditional mass fraction comparison for different CA location during combustion for species O2, C7H16, C8H18 and C7H8. The dotted red line shows the
location of the stoichiometric mixture fraction. ... 244 Figure 8.12 Conditional mass fraction comparison for different CA location during combustion for species H2O2, OH, CO and CO2. The dotted red line shows the location
LIST OF TABLES
Table 1.1 Comparison of newly developed engine technology (Chan 2002) ... 3 Table 1.2 Comparison of simulation types ranging from zero-dimensional to multi-dimensional (Wang, G. et al. 2006) ... 8 Table 2.1 The Difference in Natural Gas Composition between Some Countries (Chemical safety data sheet 2011; Jonathan 2006; Kong & Reitz 2002; Olsson et al.
Chapter 1
INTRODUCTION
1.1
Background
The greenhouse effect is a worldwide issue as more and more greenhouse gases are released into the atmosphere, leading to global climate change. The effects include an increase in temperature, unstable weather and an increase in ocean levels, resulting in ice melting in the North and South Poles (Bates et al. 2008; Graham, Turner & Dale 1990; Houghton et al. 2001). This has become a global issue with the members of the Copenhagen Climate Conference in December 2009 (Bodansky 2010) unable to reach an agreement on climate change.
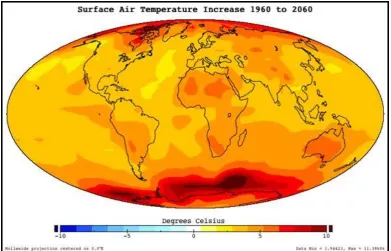
The increase of the earth’s surface air temperature due to global warming has been simulated by Rob (2005) from NASA (see Figure 1.1), showing an increase in surface air temperature from 1960 to 2060. According to the report of the World Resources Institute (Jonathan 2006), transportation accounted for about 14% of the global greenhouse gases in 2000, making it a major contributor to global climate change and equivalent to 18% of global CO2 emissions. Thus, it is imperative to minimise the
Figure 1.1 Simulated earth surface air temperature increase by the year 2060 (Rob 2005).
To counter this issue, many automotive manufacturers are developing electric, fuel-cell or hybrid engines. An electric vehicle is driven by an electric motor, with the energy supplied by a high capacity battery stored in the car boot or under the car body. The operation of the fuel-cell engine is similar to the electric vehicle in that it uses an electric motor to drive the wheels. However, the difference is the electricity generation method. Most fuel-cell driven vehicles use hydrogen and oxygen to generate electricity (Ogden, Steinbugler & Kreutz 1999; Trimm & Onsan 2001). This electric energy is stored in a high capacity battery and is used to drive the electric motor. A hybrid vehicle uses a combination of the conventional internal combustion (IC) engine and an electric motor. The IC engine could be a Spark Ignition (SI) or Compression Ignition (CI) engine, which is connected to the electric motor either in parallel or in series to drive the wheels. A high capacity battery is again used to power the electric motor. Therefore, it can be summarised that the vehicle is driven by two or more power sources in hybrid configurations.
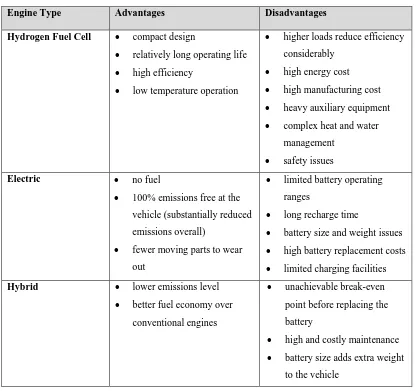
Table 1.1 Comparison of newly developed engine technology (Chan 2002)
Engine Type Advantages Disadvantages Hydrogen Fuel Cell compact design
relatively long operating life
high efficiency
low temperature operation
higher loads reduce efficiency
considerably
high energy cost
high manufacturing cost
heavy auxiliary equipment
complex heat and water
management
safety issues
Electric no fuel
100% emissions free at the
vehicle (substantially reduced
emissions overall)
fewer moving parts to wear
out
limited battery operating
ranges
long recharge time
battery size and weight issues
high battery replacement costs
limited charging facilities
Hybrid lower emissions level
better fuel economy over
conventional engines
unachievable break-even
point before replacing the
battery
high and costly maintenance
battery size adds extra weight
to the vehicle
1.2
Introduction
engines have no spark plug or fuel injector and the combustion starts spontaneously in multiple locations. High engine efficiency can be achieved with low NOx and soot
emissions.
Figure 1.2 The differences between SI, CI and HCCI engines, reproduced from William and Charles (2011).
Since the mixture is lean and is fully controlled by chemical kinetics, there are new challenges in developing HCCI engines as it is difficult to control the auto-ignition of the mixture and the heat release rate at high load operation, achieve cold start, meet emission standards and control knock (Kong & Reitz 2003; Soylu 2005). The advantages of using HCCI technology in IC engines are:
1. High efficiency relative to SI engines - approaching the efficiency of CI engines due to the ability of these engines to use high compression ratio (CR) and fast combustion (Killingsworth et al. 2006; Mack, Aceves & Dibble 2009). The HCCI engine has also no throttling losses, which improves the engine efficiency as well (Aceves et al. 2001; Haraldsson et al. 2004);
2. The ability to operate on a wide range of fuels (Aceves & Flowers 2004; Christensen, Johansson & Einewall 1997; Mack, Aceves & Dibble 2009); and 3. Low emissions levels of NOx relative to SI and CI engines and low particulate
matter relative to CI engines (Nathan, Mallikarjuna & Ramesh 2010).
HCCI engines have promising advantages and once the disadvantages have been resolved, the engine can then be commercialised. Thus, it is important to study the engine performance before implementing methods that resolve the current issues. Simulation techniques can be implemented to reduce the time in investigating the HCCI engine performance. Therefore, a combination of simulation and experiment will be useful in investigating HCCI engines.
1.3
Research Focus
that the mixture was completely homogeneous and turbulent mixing has no effect on the combustion. High degrees of mixture inhomogeneity result in significant changes in ignition timing and emissions levels (Bhave et al. 2006; Bisetti et al. 2008). Thus, the effect of turbulence on HCCI combustion still requires investigation.
Bhave et al. (2006) found that a lower in-cylinder wall temperature results in higher CO and UHC emissions while a higher wall temperature leads to lower emissions of CO and UHC. They concluded that the incomplete oxidation is influenced by fluid-wall interactions and mostly located within piston ring crevices (Aceves et al. 2000; Kong & Reitz 2003).
Flowers et al. (2001) described the HCCI (fuelled with propane) ignition by H2O2
decomposition, which accumulates due to low-temperature reactions in the compression stroke. Once the in-cylinder temperature reaches 1050-1100 K, H2O2
decomposes rapidly into two OH radicals, forming a large pool of OH radicals, and these radicals will rapidly consume the fuel. Reduction in OH concentration in low temperature regions leads to incomplete combustion, which delays the high-temperature oxidation (Shudo & Yamada 2007). This process is shown in Figure 1.3, where the concentration of H2O2 decreases while the concentration of OH increases
rapidly during the combustion process.
Figure 1.3 Concentration of radicals H, OH, H2O2 and HO2 for a pressure of 0.2 MPa (Aceves et al. 2000).
may have an indirect effect of changing the temperature distribution (Aceves et al.
2004; Aceves et al. 2001). The small temperature differences could significantly affect the combustion behaviour (Cabra et al. 2002).
A zero-dimensional model assumes that the combustion chamber is homogeneous and the chemical kinetics mechanism can be used to study the combustion behaviour. However, the turbulence effect is not considered. To some extent, the zero-dimensional model can be modified to include the turbulence effect by using different heat loss models (Agarwal et al. 1998; Fiveland & Assanis 2002), but no interactions between turbulence and chemistry. Due to its homogeneity assumptions, the zero-dimensional single-zone model has limitations in short burn duration, high in-cylinder peak pressure and cannot use the actual intake air temperature (Guo et al. 2010; Morsy 2007). The assumption ignores the spatial variations in the chamber, which treats the heat loss proportional to the temperature difference between average charge temperature and a time-averaged wall temperature (Aceves et al. 1998). In practice, the boundary layer is at a lower temperature than the bulk gas near TDC, which causes the boundary layer to always burn last and extend the heat release rate duration. Due to this assumption, the burn duration of a single-zone model is shorter than the experiment.
To investigate the HCCI combustion behaviour with turbulence-chemistry effect, a Conditional Moment Closure (CMC) method will be used with a zero-dimensional model. Instead of using CMC with CFD, which is common in the literature (De Paola
Thus, a combination of CMC and zero-dimensional models would help in performing a detailed preliminary study. Currently the use of multi-dimensional models leads to high computation time and resources, as shown in Table 1.2, where CFD with detailed chemistry has the longest computation time. A zero-dimensional simulation would be an interim solution until the cost and time of running a multi-dimensional model is comparable with the current cost of the zero-dimensional model. Also, the implementation of CMC with a zero-dimensional model is relatively new in the literature. CMC accounts for the turbulence-chemistry mixing effects, while the zero-dimensional model simulates the engine by assuming that the mixture in the cylinder is homogeneous. By combining with the CMC approach, it is expected to overcome the zero-dimensional model disadvantages. The use of chemical kinetics mechanisms also helps in investigating the combustion behaviour of an HCCI engine.
Table 1.2 Comparison of simulation types ranging from zero-dimensional to multi-dimensional (Wang, G. et al.
2006)
1.4
Objectives
1. Investigate the combustion behaviour in an HCCI engine by using a combined CMC and zero-dimensional model, where the CMC model takes into consideration the turbulence-chemistry mixing effect.
2. Evaluate the performance of a gasoline HCCI engine experimentally and compared with an SI engine. The experiment is also used to validate the combined model.
1.5
Thesis Outline
The thesis consists of nine chapters. Chapter 2 contains the literature review, which discusses HCCI engines in general, and also covers the experimental and numerical parts of the study. The first three sections of the chapter discuss the experimental part of the study, which consists of the performance comparison, injection methods to achieve HCCI mode and the ignition control for HCCI engines. The last two sections before the Conclusion give a general overview of the numerical study.
Chapter 3 discusses the background of the turbulence modelling and all the equations involved in multi-dimensional modelling. The conservation equations are introduced first: mass, momentum, species and energy. Then the chemical reactions are discussed, followed by the discussion of the Probability Density Function (PDF) in addition to statistical descriptions. The turbulence modelling section before the Conclusion covers the averaging techniques, turbulence models, turbulent reacting flows and turbulent combustion models.
Chapter 4 introduces the methodology of combining the zero-dimensional and CMC models. The equations used in the zero-dimensional model are discussed in Section 2 of the chapter, followed by the CMC equations in the following sections. The technique to combine both models is discussed before the Conclusion.
are discussed in Section 1. The details of the experimental engine are discussed in Section 2. These are followed by the validation of the zero-dimensional model using diesel fuel and performance of the heat transfer models for HCCI engines. The validation and performance of the combined model for a diesel fuelled HCCI engine is discussed in Sections 4 and 5. Part 2 commences with the engine data used in the gasoline HCCI engine experiment. The validation and model behaviour is discussed in Section 7 before the chapter ends with the Conclusion.
Chapter 6 discusses the experimental methodology in this study, which describes how to convert a commercially available single-cylinder SI engine to an HCCI engine. The experimental apparatus is discussed in Section 2 of the chapter and followed by the modification technique using the intake air heater. The electronic control unit (ECU) used as part of the modification work is also discussed. The last sections before the Conclusion discuss the experimental techniques needed in order to run the engine in HCCI mode.
Chapter 7 will then discuss the experimental performance of the HCCI engine. The HCCI engine is directly compared with an SI engine using the same engine operating conditions at the same engine power. The engine performance comparison covers the in-cylinder pressure, engine power, fuel consumption, engine efficiency and emissions levels. The chapter then closes with the Conclusion.
Chapter 8 will validate the combined model discussed in Chapter 4 against the experimental work in this thesis. The boundary condition and validation of the combined model is discussed in Section 2 of the chapter. Section 3 discusses the characteristic results from CMC. The parametric study (the effect of intake air temperature, air-to-fuel ratio and compression ratio) is discussed in Section 4.
Chapter 2
LITERATURE REVIEW
2.1
Introduction
The performance of an HCCI engine is strongly dependent on the fuel type, and this affects the emission levels as well. Since emission levels have become one of the factors driving engine technology today, HCCI development has moved to the next level. Due to the importance of HCCI technology, which potentially can replace conventional SI and CI engines, there is a need to report the recent developments in HCCI engines. This chapter discusses the current issues for this technology, where Section 2.2 contains the performance comparison of HCCI engines. Section 2.3 presents the methods to create homogeneous mixtures, with ignition control of HCCI engines in Section 2.4. Sections 2.5 and 2.6 will discuss relevant numerical studies of zero-dimensional modelling and the Conditional Moment Closure (CMC) model, concluding with section 2.7.
2.2
Performance Comparison
2.2.1 State of the Art Current Internal Combustion Engines
Producing homogeneous mixtures to achieve near-complete combustion is a common goal that will lead to the development of low polluting engines. Some technologies, including Fuel-Stratified Injection (FSI), Turbo-Stratified Injection (TSI) and HCCI, are used to improve the combustion efficiency.
Bentley and Scania (Volkswagen 2009). FSI uses directly injected fuel with a high injection pressure, where the evaporating fuel has a significant cooling effect on the cylinder charge (Audi 2012). This effect helps in reducing knocking and therefore a higher compression ratio can be used. The air enters the combustion chamber at a certain angle by using a moveable flap inside the intake manifold (Wurms, Grigo & Hatz 2003), while fuel is directly injected to the chamber, as shown in Figure 2.1. The fuel injector is located close to the intake valve in the cylinder head. With the help of the piston crown design, a tumbling effect is generated inside the chamber. This in turn will help the fuel mix with air homogeneously.
Figure 2.1 Movable flap is used inside the intake manifold (left) to generate tumble effects (right) in the combustion chamber with specially designed piston crown (Wurms, Grigo & Hatz 2003)
TSI engines, on the other hand, use a high intake pressure (using multipoint injectors) on an FSI engine (Böhme et al. 2006). The pressurised intake air will assist the combustion and therefore produce better efficiency, allowing smaller engines to be built with power and torque similar to that of bigger engines. The first engine to use direct injection technology to stratified charge engine was the Texaco combustion process (Barber, Reynolds & Tierney 1955), as reported by Takagi (1998).
cut fuel consumption by 15% (Premier 2007). The engine is able to reduce the emissions levels and lower throttling losses, which improves fuel economy.
2.2.2 Fuels Used in HCCI Engines
HCCI engines can operate using any fuel as long as the fuel can be vaporized and mixed with the air before ignition (Aceves & Flowers 2004). Since HCCI engines are fully controlled by chemical kinetics, it is important to evaluate the fuel’s auto-ignition point to produce smooth engine operation: no knocking or misfiring. Different fuels will have different auto-ignition points. Figure 2.2 shows the intake temperature required for different fuels to auto-ignite at different compression ratios when operating in HCCI mode (Aceves & Flowers 2004). It can be seen that methane requires the highest intake temperature and highest compression ratio to auto-ignite compared to other fuels. Thus, a fuel requiring a high intake temperature to auto-ignite is less reactive. This is also reported by Sjorberg and Dec (2008) that a low-reactivity fuel requires a high intake temperature and compression ratio to auto-ignite.
Figure 2.2 Intake temperature required for fuels to operate under HCCI mode with varying compression ratios, reproduced from (Aceves & Flowers 2004).
for a long time (Cho & He 2007). Natural gas is able to operate as a single fuel in an SI engine with low HC and CO emissions. However, it produces less power output in HCCI engines (Flowers et al. 2001; Rousseau, Lemoult & Tazerout 1999; Zeng et al.
2006). Its high auto-ignition point (about 810K) gives it a significant advantage over diesel-natural gas operation by maintaining the high CR of a diesel engine and lowering emissions at the same time (Duc & Wattanavichien 2007; Papagiannakis & Hountalas 2004; Saravanan & Nagarajan 2010). Duc and Wattanavichien (2007) claimed that the high octane number of methane (about 120) allows engines to operate at a high CR. Results from a four-stroke HCCI engine simulation have shown that methane did not ignite if the intake temperature was less than 400K with a CR of 15:1, as reported by Fiveland and Assanis (2000). This is supported by Figure 2.2, where methane will only auto-ignite with an intake temperature less than 400K when the CR is greater than 18:1.
Table 2.1 The Difference in Natural Gas Composition between Some Countries (Chemical safety data sheet 2011; Jonathan 2006; Kong & Reitz 2002; Olsson et al. 2002; Papagiannakis & Hountalas 2004; Ramli 2009).
Components % Volume
Australia Greece Sweden US Malaysia
Methane (CH4) 90.0 98.0 87.58 91.1 92.74
Ethane (C2H6) 4.0 0.6 6.54 4.7 4.07
Propane (C3H8) 1.7 0.2 3.12 1.7 0.77
Butane (C4H10) 0.4 0.2 1.04 1.4 0.14
Pentane (C5H12) 0.11 0.1 0.17 - -
Hexane (C6H14) 0.08 - 0.02 - -
Heptane (C7H16) 0.01 - - - -
Carbon Dioxide (CO2) 2.7 0.1 0.31 0.5 1.83
Nitrogen (N2) 1.0 0.8 1.22 0.6 0.45
and safety issues. CNG, on the other hand, has been successfully commercialized with 48% of global market share for on-road vehicles, but it has difficulties with high capital cost, existing refuelling infrastructure and competition from other alternative fuels (Johannes et al. June 2009).
The Indicated Mean Effective Pressure (IMEP) is a measure of the engine’s capacity to do work in each stroke, before considering all the losses. If IMEP is increased, it can reduce the intake temperature needed in an HCCI engine; increasing the CR has the same effect (Olsson et al. 2002). Antunes, Mikalsen and Roskilly (2008) have investigated the performance of an HCCI engine fuelled with hydrogen, and they found that the IMEP increases when the air intake temperature is decreased. Hydrogen requires a lower air intake temperature than natural gas for the same CR, as shown in Figure 2.2, due to hydrogen having a lower auto-ignition temperature. Therefore, it is important to control the intake temperature and the operating conditions of an HCCI engine to achieve an optimized combustion point. The methods to achieve this will be discussed in section 2.4.
Hydrogen can operate as a single fuel in an HCCI engine but it is often unstable and is prone to generating knocking (Szwaja & Grab-Rogalinski 2009). It has the highest diffusivity of any gas in air, about 3-8 times faster than that of natural gas, which leads to fast mixing (Saravanan & Nagarajan 2010) and the intake charge can be considered homogeneous when premixed with air (Szwaja & Grab-Rogalinski 2009). The net heating value for hydrogen is almost three times higher than diesel (119.93MJ/kg compared to 42.5MJ/kg) with a high self-ignition temperature to initiate combustion (858K) (Saravanan et al. 2008). Hydrogen cannot be used as a single fuel, because the HCCI engine operates in an unstable condition. Thus, most researchers use hydrogen as an additive: either to control the ignition timing or to increase the engine performance (Flowers et al. 2001; Park et al. 2010; Peucheret et al. 2005; Rattanapaibule & Aung 2005; Saravanan & Nagarajan 2010).
Iso-octane is used as a surrogate fuel for gasoline in HCCI engine experiments while
n-heptane is used for diesel (Komninos, Hountalas & Kouremenos 2004; Naik et al.
the alcohol-derived fuels like biofuels are still subject to worldwide investigations as they create engine durability problems such as injector cocking, piston ring sticking, severe engine deposits and fuel filter clogging (Bari, Lim & Yu 2002; Fazal, Haseeb & Masjuki 2011; Jayed et al. 2011). Even though biofuels have their own challenges, they have received increasing attention from researchers as a renewable energy source, as reported by Komninos and Rakopoulos (2012).
2.2.3 Natural Gas and Hydrogen with Diesel Operating
Conditions
The combination of natural gas or hydrogen with diesel was reported to yield low emissions and, to some extent, increase the engine efficiency, either in HCCI or CI combustion mode (de Risi et al. 2008; Saravanan, Nagarajan & Narayanasamy 2008; Saravanan et al. 2008; Verhelst & Wallner 2009). Diesel alone is not suitable for HCCI engines due to its low volatility and high propensity to auto-ignite, while natural gas has a high resistance to auto-ignition as reported by Kong (2007).
Combinations of high octane number fuels (such as natural gas and hydrogen) with high cetane number fuels (such as diesel) are able to increase the engine durability and, under certain operating conditions, reduce emissions such as soot, HC, CO and NOx
(Szwaja & Grab-Rogalinski 2009; Tomita 2004; Tomita et al. 2001; Tomita et al.
2002). It was also reported that these combinations (diesel and methane) have a high thermal efficiency under early injection timing (Tomita 2004; Tomita et al. 2002). Fuels with a higher octane number have better resistance to knocking while fuels with a higher cetane number have a shorter ignition delay time, thus providing more time for the fuel to complete the combustion. Therefore, a combination of both (high cetane number fuels and high octane number fuels) with proper blend ratio provides soft (without knocking) engine run (Szwaja & Grab-Rogalinski 2009), whereby the mixture can be operated at a high CR and has a longer combustion duration.
auto-ignition point in HCCI engines (Szwaja & Grab-Rogalinski 2009). Natural gas, on the other hand, has a higher auto-ignition temperature and it can be used in high CR engines (Akansu et al. 2004). Table 2.2 compares the physical and chemical properties of diesel with natural gas and hydrogen.
Table 2.2 Diesel Properties Compared to Hydrogen and Natural Gas (Liu & Karim 2008; Saravanan & Nagarajan 2010; Saravanan et al. 2008; Verhelst & Wallner 2009)
Properties Diesel Hydrogen Natural Gas
Main component C12H23 H2 Methane (CH4)
Auto-ignition temperature (K) 553 858 923
Lower heating value (MJ/kg) 42.5 119.93 50
Density (kg/m3) 833-881 0.08 0.862
Molecular weight (g/mol) 170 2.016 16.043
Flammability limits in air (vol%) (LFL–
UFL) 0.7-5 4-75 5-15
Flame velocity (m/s) 0.3 2.65-3.25 0.45
Specific gravity 0.83 0.091 0.55
Boiling point (K) 453-653 20.2 111.5
Cetane number 40-60 - -
Octane number 30 130 120
CO2 emissions (%) 13.4 0 9.5
Diffusivity in air (cm2/s) - 0.61 0.16
Min ignition energy (mJ) - 0.02 0.28
2.2.4 Gasoline Operated HCCI Engines
Gasoline could be operated in HCCI mode on its own. However, it would also be unstable in a high load operating range. High load difficulties are a common problem for HCCI engines regardless of the fuel being used. The solution for this issue for gasoline fuel is to operate the engine in HCCI mode in the medium load range, and switch to SI mode in the high load range (Yingnan et al. 2010). Wang et al. (2006) studied the gasoline HCCI engine with secondary injections and reported that the operating load range could be extended by using two-zone HCCI mode, which utilises secondary injections. However, the two-zone mode yields higher NOx emissions due
to the fuel-rich zone developed in the chamber.
Iso-octane is generally used as a gasoline surrogate fuel in numerical studies due to its high octane rating. Higher octane numbers cause difficulties in achieving the HCCI mode for low CR engines (Hosseini & Checkel 2009) due to higher ignition temperature. The intake temperature must be very high, if pre-heating is the only option to achieve HCCI. This would be difficult as this method requires a high power heater with a precise temperature controller. Thus the ignition has to be controlled using other means, which will be discussed in Section 2.4. The use of high octane number fuels such as gasoline in a low CR engine allows the engine to be switchable to SI mode in a high load range (Fuerhapter, Unger & Piock 2004). It has been found that a high CR engine (as high as 18:1) has the advantages of producing ultra-low NOx
emissions (1ppm) and higher thermal efficiency (43%) at a fixed operating condition (John & Magnus 2002).
Gasoline can also be mixed with diesel to operate in HCCI mode. A study by Kim and Lee (2006) on the effect of blended fuels on emissions showed that the combination of diesel and gasoline (diesel is direct injected while gasoline is port injected) is an effective way to reduce NOx levels, with the increase of the premixed ratio. The
a gasoline only HCCI engine. The purpose of blending gasoline and diesel is that gasoline has a high volatility and is easy to vaporise, thus can be used to form a homogeneous mixture. Gasoline also has a high octane number, where higher numbers show higher resistance to knocking. Diesel, on the other hand, has good ignitability and fast combustion due to its high cetane number. Table 2.3 compares the characteristics of the gasoline and diesel fuels, where for the selected gasoline (octane number 98) the heating values are almost identical between those fuels.
Table 2.3 Characteristics of gasoline and diesel fuels (Kim & Lee 2006)
Gasoline Diesel
Octane number 98 -
Cetane number - 54
Higher heating value (kJ/kg) 47,300 44,800
Lower heating value (kJ/kg) 44,000 42,500
Boiling point (K) 468 553
Density (kg/m3) 750 814
Stoichiometric air-fuel ratio 14.6 14.5
2.2.5 Peak Pressure and Temperature
The variations of heat release rate during combustion affect the in-cylinder peak pressure and temperature. All these quantities (heat release rate, temperature and pressure) depend on the speed of the engine, equivalence ratio, load, intake pressure, temperature and energy content of the fuel configurations. Higher loads and richer mixtures typically produce higher peak pressures. Table 2.4 shows how the in-cylinder peak pressure and temperature vary for HCCI and conventional CI modes. These are general data to illustrate which mode produces a higher in-cylinder peak pressure irrespective of the load produced by the engines. The data for maximum temperature is not fully reported but, in general, temperature increases with pressure. HCCI configurations generally produce a lower peak pressure than conventional CI modes for every fuel configuration, leading to significant impacts on emission levels: the impacts refer to whether the emission of a particular gas decreases or increases. As for HCCI engines with lower peak pressure, the emissions for NOx are generally
which are currently being investigated. The addition of hydrogen to diesel influences the peak pressure generation. The greater the amount of hydrogen added, the higher the peak pressure, and the addition of hydrogen is able to reduce ignition delay as well (Szwaja & Grab-Rogalinski 2009). It is shown that the hydrogen fuel configuration yields the highest peak pressure.
Table 2.4 In-Cylinder Peak Pressure and Temperature Comparison for Natural Gas and Hydrogen in Various Configurations (Amneus et al. 1998; Antunes, Mikalsen & Roskilly 2008, 2009; Garcia, Aguilar & Lencero 2009;
Nathan, Mallikarjuna & Ramesh 2010; Zheng, Zhang & Zhang 2005)
Mode Max Pressure (MPa) Max Temperature (K)
HCCI CI HCCI CI
H2 ~ 8 ~ 12 - -
NG ~ 7 ~ 7.5 ~ 1300 ~ 1850
Diesel ~ 6.1 ~ 6.6 - ~ 2300
NG +
Diesel ~ 3 ~ 5.5 ~ 1450 -
H2 +
Diesel ~ 7 ~ 7.8 - -
2.2.6 Brake Thermal Efficiency
Hydrogen, on the other hand, had a higher BTE than pure diesel in non-HCCI mode, increasing the BTE by 13-16% (Saravanan & Nagarajan 2010). Szwaja and Grab-Rogalinski (2009) reported that the BTE was increased from 30.3% to 32% with an addition of 5% hydrogen. The increase of BTE in hydrogen-diesel mode might be due to the uniformity of mixing of hydrogen with air (Saravanan et al. 2008). Hydrogen as a single fuel running in HCCI mode gives a BTE of up to 45% (Antunes, Mikalsen & Roskilly 2008), showing that hydrogen is able to operate with extremely lean mixtures and still maintain a relatively high efficiency compared to diesel engines. Table 2.5 shows that hydrogen in HCCI mode yields better results compared to the conventional mode (45% compared to 42.8%) and hydrogen with diesel in non-HCCI mode produces a higher efficiency than diesel alone (Antunes, Mikalsen & Roskilly 2009). It is expected that the combination of hydrogen and diesel in HCCI mode will produce a higher BTE than diesel in CI mode. This conclusion was reached with partially premixed charge compression ignition (PPCCI) configurations when reformed exhaust gas recirculation (REGR) was used with hydrogen-rich gas (no more than 24%) added to the intake manifold (Tsolakis & Megaritis 2005). PPCCI has the potential to reduce NOx and PM emissions like the HCCI engine does, and maintaining or improving the
engine efficiency.
Table 2.5 Maximum BTE for Hydrogen-Diesel Fuel Compared with Hydrogen HCCI, Direct Injection (DI) Diesel and Dual Fuel (Antunes, Mikalsen & Roskilly 2009; Tsolakis & Megaritis 2005)
Diesel DI Dual fuel (H2+diesel)
H2+Diesel
PPCCI
H2
HCCI H2 DI
BTE (%) 27.9 33.9 36.5 45.0 42.8
2.2.7 Brake Mean Effective Pressure
engine) operating in HCCI mode is only between 0-0.36MPa (Hyvonen, Haraldsson & Johansson 2003), which is lower than conventional SI engines.
Natural gas-diesel in HCCI mode operates in the BMEP range of 0.25-0.4MPa (Nathan, Mallikarjuna & Ramesh 2010), which is low compared with the engines in Table 2.6. To increase the BMEP, the concentration of natural gas has been increased but if its concentration compared to diesel is too high, this will lead to knocking (Nathan, Mallikarjuna & Ramesh 2010). Figure 2.3 shows that the best energy ratio for natural gas-diesel HCCI mode is about 51% and within the shaded region. For this optimized energy ratio, the maximum BMEP is only 0.4MPa, which is a very limited load range and is not suitable for high load engine operations.
Hydrogen with diesel in HCCI mode is stable up to 0.6MPa BMEP (Tsolakis & Megaritis 2005; Tsolakis, Megaritis & Yap 2008). If a supercharger is used in hydrogen-diesel dual-fuel mode on a non-HCCI engine, a maximum BMEP of 0.91MPa was reported (Roy et al. 2010). Thus, hydrogen and diesel in HCCI mode might be able to be used for high load engine operations.
Table 2.6 BMEP Range for Various Engines Types (Heywood 1988)
Engine Type Compression Ratio BMEP Range (MPa)
SI Engines
Small (Motorcycles) 6-11 0.4-1
Passenger cars 8-10 0.7-1
Trucks 7-9 0.65-0.7
Large gas engines 8-12 0.68-1.2
Diesel Engines
Passenger cars 17-23 0.5-0.75
Trucks 16-22 0.6-0.9
Large trucks 14-20 1.2-1.8
Locomotive 12-18 0.7-2.3
Marine engines 10-12 0.9-1.7
Figure 2.3 BMEP for different intake temperatures with varying energy ratio between natural gas and diesel. The shaded region shows the best energy ratio for natural gas-diesel HCCI engines, reproduced from (Nathan,
Mallikarjuna & Ramesh 2010).
2.2.8 Exhaust Gas Emissions
Emissions in HCCI engines consist of UHC, CO, NOx, soot and particulates. UHC and
CO emissions in HCCI engines are generally higher than conventional CI engines as reported by (Ganesh & Nagarajan 2010; Kong & Reitz 2003; Park & Reitz 2007). There are no exact numbers reported in this study because the value was inconsistent for all engines and across all engine loads. High emissions level of CO and UHC might be due to incomplete combustion caused by low combustion temperatures (Bression
The low combustion temperature will reduce the combustion efficiency as a result of the lower oxidation activity of the hydrocarbons and the lower conversion rate of CO to CO2 (Alkidas 2007). Results of simulations confirm that the piston-ring crevice
needs to be resolved in order to accurately predict UHC and CO emissions (Kong & Reitz 2003). UHC and CO emissions originate in the crevices and boundary layer, which are too cold for complete combustion (Aceves et al. 2001). Higher concentrations of hydrogen and natural gas in diesel engines have the ability to reduce UHC and CO emission levels, because the gaseous state of hydrogen and natural gas will reduce the wall wetting effect on the cylinder liner (He & Cho 2007).
However, the difference in NOx concentration between natural gas and hydrogen in
diesel HCCI mode could be due to different combustion temperatures, because hydrogen has a higher temperature and flame speed compared to natural gas and diesel (Soberanis & Fernandez 2010). A survey of research papers by Akansu et al. (2004) shows that the NOx level is increased when the hydrogen content in natural
gas-hydrogen mixtures is increased. It shows that the combustion temperature and the flame speed of hydrogen contribute to a higher level of NOx emissions.
In biogas-diesel HCCI engines, the NOx level was low when the biogas energy was
increased (Nathan, Mallikarjuna & Ramesh 2010). This might be due to a higher homogeneity level achieved between air and fuels. Van Blarigan (2002) in his study reported that the mixture must be homogeneous, lean or highly diluted in order to eliminate the production of NOx. Olsson et al. (2002) stated that the NOx level is low
in natural gas HCCI engines and when combined with Exhaust Gas Recirculation (EGR), it drops further (Yap et al. 2006). Even in natural gas-diesel non-HCCI mode, the NOx level is lower than in diesel conventional CI engines (Yusaf et al. 2010).
Hydrogen, on the other hand, produces zero UHC, CO and CO2, due to the absence of
carbon in the fuel, but still produces NOx (Verhelst & Wallner 2009). Hydrogen
operated as a single fuel in CI mode yielded lower NOx levels than diesel (Antunes,
Mikalsen & Roskilly 2009). Saravanan and Nagarajan (2010) in their study of hydrogen addition to diesel in non-HCCI mode showed that lower NOx emissions were
oxygen. Therefore, hydrogen-diesel in HCCI mode results in extremely low NOx
emissions levels with no significant amount of soot (Tsolakis, Megaritis & Yap 2008).
When the HCCI engine is operated with a gasoline fuel, the engine is reported to be unstable if the EGR is less than 40% or greater than 60% (Yingnan et al. 2010). This is also reported by Hosseini and Checkel (2009), where EGR is not suitable to be used for ignition control in a gasoline fuelled HCCI engine because EGR effects are different at different operating conditions.
2.2.9 Knocking
Knocking in SI engines is a phenomenon where the unburned mixture in the compressed gas ignites before it is reached by the propagating flame front (Stiesch 2003). Knock is physically detected when the engine vibrates excessively and a pinging sound can be heard outside as a result of the combustion activity. It causes loss of power and, if not controlled, knocking could lead to severe engine damage and shorten its life. Knocking can occur in any reciprocating engine. HCCI engines are prone to knock since they are controlled by chemical kinetics and there is no fixed mechanism to control knock in them. Knocking phenomena limit the load range of an HCCI engine: high load operations can easily initiate knock, so upper load limits have to be applied (Yap et al. 2006). In all engines, generally knocking occurs when the combustion starts before the piston reaches TDC, while misfire is when combustion commences after TDC. Knocking and misfire are two different behaviours which must be avoided in engine operation as both of them can contribute to deterioration of engine performance (Andreae et al. 2007; Jun, Ishii & Iida 2003; Kong & Reitz 2003; Nathan, Mallikarjuna & Ramesh 2010; Yelvington & Green 2003).
compression ratio of 17 by monitoring its in-cylinder pressure. It can be seen that the in-cylinder pressure suddenly increases to the peak before following the normal pressure trend: the peak pressure is higher than the normal in-cylinder peak pressure without knocking. The maximum increase in pressure for knocking is unpredictable and this abnormality usually occurs when there is an incorrect operating condition.
Figure 2.4 Knocking phenomena in a hydrogen HCCI engine for a single combustion event, reproduced from (Szwaja & Grab-Rogalinski 2009)
2.3
Injection Methods for Homogeneous Mixtures
Vaporized fuels are needed to initiate combustion in conventional CI engines. Therefore, a high fuel injection pressure is required. A higher injection pressure leads to better fuel vaporization and forms many small droplets of fuel leading to efficient fuel-air diffusion processes. Compression of air generates high