0022-538X/09/$08.00⫹0 doi:10.1128/JVI.00125-09
Copyright © 2009, American Society for Microbiology. All Rights Reserved.
Selective Expression of Human Immunodeficiency Virus Nef in Specific
Immune Cell Populations of Transgenic Mice Is Associated with
Distinct AIDS-Like Phenotypes
䌤
†
Zaher Hanna,
1,2,5* Elena Priceputu,
1Pavel Chrobak,
1Chunyan Hu,
1Ve
´ronique Dugas,
3Mathieu Goupil,
3Miriam Marquis,
3Louis de Repentigny,
3,4and Paul Jolicoeur
1,3,5*
Laboratory of Molecular Biology, Clinical Research Institute of Montreal, 110 Pine Avenue West, Montreal, Quebec H2W 1R7, Canada1;
Departments of Medicine2and Microbiology and Immunology,3University of Montreal, and Sainte-Justine Hospital,4Montreal,
Quebec H3C 3J7, Canada; and Division of Experimental Medicine, McGill University, Montreal,
Quebec H3G 1A4, Canada5
Received 19 January 2009/Accepted 2 July 2009
We previously reported that CD4C/human immunodeficiency virus (HIV)Neftransgenic (Tg) mice, express-ing Nef in CD4ⴙT cells and cells of the macrophage/dendritic cell (DC) lineage, develop a severe AIDS-like disease, characterized by depletion of CD4ⴙT cells, as well as lung, heart, and kidney diseases. In order to determine the contribution of distinct populations of hematopoietic cells to the development of this AIDS-like disease, five additional Tg strains expressing Nef through restricted cell-specific regulatory elements were generated. These Tg strains express Nef in CD4ⴙT cells, DCs, and macrophages (CD4E/HIVNef); in CD4ⴙT cells and DCs (mCD4/HIVNefand CD4F/HIVNef); in macrophages and DCs (CD68/HIVNef); or mainly in DCs (CD11c/HIVNef). None of these Tg strains developed significant lung and kidney diseases, suggesting the existence of as-yet-unidentified Nef-expressing cell subset(s) that are responsible for inducing organ disease in CD4C/HIVNef Tg mice. Mice from all five strains developed persistent oral carriage of Candida albicans, suggesting an impaired immune function. Only strains expressing Nef in CD4ⴙT cells showed CD4ⴙT-cell depletion, activation, and apoptosis. These results demonstrate that expression of Nef in CD4ⴙT cells is the primary determinant of their depletion. Therefore, the pattern of Nef expression in specific cell population(s) largely determines the nature of the resulting pathological changes.
The major cell targets and reservoirs for human immunode-ficiency virus type 1 (HIV-1)/simian immunodeimmunode-ficiency virus (SIV) infection in vivo are CD4⫹T lymphocytes and antigen-presenting cells (macrophages and dendritic cells [DC]) (21, 24, 51). The cell specificity of these viruses is largely dependent on the expression of CD4 and of its coreceptors, CCR5 and CXCR-4, at the cell surface (29, 66). Infection of these im-mune cells leads to the severe disease, AIDS, showing wide-spread manifestations, including progressive immunodefi-ciency, immune activation, CD4⫹ T-cell depletion, wasting, dementia, nephropathy, heart and lung diseases, and suscepti-bility to opportunistic pathogens, such asCandida albicans(1, 27, 31, 37, 41, 82, 93, 109). It is reasonable to assume that the various pathological changes in AIDS result from the expres-sion of one or many HIV-1/SIV proteins in these immune target cells. However, assigning the contribution of each in-fected cell subset to each phenotype has been remarkably difficult, despite evidence that AIDS T-cell phenotypes can present very differently depending on the strains of infecting
HIV-1 or SIV or on the cells targeted by the virus (4, 39, 49, 52, 72). For example, the T-cell-tropic X4 HIV strains have long been associated with late events and severe CD4⫹T-cell de-pletion (22, 85, 96). However, there are a number of target cell subsets expressing CD4 and CXCR-4, and identifying which one is responsible for this enhanced virulence has not been achieved in vivo. Similarly, the replication of SIV in specific regions of the thymus (cortical versus medullary areas), has been associated with very different outcomes but, unfortu-nately, the critical target cells of the viruses were not identified either in these studies (60, 80). The task is even more complex, because HIV-1 or SIV can infect several cell subsets within a single cell population. In the thymus, double (CD4⫺CD8⫺ )-negative (DN) or triple (CD3⫺CD4⫺CD8⫺)-negative (TN) T cells, as well as double-positive (CD4⫹CD8⫹) (DP) T cells, are infectible by HIV-1 in vitro (9, 28, 74, 84, 98, 99, 110) and in SCID-hu mice (2, 5, 91, 94). In peripheral organs, gut mem-ory CCR5⫹CD4⫹T cells are primarily infected with R5 SIV, SHIV, or HIV, while circulating CD4⫹T cells can be infected by X4 viruses (13, 42, 49, 69, 70, 100, 101, 104). Moreover, some detrimental effects on CD4⫹T cells have been postu-lated to originate from HIV-1/SIV gene expression in by-stander cells, such as macrophages or DC, suggesting that other infected target cells may contribute to the loss of CD4⫹ T cells (6, 7, 32, 36, 64, 90).
Similarly, the infected cell population(s) required and suffi-cient to induce the organ diseases associated with HIV-1/SIV expression (brain, heart, and kidney) have not yet all been identified. For lung or kidney disease, HIV-specific cytotoxic
* Corresponding author. Mailing address for P. Jolicoeur: Clinical Research Institute of Montreal, 110 Pine Avenue West, Montreal, Quebec H2W 1R7, Canada. Phone: (514) 5569. Fax: (514) 987-5794. E-mail: [email protected]. Mailing address for Z. Hanna: Clinical Research Institute of Montreal, 110 Pine Avenue West, Montreal, Quebec H2W 1R7, Canada. Phone: (514) 987-5571. Fax: (514) 987-5794. E-mail: [email protected].
† Supplemental material for this article may be found at http://jvi .asm.org/.
䌤Published ahead of print on 15 July 2009.
9743
on November 8, 2019 by guest
http://jvi.asm.org/
CD8⫹T cells (1, 75) or infected podocytes (50, 95), respec-tively, have been implicated. Activated macrophages have been postulated to play an important role in heart disease (108) and in AIDS dementia (35), although other target cells could be infected by macrophage-tropic viruses and may contribute sig-nificantly to the decrease of central nervous system functions (11, 86, 97), as previously pointed out (25).
Therefore, because of the widespread nature of HIV-1 in-fection and the difficulty in extrapolating tropism of HIV-1/ SIV in vitro to their cell targeting in vivo (8, 10, 71), alternative approaches are needed to establish the contribution of indi-vidual infected cell populations to the multiorgan phenotypes observed in AIDS. To this end, we developed a transgenic (Tg) mouse model of AIDS using a nonreplicating HIV-1 genome expressed through the regulatory sequences of the human CD4 gene (CD4C), in the same murine cells as those targeted by HIV-1 in humans, namely, in immature and mature CD4⫹T cells, as well as in cells of the macrophage/DC lineages (47, 48, 77; unpublished data). These CD4C/HIV Tg mice develop a multitude of pathologies closely mimicking those of AIDS pa-tients. These include a gradual destruction of the immune system, characterized among other things by thymic and lym-phoid organ atrophy, depletion of mature and immature CD4⫹ T lymphocytes, activation of CD4⫹and CD8⫹T cells, suscep-tibility to mucosal candidiasis, HIV-associated nephropathy, and pulmonary and cardiac complications (26, 43, 44, 57, 76, 77, 79, 106). We demonstrated that Nef is the major determi-nant of the HIV-1 pathogenicity in CD4C/HIV Tg mice (44). The similarities of the AIDS-like phenotypes of these Tg mice to those in human AIDS strongly suggest that such a Tg mouse approach can be used to investigate the contribution of distinct HIV-1-expressing cell populations to their development.
In the present study, we constructed and characterized five additional mouse Tg strains expressing Nef, through distinct regulatory elements, in cell populations more restricted than in CD4C/HIV Tg mice. The aim of this effort was to assess whether, and to what extent, the targeting of Nef in distinct immune cell populations affects disease development and pro-gression.
MATERIALS AND METHODS
Cloning and characterization of the mCD4, CD68, and CD11c regulatory
sequences.The cloning of the CD4E and CD4F regulatory elements has
previ-ously been described (47). For the isolation of the mCD4 promoter, we screened a mouse genomic library with a murine CD4 cDNA as a probe to isolate and
clone⬃50 kbp of the genomic mouse CD4 gene. This includes⬃26 kbp of DNA
upstream from 5⬘end of the coding region, containing the previously
character-ized promoter, silencer, and enhancer elements of the mCD4 gene (83, 88). The
mCD4 promoter was constructed by fusing the 5⬘11.5-kbp SalI-SacI fragment of
the mouse CD4 genomic sequences (containing exon 1, intron 1, part of exon 2 up to the SacI site) to the 1.9-kbp mouse CD4 enhancer, as we have done previously (48).
The human CD68 promoter was isolated from a bacterial artificial chromo-some clone (RP11-1867), essentially as described previously (38). The 2.9-kbp BstXI fragment upstream of the ATG initiation codon of the CD68 gene was first subcloned to destroy the ATG and ligated upstream of the 112-bp sequences
containing the first intron of the CD68 gene generated by PCR 5⬘primer 1212
(5⬘-TGATCTAGAGTCCCCTGGGCTTTTGGCAG-3⬘) and 3⬘ primer 1211
(5⬘-CCGGAATTCTGCTGGGGCTACTGGCAG-3⬘), as described previously (38).
The mouse CD11c promoter was prepared essentially as described previously (19). It was first isolated from a phage clone from a 129-mouse genomic library by hybridization with two genomic fragments used as probes, respectively,
de-rived from regions between exons 2 and 3 and exons 2 and 6. These genomic probes were PCR amplified from mouse genomic DNA by using the primers 839 (GCTGTCTCCAAGTTGCTCAGA) and 840 (GAACTCAGCACCGTCCAT GTG) and oligonucleotide 841 (GATGAACTCAGTAGAAAGCAGAG). A
4.8-kbp SacI-BspHI fragment containing the 5⬘upstream region of the CD11c
gene was excised from the identified phage clone and subcloned, and the ATG in exon 2 was mutated. The identity of this clone was confirmed by DNA sequencing.
Generation of Tg mice.The mCD4/HIVNef
, CD4E/HIVNef
, CD4F/HIVNef
,
CD68/HIVNef
, and CD11c/HIVNef
transgenes were constructed by ligating the five mCD4, CD4E, CD4F, CD68, and CD11c regulatory sequences, respectively, upstream to the 8.8-kbp BssHII-SacI MutG fragment of the HIV-1 pNL4-3 clone, followed by the simian virus 40 (SV40) polyadenylation signal fragment, as described previously (43, 44).
In this HIVMutG(now designated HIVNef) fragment, all of the open reading
frames of the HIV-1 genes, except for that of Nef, were interrupted. Therefore, the Tg sequences are able to express only the Nef protein. These transgene DNAs were excised from the pBR322 vector with AatII, purified, and
microin-jected into fertilized 1-day-old (C57BL/6⫻C3H)F2embryos to generate Tg
mice, as previously described (43, 44). Tg lines were established from each construct by breeding as heterozygote for the transgene with normal C3H/ HeNHsd mice obtained from Harlan (Madison, WI).
Transgene expression.The levels of transgene RNA expression were
deter-mined by Northern blot analysis on different tissues of Tg lines using32P-labled
HIV-1 probes as previously described (44). The32
P-labeled(44, 46) bands were detected with the PhosphorImager screen and scanned with the StormImaging unit (Amersham Biosciences). Semiquantitation of the RNA bands was esti-mated with the ImageQuant software (Amersham Bioscience). The ratio of HIV-specific 8.8-kb signal relative to the 18S ribosome-specific signal was ob-tained. In addition, transgene RNA expression was estimated by real-time quan-titative reverse transcription-PCR (RT-PCR), as described previously (78, 106). Tg Nef protein expression was assessed by Western blot analysis of lymphoid organs or purified cells from mice of different founder (F) lines, using rabbit anti-Nef antibody, as described previously (78, 103). Proteins were visualized by incubating the membranes with secondary anti-rabbit antibodies coupled to Alexa 680 fluorochrome, followed by scanning with Odyssey infrared imaging system (Licor). For semiquantitation of the protein bands, the membranes were stripped and reincubated with anti-actin antibodies. The actin-specific bands were visualized on the imaging system described above for the Nef-specific bands. The ratio of the Nef-specific signal relative to that of actin was obtained.
Histological analysis.Histological assessment on lymphoid and nonlymphoid
organs was carried out essentially as previously described (43, 44). Semiquanti-tative assessment of the histological phenotypes was done as previously described (45).
Flow cytometry and apoptosis analysis.LSR-1 and FACSCalibur flow
cytom-eters (BD Dickinson, San Jose, CA) were used for flow cytometry. Cell suspen-sions from lymphoid organs (thymuses, spleen, and lymph nodes [LN]) were prepared as described previously (44, 106). Cell surface staining for depletion and activation of T cells was performed with various antibodies, as described previously (106). Labeling of myeloid cells was performed with fluorescein iso-thiocyanate (FITC)- or allophycocyanin (APC)-CD11c, and phycoerythrin (PE)-or PECy7-CD11b (BD Pharmingen) and PE-F4/80 (Cedarlane Labs) antibodies. CellQuest software (BD Dickinson) was used for analysis.
Purification of lymphoid and myeloid cells.CD4ⴙT cells, CD8ⴙT cells and
B cells were purified by cell sorting, by positive selection using the MoFlo cell sorter (MoFlo, Colorado), as previously described (106). Peritoneal macro-phages were harvested by injecting 10 ml of fresh medium (Iscove medium supplemented with 10% fetal bovine serum) into the peritoneal cavity of the animals, followed by plating on Petri dishes (Falcon) overnight. The attached macrophages were washed three times with phosphate-buffered saline (PBS).
The purity of these cells (⬎90%) was confirmed by using anti-Mac1 antibodies.
FL cell transplantation. Young (8- to 12-week-old) C3H/HeN (H-2k
)
(CD45.2⫹) non-Tg mice were lethally irradiated (950 rads) and injected via the
tail vein with 4⫻106
fetal liver (FL) cells from Tg (CD45.1⫹and/or CD45.2⫹)
14.5-day-old embryos. Chimeras were analyzed 3 to 12 months after transplan-tation.
Killing ofC. albicansby peritoneal macrophages.Elicited peritoneal
macro-phages were harvested 3 days after mice were given an intraperitoneal injection of 1 ml of sterile 0.04% sodium thioglycolate (Sigma-Aldrich). The cells were washed with PBS, treated with lysing buffer to remove erythrocytes, washed again with PBS, and resuspended in RPMI 1640 medium (Gibco, Grand Island, NY)
supplemented with 20 mM HEPES buffer, 2 mML-glutamine, and 100 U of
penicillin, streptomycin, and gentamicin/ml. To assay killing,C. albicansLAM-1
on November 8, 2019 by guest
http://jvi.asm.org/
was grown in Sabouraud dextrose broth (BD Diagnostics, Sparks, MD) at 30°C for 18 h with rotary agitation. The cells were collected by centrifugation and
washed twice with PBS. Then, 2.5⫻105
macrophages were incubated with
FITC-labeled, liveC. albicansblastoconidia in 100l of supplemented RPMI
medium at a 1:1 effector/target cell ratio at 37°C. A negative control assay was
performed at 4°C in the presence of cytochalasin B (5g/ml; Sigma-Aldrich).
After incubation, macrophages were lysed with 2.5% sodium deoxycholate, and
killedC. albicanscells were labeled with ethidium bromide (0.1g/ml) and
quantitated by flow cytometry.
Inoculation ofC. albicans.Oral inoculation withC. albicansLAM-1 strain,
assessments for signs of morbidity, quantification ofC. albicansin the oral
cavities of individual mice, and determination of the burdens ofC. albicansin the
gastrointestinal tracts and internal organs were conducted as described previ-ously (26).
Statistical analysis.Statistical analyses (analysis of variance, Sigmastat, and
the Studentttest) were performed as previously described (26, 78, 106).
RESULTS
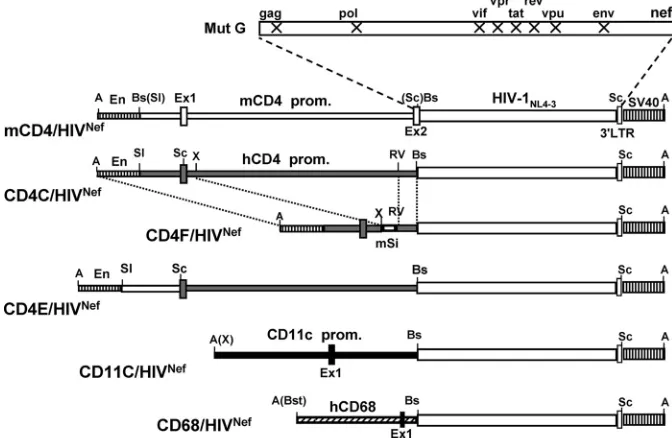
Construction of Tg mice.For the present study, five addi-tional Tg strains expressing HIV-1 Nef through restricted cell-specific regulatory elements (mCD4, CD4E, CD4F, CD68, and CD11c) were generated (Fig. 1).
The mCD4 sequences, upstream of the mouse CD4 gene coding region, were previously shown to specifically direct the expression of genes mainly in thymic and peripheral CD4⫹T cells, but not in cells of the monocyte/macrophage lineage (23, 83, 88). The CD4E and CD4F regulatory elements were pre-viously shown to promote high expression of surrogate genes in CD4⫹T cells and in lymphoid and myeloid DC (CD4E) or in CD4⫹ T cells and lymphoid DC (CD4F), but not in most macrophages (47). The CD68 sequences represent the pro-moter of the human CD68 gene. These sequences were previ-ously used to express surrogate genes in myeloid cells, includ-ing macrophages (34, 38, 62). Finally, the CD11c sequences
were from the mouse CD11c gene and were previously re-ported to promote cell-specific expression of various genes in DC (14–16). These cell-specific regulatory sequences were li-gated to HIVNef, as was done previously (44) (Fig. 1).
For each DNA construct, at least two independent Tg founder (F) lines expressing the transgene were generated and used in the present study: mCD4/HIVNef (F69457, F85838,
F85840, and F86708), CD4E/HIVNef(F104990 and F104991),
CD4F/HIVNef(F78558, F78559, and F95136), CD68/HIVNef
(F115705, F115706, F115707, F115708, and F115709), and CD11c/HIVNef(F98501, F98502, F98503, F98504, F98506, and
F98507).
Transgene expression. The levels of HIV transgene expres-sion were first measured by both Northern (Fig. 2A) and Western (Fig. 2B) blotting of, respectively RNA and proteins from lym-phoid and nonlymlym-phoid organs of mice from different founder lines and compared to the levels of expression in the CD4C/ HIVNef Tg mice (F27367) used in our earlier study (44). The
levels of transgene expression varied among different founders, as expected, most likely as a result of variations of the trans-gene integration sites, with the following order: (i) in the thy-mus, for mCD4/HIVNef, F85840⬎F85838⬎(CD4C/HIVNef)
F27367⬎ F69457 ⫽F86708; for CD4E/HIVNef, F104991 ⫽
F104990 ⱕ F27367 (CD4C/HIVNef); and for CD4F/HIVNef,
F95136ⱖF78558⬎F27367 (CD4C/HIVNef)⬎F78559; (ii) in
the peritoneal macrophages, for CD68/HIVNef, F115708 ⬎
F115706⫽ F27367 (CD4C/HIVNef) ⬎ F115709⫽ F115707;
and (iii) in the spleen, for CD11c/HIVNef, F98507⫽ F27367
(CD4C/HIVNef)⫽ F98506 ⬎F98501. For CD68/HIVNefTg
[image:3.585.122.458.71.290.2]mice, Nef expression was easily detectable in the LN, in the spleen, and in peritoneal macrophages, whereas CD11c-driven HIVNefexpression was best detectable in the spleens and LN FIG. 1. Structure of the transgenes. The mCD4/HIVNef, CD4E/HIVNef, CD4F/HIVNef, CD68/HIVNef, and CD11c/HIVNefDNAs were con-structed as described in Materials and Methods. Symbols: En, mouse CD4 enhancer; hCD4 prom, human CD4 promoter; mSi, mouse silencer; mCD4 prom, mouse CD4 promoter; hCD68 prom, human CD68 promoter; CD11c, mouse CD11c promoter; SV40, polyadenylation sequences from SV40; Ex1 and Ex2, Exons 1 and 2. X represents interruption of the ORF of the indicated HIV-1 genes. Restriction sites: A, AatII; Bs, BssHII; Bst, BstXI; RV, EcoRV; Sc, SacI, Sl, SalI; X, XbaI. Thin bars: regulatory sequences from human CD4 (u), mouse CD4 (䡺), mouse CD11c (f), or human CD68 (o) gene. Thick bars: HIV genome; stippled boxes, SV40 sequences; boxes, exons.
on November 8, 2019 by guest
http://jvi.asm.org/
FIG. 2. Expression of HIV in Tg mice. (A) Northern blot analysis of HIV-1 RNA from various tissues of Tg mice of the indicated founder (F) lines and from non-Tg littermates. RNAs from CD4C/HIVNefTg mice (F27367) serve as a positive control. Total RNAs were hybridized with 32P-labeled HIV-1-specific probes. The blots were striped and rehybridized with a32P-labeled DNA oligonucleotide probe homologous to 18S rRNA. Also shown below each blot are the semiquantitative values for the levels of expression relative to CD4C/HIV Tg tissues (value of 1), measured as described in Materials and Methods. Symbols: T, thymus; S, spleen; Ln, lymph nodes; K, kidney; Br, brain; Lv, liver; Lu, lungs; H, heart; Sk, skin, Ts, testis; M, muscle. (B) Western blot analysis of Nef in protein extracts from different tissues. For mCD4/HIVNef, CD4E/HIVNef and CD4FNefTg mice, thymuses from 1-month-old mice and from their non-Tg littermates were used. A thymus from CD4C/HIVNefTg mouse was used as a positive control. For CD68/HIVNefand CD11c/HIVNefTg mice, proteins were detected in peritoneal macrophages and spleen, respectively. The membranes were probed with rabbit anti-Nef antibodies and then stripped and blotted with anti-actin antibody. Proteins were visualized by incubating the membranes with secondary anti-rabbit antibodies coupled to Alexa 680 fluorochrome, followed by scanning with an
on November 8, 2019 by guest
http://jvi.asm.org/
of Tg mice. These results showed that the levels of transgene expression were comparable to or higher than those of CD4C/ HIVNefTg mice in at least one line of each Tg strain.
To further document and monitor the identity of the cells expressing HIV-1 Nef, different cell populations were purified from the LN and spleen (CD4⫹and CD8⫹T cells, B cells, and DCs) and from the peritoneum (macrophages) of each Tg line and processed for quantitative real-time RT-PCR (Fig. 2C). Expression of the transgene was observed mainly in CD4⫹T cells of mCD4/HIVNefTg mice; in CD4⫹T cells and DC (one
founder) of CD4F/HIVNefTg mice; in CD4⫹T cells, DC, and
to a lower extent in macrophages and CD8⫹ T cells (one founder) of CD4E/HIVNefTg mice, thus confirming our
pre-vious data (47) on the specificity of these latter two promoters. For CD68/HIVNef Tg mice, high transgene expression was
documented in macrophages (confirming data obtained by Western blot analysis [Fig. 2B]) and DC, but not at significant levels in lymphoid cells. Finally, the expression of HIV-1 in CD11c/HIVNef Tg mice was mainly detected in DC, as
ex-pected.
Development of very mild AIDS-like nonlymphoid organ diseases in CD4F/HIVNef
Tg mice and their absence in mCD4/ HIVNefand CD4E/HIVNefTg mice.In addition to severe im-munodeficiency, the CD4C/HIVNefTg mice also develop
se-vere kidney, lung, and cardiac diseases and have a shorter life span (44, 55). To determine whether similar diseases affect these new Tg mice, groups of 15 to 20 Tg mice from each founder of mCD4/HIVNef, CD4F/HIVNef, and CD4E/HIVNef
Tg strains and their non-Tg littermates were generated and observed for up to 12 months for the development of signs of illness (hypoactivity and weakness, ruffled hair, respiratory problems, weight loss [wasting], and diarrhea). During this observation period, these Tg mice survived as long as the non-Tg mice. At necropsy, they did not show any gross pathol-ogy, except that the peripheral LN were smaller (see below). Microscopic assessment of nonlymphoid tissues made in Tg mice at different ages (up to 10 months old) revealed no dis-ease in the kidney and lungs of all founders of CD4E/HIVNef,
CD4F/HIVNef, and mCD4/HIVNefTg mice. In fact, these
non-lymphoid organs seemed undistinguishable from those of their non-Tg littermates. In contrast, older (⬎12-month-old) CD4F/ HIVNefTg mice showed identical, but much milder Tg-specific
pathologies in the nonlymphoid organs similar to those ob-served previously in CD4C/HIVNefTg lines (43, 44).
The complete absence of nonlymphoid organ diseases in
mCD4/HIVNefand CD4E/HIVNefTg mice indicates that high
expression of Nef in only CD4⫹T cells or in some DC subsets and macrophages (47) is not sufficient to induce all of the AIDS-like phenotypes in mice. These data strongly suggest that Nef must be expressed in other cell subset(s) to initiate the development of the multiple organ lesions observed in CD4C/ HIVNefTg animals.
The number of CD4ⴙT cells is decreased in Tg mice ex-pressing Nef through the mCD4, CD4E, or CD4F regulatory elements.Compared to that of their age-matched non-Tg lit-termates, thymuses of mCD4/HIVNef, CD4E/HIVNef, or
CD4F/HIVNefTg mice displayed a lower cellularity (Table 1)
than did the thymuses of CD4C/HIVNefTg mice (44).
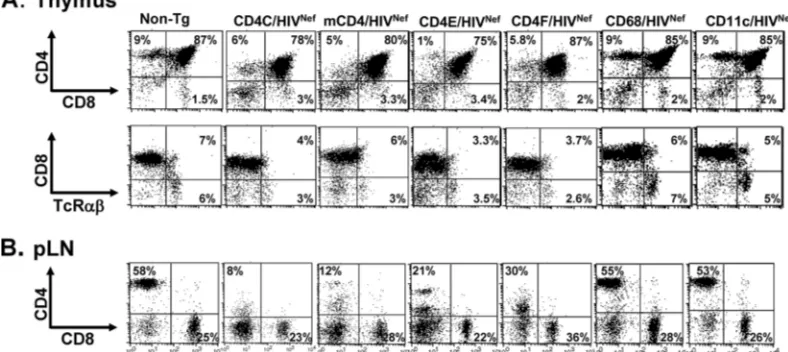
Fluo-rescence-activated cell sorting (FACS) analysis confirmed that the absolute number of DP CD4⫹CD8⫹and SP CD4⫹ thy-mocytes of young (⬍3-month-old) Tg animals from most founder lines were decreased relative to that of their non-Tg littermates (Fig. 3A and Table 1). In addition, the CD4 cell surface expression was downregulated on both SP and DP thymocytes (Fig. 3A and Table 1). FACS analysis of cells from the pLN (Fig. 3B and Table 2) or spleens (data not shown) of mCD4/HIVNef, CD4E/HIVNef, and CD4F/HIVNefTg mice
re-vealed a severe CD4⫹T-cell depletion similar to that in CD4C/ HIVNefTg mice, which resulted in an alteration of the CD4/
CD8 cell ratio (Fig. 3B and Table 2). Furthermore, the CD4 surface protein on the pLN CD4⫹T cells was severely down-regulated (Fig. 3B and Table 2).
These results show that when Nef is expressed under the regulation of the mCD4, CD4E, or CD4F sequences, thymic and peripheral CD4⫹T cells are severely depleted to a degree comparable to that observed in CD4C/HIVNefTg mice,
con-firming previous studies in Tg mice expressing Nef with differ-ent T-cell-specific promoters (12, 65, 89).
Peripheral mCD4/HIVNef
, CD4E/HIVNef
, and CD4F/HIVNef
Tg CD4ⴙT cells exhibit an activated/memory-like phenotype.
We next examined whether peripheral CD4⫹ T cells from mCD4/HIVNef, CD4E/HIVNef, and CD4F/HIVNefTg mice
ex-hibit an activated/memory-like phenotype as in CD4C/HIVNef
Tg mice (106) or in other Tg mice showing T-cell-restricted Nef expression (58, 65, 89). FACS analysis showed that a larger proportion of Tg CD4⫹T cells expressed CD69 and CD25 cell surface markers and were CD44high, CD45RBlow, and
CD62Llow cells (Fig. 4A to E). Similarly, Tg CD8⫹ T cells
showed signs of activation in these three Tg lines, i.e., a higher percentage of CD8⫹CD44⫹cells, but not of the other
activa-Odyssey infrared imaging system (Licor). The actin-specific bands were visualized on the same imaging system as described above for the Nef-specific bands. The ratio of the Nef-specific signal relative to that of actin was obtained. The numbers below each lane represent the semiquantitative values for the levels of expression relative to CD4C/HIVNefTg cells (value of 1), measured as described in Materials and Methods. (C) Quantitative RT-PCR analysis. The indicated cell populations were purified by cell sorting or by plating (for peritoneal macrophages) from the LN, spleens, and peritoneal cavities of the different founder strains, as described in Materials and Methods. Staining was performed with PE-coupled anti-mouse B220 (B cells), with APC-coupled anti-mouse CD4 (CD4ⴙT cells), with FITC-coupled anti-mouse CD8 (CD8ⴙT cells) or with FITC-coupled anti-mouse CD11c⫹PE-coupled anti-mouse CD11b (CD11c⫹CD11bHighmyeloid DC). Cells were sorted by gating on the PE-, APC-, FITC-, or PE⫹FITC-positive population. Total RNA was extracted from these cells and quantitative real-time RT-PCR was carried out to detect the HIV-1 transgene RNA, as described in Materials and Methods. The relative levels of expression are shown, with arbitrary values of 100 or 1. All values for the CD4⫹cells, macrophages, or DC of each founder line of each strain are expressed relative to 100 of CD4C/HIVNef Tg CD4⫹T cells, macrophages, or DC, respectively. All values for CD8⫹T cells and B220⫹B cells of each founder line of each strain are expressed relative to the value 1 of non-Tg CD8⫹T cells or B220⫹cells, respectively. Therefore, for each cell subset, a comparison was made between the different strains. In F104991 CD4E/HIVNefTg mice, CD4⫹T cells expressing high (H) or low (L) CD4 were analyzed. ND, not done.
on November 8, 2019 by guest
http://jvi.asm.org/
tion markers mentioned above, relative to non-Tg controls (Fig. 4H).
These data indicate that this activated phenotype can segre-gate from other Nef-induced organ diseases (e.g., kidney, lung) and is not sufficient for their development.
Enhanced apoptosis/death of peripheral CD4ⴙT cells from mCD4/HIVNef
, CD4E/HIVNef
, and CD4F/HIVNef
Tg mice.We also measured indices of apoptosis in cells of peripheral LN
from mCD4/HIVNef, CD4E/HIVNef, and CD4F/HIVNef Tg
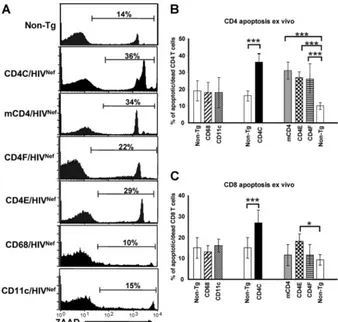
mice by using 7-aminoactinomycin D (7AAD) staining. As shown by FACS analysis, the percentage of 7AAD-positive (apoptotic/dead cells) CD4⫹T cells was larger in all of these Tg mice than in their non-Tg littermates (Fig. 5A and B), and comparable to that in CD4C/HIVNefTg mice (79). Such
[image:6.585.93.487.490.666.2]en-hanced apoptosis was not observed in Tg CD8⫹T cells from the mCD4/HIVNefand CD4F/HIVNefTg mice and was modest TABLE 1. Thymic cell surface marker analysis in HIVNefTg micea
Mouse lineb
Mean no. of cells (10⫺6)⫾SD in different subpopulations
CD4/CD8
Mean fluorescence (%)⫾SDc
Total CD4
⫹
CD8⫹
CD4⫹
CD8⫺
CD4⫺
CD8⫹
Mean TcR
count⫾SD CD4 CD8 SpCD4
Non-Tg 120⫾37 99⫾31 10.5⫾3.4 2.3⫾0.6 13.8⫾5.1 4.0⫾0.8 100 100 100 CD4C/HIVNef 65⫾18* 55⫾15* 2.9⫾1.1* 2.6⫾0.6* 5.4⫾1.6* 1.1⫾0.2* 37⫾2.8* 53⫾9.4* 20⫾4.5* mCD4/HIVNef
F85838 56⫾26* 44⫾21* 4.6⫾2.4* 1.7⫾0.8* 5.6⫾3* 2.6⫾0.9 46⫾10* 52⫾4* 25⫾9* F85840 92⫾49 74⫾42 5.4⫾2* 3.4⫾1.1 1.6⫾0.5* 7.0⫾3* 45⫾7* 51⫾7* 37⫾13* CD4F/HIVNef
F78558 84⫾36 68⫾27 4.7⫾2.3* 4.4⫾2.0 5.6⫾2.6* 1.0⫾0.1* 36⫾3.1* 57⫾4.5* 32⫾10* F95136 45⫾23* 39⫾20* 1.7⫾0.9* 1.6⫾1* 3.0⫾1.7* 1.1⫾0.1* 10⫾0.6* 64⫾1.3* 31⫾2* CD4E/HIVNef
F104990 30⫾6.2* 25⫾5.0* 1.2⫾0.2* 1.1⫾0.2* 2.2⫾0.4* 1.1⫾0.1* 38⫾2* 55⫾0.7* 53⫾13* F104991 43⫾9.6* 31⫾7.8* 4.2⫾1.4* 2⫾0.3 4.3⫾0.9* 2.2⫾0.5* 47⫾21* 70⫾8* 60⫾6.1* CD68/HIVNef
F115706 114.9⫾21.7 95.0⫾17.8 9.3⫾1.2 2.7⫾0.5 17.0⫾2.9 4.9⫾1.6 93.7⫾10.5 94.4⫾9.4 100 F115708 86.5⫾9.5 70.9⫾13 7.8⫾1.5 3.2⫾1.3 13.6⫾5.8 2.6⫾0.6 78⫾12 82⫾3 100 F115709 82.5⫾30.2 68.4⫾25.5 6.7⫾2.3 2.6⫾1.1 12.6⫾5.3 2.6⫾0.6 84.1⫾11.8 99.9⫾18.4 100 CD11c/HIVNef
F98501 88.3⫾23.0 75.3⫾21.4 6.1⫾0.9 1.7⫾0.4 11.2⫾2.4 3.0⫾0.3 99.9⫾5.9 96.7⫾5.8 99.9⫾18.4 F98506 91.4⫾15 73⫾13 12.4⫾3.1 2.0⫾0.4 14.4⫾3.4 5.9⫾0.9 96⫾4 92⫾2.7 100 F98507 107⫾27.1 84.6⫾19.2 12⫾3.8 3.5⫾2 14⫾4.8 4.0⫾1.2 100 100 100
aⴱ,P⬍0.05 according to the Studentttest, comparing Tg with non-Tg groups. TcR, T-cell receptor.
bFACS analysis was performed on four to nine mice (1.5 to 3 months old) for each Tg line, including the positive control CD4C/HIVNefTg mice, except for
CD11c/HIVNefand CD68/HIVNefmice (both founders), which were analyzed at 2 to 4 months of age. The non-Tg control values were obtained by pooling the results
of all non-Tg littermates from different lines.
cThe mean fluorescence values for CD4 and CD8 in DP CD4⫹CD8⫹and CD4 in SP T cells were obtained by calculating the ratio of CD4 or CD8 staining in Tg
thymuses relative to those of non-Tg thymuses (100%). Mean values were then calculated with the values for each line.
FIG. 3. FACS analysis of thymic and peripheral T lymphocytes from Tg mice. Thymus (A) and peripheral lymph node (pLN) (B) cells from a representative Tg mouse from each founder line expressing higher HIV Nef levels (mCD4/HIVNef [F85840], CD4E/HIVNef [F104991], CD4F/HIVNef [F95136], CD68/HIVNef [F115709], and CD11c/HIVNef [F98507]), as well as from a CD4C/HIVNef Tg mouse and a non-Tg littermate, were analyzed the same day by flow cytometry for the expression of CD4, CD8, and TcR␣. The percentage of T cells found in each quadrant is indicated. These data are representative of at least three independent experiments with four to nine (2- to 3-month-old) mice in each line.
on November 8, 2019 by guest
http://jvi.asm.org/
in those of CD4E/HIVNefTg mice (Fig. 5C). Together, these
results suggest that restricted Nef expression in CD4⫹T cells is sufficient to induce their death by apoptosis.
CD4ⴙT cells are only slightly depleted in CD68/HIVNefand CD11c/HIVNef
Tg mice.It has been shown that expression of HIV-1 genes in macrophages or DC has detrimental effects on CD4⫹T cells in vitro (6, 7, 36, 64, 90). To examine the con-sequences of myeloid cell-restricted Nef expression on T cells in vivo, we generated CD68/HIVNefand the CD11c/HIVNefTg
mice (Fig. 1), expressing HIV-1 Nef at undetectable levels in CD4⫹T cells, but at high levels in macrophages and DC or in DC only, respectively (Fig. 2B and C). Mice from each of the CD68/HIVNefand CD11c/HIVNefTg strains remained healthy
and fertile and survived as long as non-Tg mice during the whole observation period, for up to 12 months. Macroscopic and microscopic assessment performed blindly on young (⬍ 6-month-old) and older (7- to 12-6-month-old) Tg mice from founder lines expressing the highest levels of Nef (F115708 and F115709 for CD68/HIVNefand F98506 and F98507 for CD11c/
HIVNef) revealed no disease in the kidneys of these Tg mice
(see Table S1 in the supplemental material). However, mild lung disease (LIP) and pulmonary hypertension were occasion-ally observed in one CD68/HIVNefand in both CD11c/HIVNef
founder Tg mice (see Table S1 in the supplemental material). In contrast to what is usually observed in CD4C/HIVNefTg
mice, the numbers of thymocytes in CD68/HIVNefand CD11c/
HIVNefTg mice were in the normal range and comparable to
those of age-matched non-Tg littermates (Table 1). However, a modest decrease of pLN cellularity was observed in older (3-to 6-month-old) CD11c/HIVNef and CD68/HIVNef Tg mice
(Table 2). In addition, splenomegaly was a frequent manifes-tation in older CD11C/HIVNefTg mice but rarely observed in
CD68/HIVNefTg mice (data not shown) and may reflect an
accumulation of CD11b⫹cells (see below).
To determine whether cooperation between Nef-expressing
cells would lead to the development of more extensive patho-logical changes, we generated CD68HIVNef⫻mCD4/HIVNef,
CD68/HIVNef⫻CD4E/HIVNef, and CD68/HIVNef⫻CD4F/
HIVNef double Tg lines. Analysis of histological changes in
different organs and of the distribution of the major lymphoid populations (by FACS analysis) of these double Tg mice re-vealed no additional phenotypic changes compared to those observed in single Tg mice from each strain (data not shown). FACS analysis of thymic cell populations (DN CD4⫺CD8⫺ cells, DP CD4⫹ CD8⫹cells, and SP CD4⫹CD8⫺or CD8⫹ CD4⫺T cells) of CD68/HIVNefand CD11c/HIVNefTg mice
revealed that they were comparable in percentage and absolute cell numbers to those of their non-Tg littermates (Fig. 3A and Table 1). However, the percentage and absolute cell numbers of CD4⫹T cells in pLN of one line of CD11c/HIVNef(F98507)
and of CD68/HIVNef (F115708) Tg mice was modestly
de-creased (Fig. 3B and Table 2 and data not shown), although such mild depletion was not apparent in mesenteric LN of several founders (data not shown). In addition, staining for the activation markers CD25, CD69, CD44, CD45RB, and CD62L showed that a slightly higher percentage of CD4⫹T cells ex-pressed CD69 and were CD45RBlow and CD62Llowin both
young and older CD11c/HIVNefTg mice relative to their
con-trol littermates (Fig. 4F). Such enhanced activation was rarely observed in CD68/HIVNefTg mice (Fig. 4G). Apoptosis and/or
death of pLN CD4⫹and CD8⫹T cells was not significantly different in CD68/HIVNefand CD11c/HIVNefTg mice relative
to that in their control littermates (Fig. 5B and C). In addition, FACS analysis revealed an accumulation of CD11b⫹cells in the spleen of CD11c/HIVNefTg mice from the two founder
[image:7.585.43.541.81.278.2]lines studied compared to non-Tg mice but not in other lym-phoid organs examined (LN and thymus) (data not shown). This cell population was further studied with markers for mac-rophages and DC, since this latter cell subset has previously been shown to display abnormalities in CD4C/HIV Tg mice
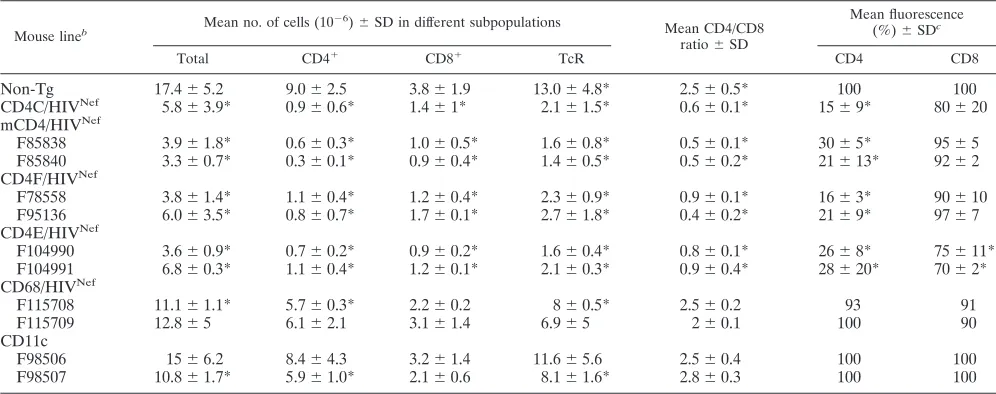
TABLE 2. Peripheral LN cell surface marker analysis in HIVNefTg micea
Mouse lineb Mean no. of cells (10
⫺6)⫾SD in different subpopulations
Mean CD4/CD8
ratio⫾SD
Mean fluorescence
(%)⫾SDc
Total CD4⫹ CD8⫹ TcR CD4 CD8
Non-Tg 17.4⫾5.2 9.0⫾2.5 3.8⫾1.9 13.0⫾4.8* 2.5⫾0.5* 100 100
CD4C/HIVNef 5.8⫾3.9* 0.9⫾0.6* 1.4⫾1* 2.1⫾1.5* 0.6⫾0.1* 15⫾9* 80⫾20 mCD4/HIVNef
F85838 3.9⫾1.8* 0.6⫾0.3* 1.0⫾0.5* 1.6⫾0.8* 0.5⫾0.1* 30⫾5* 95⫾5
F85840 3.3⫾0.7* 0.3⫾0.1* 0.9⫾0.4* 1.4⫾0.5* 0.5⫾0.2* 21⫾13* 92⫾2 CD4F/HIVNef
F78558 3.8⫾1.4* 1.1⫾0.4* 1.2⫾0.4* 2.3⫾0.9* 0.9⫾0.1* 16⫾3* 90⫾10
F95136 6.0⫾3.5* 0.8⫾0.7* 1.7⫾0.1* 2.7⫾1.8* 0.4⫾0.2* 21⫾9* 97⫾7
CD4E/HIVNef
F104990 3.6⫾0.9* 0.7⫾0.2* 0.9⫾0.2* 1.6⫾0.4* 0.8⫾0.1* 26⫾8* 75⫾11* F104991 6.8⫾0.3* 1.1⫾0.4* 1.2⫾0.1* 2.1⫾0.3* 0.9⫾0.4* 28⫾20* 70⫾2* CD68/HIVNef
F115708 11.1⫾1.1* 5.7⫾0.3* 2.2⫾0.2 8⫾0.5* 2.5⫾0.2 93 91
F115709 12.8⫾5 6.1⫾2.1 3.1⫾1.4 6.9⫾5 2⫾0.1 100 90
CD11c
F98506 15⫾6.2 8.4⫾4.3 3.2⫾1.4 11.6⫾5.6 2.5⫾0.4 100 100
F98507 10.8⫾1.7* 5.9⫾1.0* 2.1⫾0.6 8.1⫾1.6* 2.8⫾0.3 100 100
aⴱ,P⬍0.05 according to the Student’sttest, comparing Tg with non-Tg growth.
bFACS analysis was performed on four to nine mice (1.5 to 3 months old) for each Tg line, except for CD4F/HIVNef(F95136) and CD68/HIVNefmice (both
founders), which were analyzed at 2 to 4 months of age. The non-Tg control values were obtained by pooling the results of all non-Tg littermates from different lines.
cThe mean fluorescence values for CD4 and CD8 T cells were obtained by calculating the ratio of Tg CD4 or CD8 relative to that of non-Tg lymph nodes (100%).
Mean values were then calculated with the values for each line.
on November 8, 2019 by guest
http://jvi.asm.org/
on November 8, 2019 by guest
http://jvi.asm.org/
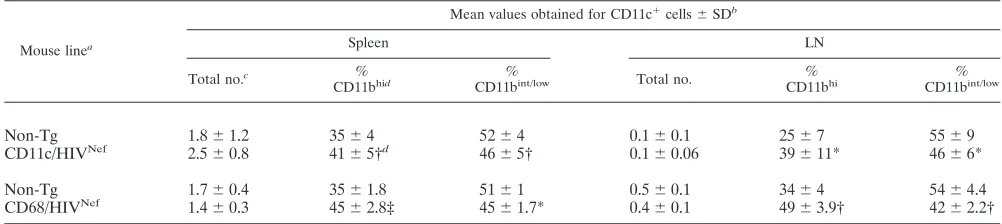
(76). The percentage of myeloid CD11bhi CD11c⫹ DC was
significantly increased in the spleens and pLN of
CD11c/HIV-Nefand CD68/HIVNefTg mice compared to those of non-Tg
mice (Table 3), and these Tg DC showed signs of immaturity, exhibiting lower cell surface expression of major histocompat-ibility complex class II (data not shown). This immature my-eloid DC phenotype is similar to that previously reported in CD4C/HIV Tg mice (76). The number of CD11b⫹ F4/80⫹ macrophages was increased in the spleens of CD11c/HIV Tg mice relative to those in control non-Tg mice (20⫾5 versus 5
⫾ 2.4 ⫻ 106; P ⬍ 0.001), but this increase was milder in
CD68/HIVNefTg mice (9⫾4 versus 6⫾1).
Together, these experiments show that Nef expression in macrophages or DC affects their maturation but is not suffi-cient for inducing disease in nonlymphoid organs and does not contribute significantly to CD4⫹T-cell depletion.
Nonlymphoid organ diseases cannot be transferred by transplantation of fetal liver cells. We next investigated whether organ diseases of Tg mice could be transferred by transplantation of Tg hematopoietic cells. For this, Tg and
[image:9.585.122.460.67.389.2]FIG. 4. Immunophenotype of activation markers on pLN CD4⫹and CD8⫹T cells from Tg mice. (A) Three-color FACS analysis (CD4-APC, CD8-FITC, and CD25-, CD44-, CD45RB-, CD62L-, or CD69-PE) of CD4⫹T cells was performed on pLN from a representative Tg mouse from each strain expressing HIV at high levels, as well as from control CD4C/HIVNefTg mouse and a non-Tg littermate, as described in the legend to Fig. 3. Isotype control antibody for each activation marker was used as a negative control. The number in the upper quadrant represents the percentage of cells in this quadrant. (B to G) Quantification of the percentages (mean⫾the standard error of the mean [SEM]) of CD4⫹T cells expressing CD25, CD69 and CD44 cell surface markers, or being negative for CD45RB and CD62L, as analyzed and shown in panel A. The data were pooled from five to seven non-Tg mice and six to eight Tg mice (3 to 7 months old) from each Tg mouse founder line as described for Fig. 3A. Statistical analyses were performed by using the Studentttest by comparing the Tg CD4⫹T cells with non-Tg CD4⫹T cells expressing the indicated cell surface markers.*,P⬍0.05;**,P⬍0.01;***,P⬍0.001. (H) Histograms representing the percentages (mean⫾the SEM) of CD8⫹ T cells expressing CD44 in different Tg strains. These were obtained and analyzed as described in panels B to G.
FIG. 5. Assessment of cell death of pLN CD4⫹and CD8⫹T cells from Tg mice. (A) FACS profiles of apoptotic and/or dead CD4⫹T cells. The cells isolated from pLN of a Tg mouse from each strain, as described in the legend to Fig. 3, were stained with anti-CD4 and 7AAD and were analyzed by FACS, by gating on CD4⫹T cells. The percentage of apoptotic and/or dead CD4⫹T cells from these representative mice is shown, corresponding to the high and intermediate 7AAD-positive cells. (B and C) Quantitation of apoptotic and/or dead CD4⫹(B) or CD8⫹(C) T cells from pLN. The data were analyzed by FACS as described in panel A and were pooled from results on 5 to 12 Tg (dark bar) and their 11 non-Tg littermate (white bar) 2- to 3-month-old mice from each line, as indicated. Bars in the histogram represent the percentage (mean⫾the SEM) of 7AAD-positive CD4⫹(B) or CD8⫹(C) T cells. Statistical analysis was performed by using the Studentttest.*,P⬍0.05;***,P⬍0.001.
on November 8, 2019 by guest
http://jvi.asm.org/
control non-Tg BM or FL cells were transplanted into lethally irradiated normal mice. Recipient mice were sacrificed 3 to 12 months posttransplantation. Transplantation was successful in all mice, as determined by reconstitution of the CD4⫹ and CD8⫹ T cells clearly derived from the donor BM cells (P. Chrobak et al., unpublished data). None of the 13 Tg chimeric mice generated developed Tg-specific organ diseases, as eval-uated histologically (data not shown), indicating that the pu-tative Nef-expressing cells responsible for inducing organ dis-eases are not transplantable hematopoietic cells.
Chronic oral carriage ofC. albicansin Tg mice.In order to determine whether expression of Nef in specific subsets of hematopoietic cells is required for inducing mucosal candidi-asis, already documented in CD4C/HIVMutA Tg mice (26),
CD4C/HIVNef, mCD4/HIVNef, CD4E/HIVNef, CD4F/HIVNef,
CD68/HIVNef, and CD11c/HIVNefTg mice and their non-Tg
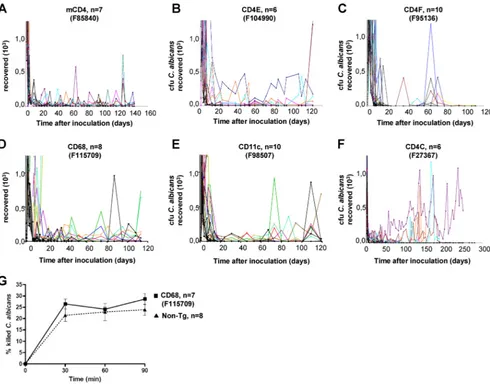
littermates were inoculated orally withC. albicansLAM-1. Longitudinal assessments of oral burdens of C. albicans showed that primary infection in non-Tg mice was self-limited, with uniform clearance of C. albicansfrom the oral cavities within 9 days after inoculation. In contrast, oral burdens were significantly elevated (P⬍ 0.05) in Tg mice from all strains tested for at least 4 months (Fig. 6A to E), although to a lesser extent than in CD4C/HIVNefTg mice (Fig. 6F). In addition,
high burdens ofC. albicanswere found in the stomachs and small and large intestines of Tg mice from all strains but were only rarely found in the non-Tg animals (Table 4). Dissemina-tion to internal organs (brain, lungs, liver, or kidneys) was limited in most Tg mice from all strains, a finding consistent with previous observations in CD4C/HIVMutATg mice (26).
Chronic oral carriage ofC. albicansin CD11c/HIVNefand
CD68/HIVNefTg mice suggested that Nef-expressing myeloid
DC and/or macrophages may exhibit altered functions. We measured the capacity of elicited peritoneal macrophages from CD68/HIVNefTg mice (F115709) to killC. albicans. This latter
line was chosen because it shows high transgene expression in both macrophages and DC. Unexpectedly, CD68/HIVNefTg
peritoneal macrophages were found to killC. albicansto levels comparable to those of control non-Tg mice (Fig. 6G), sug-gesting that the susceptibility to candidiasis of these Tg mice does not result from a defective effector function of macro-phages againstC. albicans.
Together, these results indicate that restricted HIV Nef ex-pression in DC combined or not with exex-pression in macro-phages and CD4⫹ T cells can lead to the development of persistent oral carriage ofC. albicansin Tg mice.
DISCUSSION
Our previous studies have shown that CD4C/HIVNef Tg
mice which express HIV-1 Nef in immature and mature CD4⫹ T cells and in cells of the myeloid/DC lineage develop severe AIDS-like pathologies (44, 57, 76, 77, 79, 106). In the present study, we used five distinct regulatory elements to drive expres-sion of HIV-1 Nef in more restricted immune cell populations of Tg mice. We found that distinct phenotypes were associated with Nef expression in specific immune cell populations. We could also rule out the contribution of some Nef-expressing cell populations to the development of a number of phenotypes.
Restricted expression of Nef in CD4ⴙ T cells, in macro-phages and in DC is not sufficient for the development of nonlymphoid organ diseases. We previously reported that nonlymphoid organ diseases (kidney, heart, and lung) devel-oped in CD4⫺/⫺CD4C/HIV Tg mice in which the
Nef-express-ing CD4ⴙT cells were deleted (106). This strongly suggested that Nef expression in CD4⫹T cells was dispensable for their development. A similar conclusion could be inferred from other studies of Tg mice whose Nef expression, driven by the CD3␦, CD2, or TcRpromoter, was presumably restricted to T cells, although this was not documented (12, 65, 89). In the present study, we extended and confirmed these data by show-ing that the restricted Nef expression in CD4⫹ T cells of mCD4/HIVNef Tg mice did not induce lung and kidney
dis-eases. Surprisingly, we also found that expression of Nef in CD4⫹T cells plus DC (mCD4/HIVNefand CD4F/HIVNef), in
CD4⫹T cells plus macrophages plus DC [(mCD4/HIVNef⫻
CD68/HIVNef) double Tg], in macrophages plus DC (CD68/
HIVNef) and in DC (CD11c/HIVNef) was not sufficient to
[image:10.585.41.542.81.193.2]duce these latter organ diseases. These results are rather in-triguing because these targeted cell populations represent the majority of the immune cells expressing the HIV transgene in the CD4C/HIV Tg mice (43, 47, 48, 77). We have ruled out that the lower pathogenicity for organ diseases in these five new Tg strains could result from lower levels of Nef expression
TABLE 3. FACS analysis of myeloid DC from CD11c/HIVNefand CD68/HIVNefTg mice
Mouse linea
Mean values obtained for CD11c⫹cells⫾SDb
Spleen LN
Total no.c %
CD11bhid %
CD11bint/low Total no. %
CD11bhi %
CD11bint/low
Non-Tg 1.8⫾1.2 35⫾4 52⫾4 0.1⫾0.1 25⫾7 55⫾9
CD11c/HIVNef 2.5⫾0.8 41⫾5†d 46⫾5† 0.1⫾0.06 39⫾11* 46⫾6*
Non-Tg 1.7⫾0.4 35⫾1.8 51⫾1 0.5⫾0.1 34⫾4 54⫾4.4
CD68/HIVNef 1.4⫾0.3 45⫾2.8‡ 45⫾1.7* 0.4⫾0.1 49⫾3.9† 42⫾2.2†
aTg CD11c/HIVNef(F98507) and CD68 (F115708) mice (3 to 6 months old) with their respective littermates. Number of animals: For spleen, 12 CD11c/HIVNefand
5 CD68/HIVNefTg mice with, respectively, nine and five non-Tg littermates; for LN, eight CD11c/HIVNefand four CD68/HIVNefTg mice with, respectively, five and
four non-Tg littermates.
bⴱ,Pⱕ0.05; †,P⬍0.01; ‡,P⬍0.001.
cThat is, the absolute cell number (106).
dGated on total CD11c⫹DC.
on November 8, 2019 by guest
http://jvi.asm.org/
than in CD4C/HIVNef Tg mice, by directly measuring HIV
expression in each of the purified targeted cell populations (Fig. 2C). Therefore, our data strongly suggest that one or many, as-yet-unidentified, cell subset(s) expressing Nef under the regulation of the CD4C elements, but unable to support expression by the mCD4, CD4E, CD4F, CD68, or CD11c promoter and not originating from transplantable hematopoi-etic cell progenitors, is critical for the development of nonlym-phoid organ diseases. This unknown population(s) could rep-resent subsets of nontransplantable myeloid cells or DC not targeted by the CD68 or CD11c promoter, respectively. Alter-natively, it could represent a cell population(s) different from the CD4⫹T cells, myeloid cells, and DC and yet still expressing CD4 in human but not in mice (mimicked in Tg mouse by expression with the human CD4C or the mouse mCD4 regu-latory elements, respectively). Endothelial cells and kidney glo-merular epithelial cells (podocytes) could possibly represent such populations, although these populations are not known to
express CD4. Some authors have reported infection of vascular cells (30, 92, 105) by HIV or SIV, and renal epithelial cells have been shown to be infected by HIV in patients with HIV-1-associated nephropathy (18, 20, 67). Moreover, expression of HIV Nef or other HIV gene products in kidney cells of Tg mice has been reported to induce kidney disease (17, 53, 54, 56, 111). It would be most important to identify the cell popula-tion(s) which appears to be so critical for inducing nonlym-phoid organ diseases by Nef. Since the human CD4C regula-tory elements seem to be active in this murine cell population(s), the corresponding human cell population(s) is likely to express the CD4 receptor. If such a population ex-presses an appropriate coreceptor, it may also be infectible by HIV-1 through its CD4/coreceptor and may represent a signif-icant novel reservoir for the virus.
[image:11.585.49.539.67.451.2]Restricted expression of Nef in several distinct cell subsets is sufficient to induce chronic oral carriage ofC. albicansin Tg mice.We found that the five newly generated HIV Tg strains
FIG. 6. OralC. albicansburdens in Tg mice. (A to F) Tg mice (2 to 3 months old) from the indicated strains and positive control CD4C/HIVNef (F27367), as well as their non-Tg littermates, were inoculated intraorally withC. albicans, and the burdens were assessed longitudinally by sampling the oral cavities. Color lines represent individual Tg mice; black lines represent non-Tg littermates. The number (n) of mice inoculated in each group is indicated in each panel. (G) Phagocytosis and killing ofC. albicansblastoconidia by peritoneal macrophages of non-Tg or CD68/HIVNef (F115709) Tg mice.
on November 8, 2019 by guest
http://jvi.asm.org/
TABLE 4. Viable CFU in organs of HIV Nef Tg mice orally infected with C. albicans Variable Mouse type a CD4C/HIV Nef CD4E/HIV Nef CD4F/HIV Nef mCD4/HIV Nef hCD68/HIV Nef CD11c/HIV Nef Control non-Tg No. of animals inoculated 6 6 10 7 8 10 42 Age at inoculation (days) 76 78 36–76 130–133 66–89 76–82 36–130 Mean age at assessment in days (range) 293 (194–357) b 189 c 175 (149–189) d 275 (273–276) e 189 (178–201) f 193 (192–198) g 195 (148–293) h Organs culture positive for C. albicans Brain No. of mice 2 1 0 0 2 0 0 Mean C. albicans count (CFU/g) 1.8 ⫻ 10 3 6.9 ⫻ 10 3 NA NA 1.8 ⫻ 10 2 NA NA Range (CFU/g) 1.5 ⫻ 10 3–2.1 ⫻ 10 3 NA NA NA 3.1 ⫻ 10 1–3.2 ⫻ 10 2 NA NA Lungs No. of mice 1 1 1 0 2 0 0 Mean C. albicans count (CFU/g) 4.5 ⫻ 10 3 1.8 ⫻ 10 3 8.3 ⫻ 10 0 NA 1.1 ⫻ 10 2 NA NA Range (CFU/g) NA NA NA NA 7.0 ⫻ 10 1–1.5 ⫻ 10 2 NA NA Liver No. of mice 2 0 0 0 0 0 0 Mean C. albicans count (CFU/g) 4.5 ⫻ 10 2 NA NA NA NA NA NA Range (CFU/g) 2.7 ⫻ 10 2–6.3 ⫻ 10 2 NA NA NA NA NA NA Kidneys No. of mice 2 1 0 0 1 0 0 Mean C. albicans count (CFU/g) 2.8 ⫻ 10 2 6.9 ⫻ 10 2 NA NA 5.0 ⫻ 10 1 NA NA Range (CFU/g) 1.1 ⫻ 10 2–4.4 ⫻ 10 2 NA NA NA NA NA NA Stomach i No. of mice 5 4 5 7 7 6 9 Mean C. albicans count (CFU/g) 1.0 ⫻ 10 5 2.3 ⫻ 10 5 1.7 ⫻ 10 5 2.2 ⫻ 10 5 7.2 ⫻ 10 4 1.1 ⫻ 10 5 1.6 ⫻ 10 5 Range (CFU/g) 7.9 ⫻ 10 2–4.0 ⫻ 10 5 4.4 ⫻ 10 4–5.3 ⫻ 10 5 4.1 ⫻ 10 4–4.7 ⫻ 10 5 2.5 ⫻ 10 4–4.9 ⫻ 10 5 9.1 ⫻ 10 1–5.8 ⫻ 10 5 2.0 ⫻ 10 2–3.4 ⫻ 10 5 1.3 ⫻ 10 4–3.8 ⫻ 10 5 Small intestine i No. of mice 5 6 5 7 6 7 9 Mean C. albicans count (CFU/g) 2.0 ⫻ 10 3 2.0 ⫻ 10 4 2.6 ⫻ 10 3 3.3 ⫻ 10 3 5.0 ⫻ 10 3 8.1 ⫻ 10 2 1.6 ⫻ 10 3 Range (CFU/g) 5.9 ⫻ 10 1–6.5 ⫻ 10 3 1.2 ⫻ 10 4–3.8 ⫻ 10 4 2.9 ⫻ 10 2–7.9 ⫻ 10 3 6.5 ⫻ 10 1–1.1 ⫻ 10 4 3.2 ⫻ 10 1–8.1 ⫻ 10 3 3.3 ⫻ 10 1–1.7 ⫻ 10 3 6.6 ⫻ 10 1–9.2 ⫻ 10 3 Large intestine i No. of mice 5 4 5 7 6 8 9 Mean C. albicans count (CFU/g) 3.4 ⫻ 10 4 8.6 ⫻ 10 4 1.0 ⫻ 10 4 8.3 ⫻ 10 3 2.3 ⫻ 10 4 9.4 ⫻ 10 3 6.1 ⫻ 10 3 Range (CFU/g) 8.5 ⫻ 10 2–1.2 ⫻ 10 5 2.8 ⫻ 10 4–1.9 ⫻ 10 5 3.2 ⫻ 10 3–2.4 ⫻ 10 4 1.2 ⫻ 10 3–2.3 ⫻ 10 4 5.3 ⫻ 10 2–9.6 ⫻ 10 4 4.0 ⫻ 10 1–4.3 ⫻ 10 4 7.1 ⫻ 10 2–1.3 ⫻ 10 4 aMice studied included Tg and control non-Tg of fspring derived from founder mouse F27367 (CD4C/HIV Nef ), F104990 (CD4E/HIV Nef ), F95136 (CD4F/HIV Nef ), F85840 (mCD4/HIV Nef , high expresser) and F69457 (mCD4/HIV Nef , low expresser), F115709 (hCD68/HIV Nef ), and F98507 (CD11c/HIV Nef ). NA, not applicable. bFour mice were nonsurvivors (assessments, days 194 to 338); two surviving mice were euthanized (assessment, day 357). cAll six mice survived and were euthanized at 189 days of age. dAll 10 mice survived and were euthanized at 149 to 189 days of age. eAll seven mice survived and were euthanized at 273 to 276 days of age. fAll eight mice survived and were euthanized at 178 to 201 days of age. gAll 10 mice survived and where euthanized at 192 to 198 days of age. hControl non-Tg littermates were euthanized on the same day as the Tg mice. iNote that clearance of C. albicans from stomach and intestine of some non-Tg mice occurs more slowly than from the oral cavity, but without causing mucosal candidiasis as in Tg mice.
on November 8, 2019 by guest
http://jvi.asm.org/
studied here exhibit susceptibility to oral candidiasis compara-ble to that of CD4C/HIVNefTg mice. Such results were
ex-pected in mCD4/HIVNef, CD4E/HIVNef, and CD4F/HIVNef
Tg mice showing depletion and functional anomalies of CD4⫹ T cells, since our previous work has demonstrated that loss of CD4⫹T cells and/or altered CD4⫹T-cell phenotype and func-tion determine, at least in part, the susceptibility to chronic oral carriage ofC. albicansin CD4C/HIVMutATg mice (63).
The susceptibility to candidiasis of CD68/HIVNefand CD11c/
HIVNefTg mice also concurs with our previous observations, in
which expression of the transgene in either or both CD4⫹T cells and DCs abrogated the proliferative response of CD4⫹T cells inC. albicans-pulsed DC/CD4⫹T-cell cocultures in vitro (63). Therefore, successful control ofC. albicans in the oral mucosa of the normal host likely requires the participation and interaction of both of these cell populations.
Nef-expressing DCs in CD68/HIVNefand CD11c/HIVNefTg
mice appear to be defective at generating a fully competent T-cell-mediated adaptive immune response toC. albicans, ei-ther as a result of intrinsic defects or because their CD4⫹T cells are functionally impaired. Whatever the mechanism, the present data clearly show that mucosal candidiasis segregates independently of CD4⫹ T-cell loss and of organ diseases in these Tg mouse strains, suggesting a pathogenesis for candidi-asis distinct from each of these two latter phenotypes, which themselves appear to segregate independently (45, 78, 103).
Expression of Nef in myeloid cells is not sufficient to induce depletion of CD4ⴙT cells.Only a modest decrease of CD4⫹T cells could be documented in pLN (but not in mesenteric LN) of older, but not of younger, CD11c/HIVNefor CD68/HIVNef
Tg mice. In addition, the numbers of thymic CD4⫹ T-cell subsets in these Tg mice were comparable to those of their non-Tg littermates. These results indicate that high expression of Nef in either or both DC and macrophages has little influ-ence on the production and/or maintenance of these lymphoid T-cell populations. This result rules out a model by which CD4⫹T cells would be depleted in CD4C/HIVNefTg mice as
a consequence of their contact with these Nef-expressing my-eloid cells or with factor(s) secreted from them. These in vivo results appear to contrast with previous studies showing that HIV-1-infected human DC or macrophages can mediate CD4⫹T-cell death in vitro (6, 36, 64, 90).
In humans, a major contribution of the presence of this pool of HIV-1-infected myeloid cells may be primarily to facilitate CD4⫹T-cell infection, a process well documented (3, 87, 107) but which cannot be scored in the Tg biological system used here.
Expression of Nef in CD4ⴙT cells is necessary and sufficient to induce their depletion.If expression of Nef in macrophages and DC is not sufficient to induce CD4⫹T-cell depletion, our results strongly suggest that its expression in CD4⫹T cells is necessary and sufficient for their loss. First, we found that in each strain expressing Nef in CD4⫹T cells (mCD4/HIVNef,
CD4E/HIVNef, and CD4F/HIVNef), the peripheral CD4⫹ T
cells were depleted to a level comparable to that observed in CD4C/HIVNefTg mice. Second, we could establish that the
diseases in nonlymphoid organs (and the toxic circulating fac-tors produced by them) do not constitute an important con-tributor to the CD4⫹T-cell depletion because significant de-pletion of DP and SP CD4⫹thymocytes and peripheral CD4⫹
T cells still occurs in the absence of organ lesions in these Tg mice. Third, the absence of significant CD4⫹T-cell depletion in CD68/HIVNef and CD11c/HIVNef Tg mice has ruled out
Nef-expressing macrophages and DC as likely cell subsets in-volved in major loss of CD4⫹T cells. Fourth, it would be very unlikely that the putative Nef-expressing cell population(s) that we postulated to be responsible for the nonlymphoid or-gan diseases (see above) would be involved in CD4⫹ T-cell depletion. Indeed, analysis of several Nef mutants and alleles expressed in Tg mice has shown that thymic/peripheral CD4⫹ T-cell depletion and organ disease are two phenotypes segre-gating independently (45, 78, 103). Thus, expression of Nef in CD4⫹T cells appears to be required and may be sufficient for their depletion, although the contribution of all possible CD4⫹ cell populations (such as the rare accessory CD4⫹CD3⫺cells [61]) has not been studied. These results confirm and extend previous work on other Tg mice expressing Nef through T-cell-restricted promoters (12, 65, 89), although Nef was expressed in both CD4⫹ and CD8⫹ T cells in all of these Tg mice. Interestingly, we found that the extent of thymocyte depletion in mice from one mCD4/HIVNef (F85840) and one CD4F/
HIVNef (F78558) founder line was relatively modest despite
the higher levels of Nef expression in thymocytes of these mice relative to those of control CD4C/HIVNefTg mice. This may
suggest additional complexity in the mechanisms of thymocyte versus peripheral CD4⫹ T-cell depletion induced by Nef, a phenomenon previously observed in our work on Nef mutants or alleles (45, 78, 103) and requiring further studies.
Concluding remarks. The use of distinct cell-specific pro-moters to express Nef in Tg mice has thus revealed the critical role of unique cell populations in the induction of specific phenotypes. These studies strongly suggest that the nonlym-phoid organ diseases (lung and kidney) and immune disease (CD4⫹T-cell loss) are induced by Nef expression in distinct cell populations. These studies have also revealed the minimal role of Nef-expressing macrophages and DC in inducing these phenotypes and have suggested the existence of another, as-yet-unidentified, Nef-expressing cell subset responsible for in-ducing the organ diseases and possibly representing another reservoir of Nef-expressing cells. In humans, much of the cell specificity of HIV-1 is provided by its receptor/coreceptor ex-pressed on the target cells. However, since the phenotypes observed in CD4C/HIVNefTg mice are very similar to those
arising in AIDS patients, and since HIV-1 Nef interacts with effectors very well conserved (PAK2, hck, etc.) between mice and humans, the consequences of Nef expression in distinct human cell populations are likely to be very similar to those described in these Tg mice. If indeed this mouse model of AIDS is relevant, it would predict that infection of human immature thymocytes (CD4⫹CD8⫹[DP]) and possibly their progenitors (CD3⫺ CD4⫹, CD4⫺ CD8⫺ [DN], or CD3⫺ CD4⫺CD8⫺[TN]), known to be infectible with HIV-1 in vitro (9, 28, 74, 84, 98, 99, 110) and in SCID-hu mice (2, 5, 91, 94), is the major explanation for the severe changes observed in thymus (smaller volume, depletion of CD4⫹ T cells, loss of architecture) of HIV-1-infected subjects (40, 59, 73, 81, 102; reviewed in references 33 and 68). It would also predict the existence of another reservoir of Nef-expressing cells (not yet identified) that are critical for the development of nonlym-phoid organ phenotypes in some patients.