Australasian Octopuses
Michael D. Amor1,2*, Mark D. Norman2, Hayley E. Cameron3, Jan M. Strugnell1
1Genetics Department, La Trobe Institute for Molecular Science, La Trobe University, Bundoora, Victoria, Australia,2Science Department, Museum Victoria, Carlton, Victoria, Australia,3School of Biological Sciences, Monash University, Clayton, Victoria, Australia
Abstract
Despite extensive revisions over recent decades, the taxonomy of benthic octopuses (Family Octopodidae) remains in a considerable flux. Among groups of unresolved status is a species complex of morphologically similar shallow-water octopods from subtropical Australasia, including: Allopatric populations ofOctopus tetricus on the eastern and western coasts of Australia, of which the Western Australian form is speculated to be a distinct or sub-species; andOctopus gibbsi from New Zealand, a proposed synonym of Australian forms. This study employed a combination of molecular and morphological techniques to resolve the taxonomic status of the ‘tetricus complex’. Phylogenetic analyses (based on five mitochondrial genes:12S rRNA, 16S rRNA, COI, COIII and Cytb) and Generalised Mixed Yule Coalescent (GMYC) analysis (based onCOI,COIIIandCytb) distinguished eastern and Western AustralianO. tetricusas distinct species, whileO. gibbsiwas found to be synonymous with the east Australian form (BS =.97, PP = 1; GMYC p = 0.01). Discrete morphological differences in mature male octopuses (based on sixteen morphological traits) provided further evidence of cryptic speciation between east (including New Zealand) and west coast populations; although females proved less useful in morphological distinction among members of the tetricus complex. In addition, phylogenetic analyses suggested populations of octopuses currently treated under the nameOctopus vulgarisare paraphyletic; providing evidence of cryptic speciation among global populations ofO. vulgaris,the most commercially valuable octopus species worldwide.
Citation:Amor MD, Norman MD, Cameron HE, Strugnell JM (2014) Allopatric Speciation within a Cryptic Species Complex of Australasian Octopuses. PLOS ONE 9(6): e98982. doi:10.1371/journal.pone.0098982
Editor:Erik Sotka, College of Charleston, United States of America
ReceivedApril 26, 2013;AcceptedMay 9, 2014;PublishedJune 25, 2014
Copyright:ß2014 Amor et al. This is an open-access article distributed under the terms of the Creative Commons Attribution License, which permits unrestricted use, distribution, and reproduction in any medium, provided the original author and source are credited.
Funding:A La Trobe University Faculty of Science, Technology and Engineering grant supported this study. The funder had no role in study design, data collection and analysis, decision to publish, or preparation of the manuscript.
Competing Interests:The authors have declared that no competing interests exist. * Email: mdamor@students.latrobe.edu.au
Introduction
Taxonomy within the benthic octopuses (Family Octopodidae) continues to be a source of confusion and controversy and despite extensive revisions in recent decades, the true taxonomy of this family remains unresolved [1,2,3]. The most widely studied and economically significant group of cephalopods worldwide is the
‘Octopus vulgarisgroup’ of octopods. The type species of this group
is the common octopus, Octopus vulgaris Cuvier, 1797. Octopus
vulgaris alone accounts for .50% of the world’s total octopod
fisheries catch, exceeding 380,000 tonnes and has an international
export value of .US$1 billion [4]. The Octopus vulgaris species
group is comprised of tropical, sub-tropical and temperate species from the Americas, Europe, Africa, Asia and Australasia. Members of this group are large muscular octopuses that display similar morphological and behavioural traits as well as occupying similar ecological niches.
Within the subtropical waters of Australasia there is a group of
morphologically, behaviourally and functionally similar Octopus
species, closely related to Octopus vulgaris [3,5]. These species,
currently treated under the namesOctopus tetricus on the east and
west coasts of Australia andO. gibbsiin New Zealand, have been
suggested to be a species complex; the taxonomy of which remains unresolved [3]. We treat these taxa collectively herein as the ‘tetricus complex’, after the first formally described species within
this group, Octopus tetricus Gould, 1852; the common Sydney
octopus.
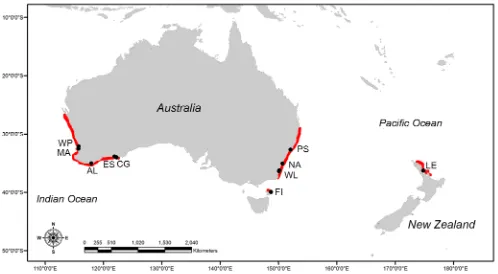
The tetricus complex comprises three geographically distinct
member taxa (Figure 1).Octopus tetricus was originally described
from New South Wales and occurs along the east Australian coastline, ranging from Eden in southern New South Wales to
Moreton Bay in southern Queensland [6].Octopus tetricuscomprises
a major portion of the small-scale commercial octopod fisheries landings in New South Wales [7], and is also often caught as
by-catch in prawn and finfish trawls [8]. RecentlyO. tetricushas been
reported in Tasmania, significantly south of its previous known range [9] although this has not been verified by molecular data.
A second taxon, known as the common Perth octopus, occurs in Western Australia from Esperance to Shark Bay. This population
has extensively been treated under the name Octopus tetricus
[10,11,12,13,14] due to close similarities in morphological, behavioural and functional attributes between east and west coast forms. More recently however, the common Perth octopus has
been treated under the name O. cf. tetricus; a reflection of the
proposal that disjunct east and west populations may be sufficiently isolated and therefore represent sub- or distinct species
[2,15]. Joll [11] estimated that 250 tonnes ofO. cf.tetricus were
harvested annually from Western Australian waters, primarily as
lobsters caught in craypots, and is considered to negatively impact this economically important fisheries resource.
A third nominal species,Octopus gibbsiO’Shea, 1999, was coined
to describe a benthic octopus of unknown relation found within the shallow coastal waters off northern New Zealand. Prior to
description by O’Shea [16],O. gibbsihad been treated under the
nameO. tetricus[17], and more recently the validity ofO. gibbsias a
distinct species has been questioned [2]. Examination of museum
specimens showed strong morphological similarities between O.
gibbsiand Australian forms, leading to the proposal thatO. gibbsiis
synonymous withO. tetricus[2].
A phylogenetic analysis of the sub-family Octopodinae using
amino acid sequences from two mitochondrial (cytochrome oxidase
subunit III and cytochrome b) and a single nuclear genetic marker
(elongation factor-1a) assignedOctopus tetricusandO.cf.tetricusas sister
taxa [3]. Analyses of genetic distance (Kimura 2 Parameter) between these two representatives showed 2.0% and 2.6% sequence divergence within each mitochondrial gene fragment respectively. However, only single representatives from both Western Australia and New South Wales were sequenced in this
study. Consequently, analyses of Guziket al.,[3] were insufficient
to detect the occurrence of speciation between disjunct east and west populations, and no traditional morphological based studies comparing the two populations have been conducted. Further-more, no molecular work to date has investigated the phylogenetic
status ofO. gibbsi, thus its taxonomy remains unresolved.
This study aims to resolve the taxonomic status and
phyloge-netic relationships of the Octopus tetricusspecies complex, using a
combination of molecular and morphological techniques. Due to the emerging fisheries value and the lack of species-level resolution within the tetricus complex, taxonomic resolution within this group will aid in the management of these marine resources.
Materials and Methods
All tissue samples and DNA extracts were loaned from existing museum/university collections. Thus, no animals were harmed or killed in conducting this study. All appropriate permissions were obtained from the relevant institutions prior to accessing their collections.
Molecular analyses
Sampling. Tissue samples of the ingroup (Octopus tetricus
[n = 13],O.cf.tetricus[n = 17] andO. gibbsi[n = 4]) were sourced
from collections at Museum Victoria, or provided by researchers associated with The University of Adelaide, the Western Australian Fisheries and Marine Research Laboratories Depart-ment and the University of Tasmania (Table S1 in File S1). Tissue
samples (as arm or mantle tissue,1 cm in length) were taken from
individuals collected from the Australian mainland, Flinders Island (Tasmania) and New Zealand (Figure 1). All tissue samples were
stored at220uC in 70–90% ethanol until processing.
Sequencing. DNA was extracted from mantle or tentacle tissue using the ‘High Salt Method’ [18]. Partial sequences of five
mitochondrial genes were targeted; including12S ribosomal RNA
(12S) [19],16S ribosomal RNA(16S), andcytochrome oxidase subunits one
(COI) [20], three (COIII) and cytochrome b (Cytb) [3]. 25mL
reactions comprised 0.1mL Taq (Onetaq, New England Biolabs),
2.5mL 10 x buffer (Paq5000TM), 2mL dNTP mix (10mM,Bioline),
0.5mL forward primer (10mM), 0.5mL reverse primer (10mM),
17.4mL ddH2O and 2mL DNA (diluted to between 1–5 ng/mL).
Reaction conditions are detailed elsewhere [21]. PCR products
were sequenced byMacrogen Inc, Seoul, Korea. Genetic sequences
[image:2.612.58.556.59.333.2]generated in this study are accessible from GenBank under accession numbers KJ605215-KJ605347.
Octopus mimusandO. oculiferwere selected as outgroup taxa on the basis that they are morphologically very similar to, and the closest known available relatives of the ingroup [2,5,22]. Sequences of the outgroup and additional sequences of ingroup taxa from previously published work were downloaded from GenBank (Table S2 in File S1). Multiple sequence alignments
were performed usingGeneiousMuscle Alignment feature using the
ClustalW default settings [23].
Phylogenetic analyses. jModelTest v0.1.1 [24] was used to carry out statistical selection of best-fit models of nucleotide
substitution on the concatenated alignments and also for theCOI
alignment alone. The appropriate model was selected on the basis of ‘goodness of fit measure’ via the Akaike Information Criterion (AIC) [25].
Maximum likelihood (ML) topologies were constructed using
PhyML v3.1 [26]. Full heuristic searches were undertaken and
model parameter values were treated as unknown and were estimated. Strength of support for internal nodes of ML construction was measured using 1000 bootstrap replicates. Bayesian marginal posterior probabilities were calculated using
MrBayes v3.2 [27]. Model parameter values were treated as
unknown and were estimated. Random starting trees were used and the analysis was run for 15 million generations, sampling the
Markov chain every 1000 generations. The programTracerv1.3
[28] was used to ensure Markov chains had reached stationarity, and to determine the correct ‘burn-in’ for the analysis (the number of additional generations that must be discarded before stationarity is reached).
Genetic distance. Molecular Evolutionary Genetic Analysis
(MEGA) v5.2 [29] was used to calculate genetic distances for
populations ofOctopus tetricus, O. gibbsiandO.cf.tetricususing the
Tamura-Nei model [30]. Genetic distance was calculated using
MEGA default settings (with the exceptions of the model and
‘pairwise deletion of missing data’ option). Mean values6SE of
interspecific and intraspecific variations in number of mutations
per site were calculated for the barcoding mitochondrial geneCOI
to allow comparison with published literature.
Timing of divergence. Divergence time between clades were calculated based on an estimated rate of evolution of cephalopods; 3.81 substitutions per site per billion years (with 95% highest posterior density around this mean of 2.43–5.24; [31]) within a generalised molecular clock.
Coalescent delimitation. Potential species delimitation
amongOctopus tetricus, O. gibbsiandO.cf.tetricuswas investigated
using a Generalised Mixed Yule Coalescent (GMYC) model [32] applied to the molecular/phylogenetic data. Partitioned sequence
data from the mitochondrial genes COI, COIII and Cytb were
prepared into XML files using the software program BEAUti
v1.7.5 [33].12Sand16Sregions were excluded from the analysis
due to low comparable sample representation (see Table S1 in File S1). A coalescent prior and relaxed molecular clock [34] were set as parameters before Bayesian analysis was performed using
BEAST v1.7.5 [33]. Each analysis was performed independently
twice and log/tree files were combined usingLogCombiner v1.7.5
[33]. The data was then analysed via a single threshold model [35]
in the software package Splits [36] available in R v3.0.1 [37],
whereby clades with posterior probability values greater than 0.9 were acknowledged.
Morphological analyses
Morphological data was obtained from preserved whole specimens sourced from Museum Victoria, Australian Museum (Sydney) and the University of Tasmania. Samples were collected from south west (n = 15) and south east (n = 32) of the Australian
mainland (between the years 1980–2007) as well as Flinders Island, Tasmania (n = 11; 2011) (Table S3 in File S1). All specimens had been initially fixed in 10% formalin and transferred
to 70–90% ethanol for preservation. Morphological data forO.
gibbsi(n = 6) was sourced from the published work of O’ Shea [16].
Specimens were sexed based on three factors which allowed confident classification: 1) presence of terminal organ in males, 2) presence of hectocotylised arm in males and 3) number of genital glands present within the mantle (1 = male, 2 = female) [38]. Maturity in males was determined on the basis of the presence or absence of enlarged suckers (for mature and immature specimens, respectively) [39]. Maturity in females was determined by the state of egg development [40]. All specimens were weighed using digital scales to the nearest 0.1 gram after being removed from ethanol and patted dry with absorbent tissue.
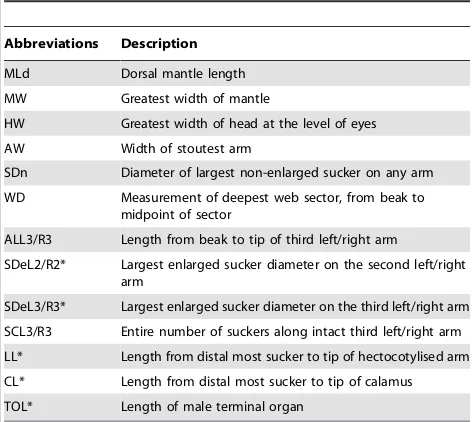
Standard morphological characters were measured following Norman and Sweeney [41] (Table 1). Dorsal mantle length (MLd), mantle width (MW), head width (HW), arm width (AW), and the greatest non-enlarged sucker diameter (SDn) were recorded using digital callipers to the nearest 0.1 mm. In males, the greatest enlarged sucker diameter (SDe), the length of hectocotylised arm components (i.e. ligula [LL] and calamus [CL]) and terminal organ length (TOL); following dissection of the mantle, were also measured using digital callipers to the nearest 0.1 mm. For all specimens, third right (ALR3) and third left (ALL3) arm lengths were measured from arm tip to the beak opening using non-stretch string to the nearest 1 mm. The numbers of suckers occurring on the third right (SCR3) and third left (SCL3) arms were counted with the aid of a dissecting microscope. In cases where damage to an arm was perceived to inhibit growth, suckers appeared damaged, or arm regeneration was evident, arm length and sucker counts were not recorded. Where sucker and arm damage was minor, and sucker scars or remnants were visible, suckers and arm lengths were recorded. All missing values for individual traits were replaced with the global mean of that trait across the whole dataset.
All morphological analyses were performed using Systat v13
[42]. Differences in morphological traits between tetricus complex taxa were investigated using a multivariate General Linear Model (GLM), in which location was treated as a fixed factor, morphological counts were all treated as dependent variables and MLd was entered as a co-variate [43]. Inclusion of MLd as a co-variate controlled for the effect of body size, and therefore allowed investigation of size free shape variation in morphological traits. MLd was considered an appropriate proxy for an individual’s body size as it was found to be highly correlated with
body mass (R2= 0.8467, data not shown), is more often provided
in the literature compared to total body length, and is a standardized measurement when compared to body weight (which can be obtained from fresh or preserved specimens) [44]. The presence or absence of an interaction between locations and MLd was investigated via GLM. A non-significant or weak significant result indicated individuals across all locations were of a similar size class and were therefore comparable.
Males and females were analysed separately to allow the inclusion of male reproductive organs in morphological analyses. Mean scaling was performed on all dependant variables prior to
analyses as per Berner [43] using the software packageRv3.0.1
Following multivariate GLM analyses on each of the sexes, principle component (PC) loadings were calculated for each individual by multiplying the mean scaled raw data of each trait by the canonical loading of that trait (supplied by the GLM output) and summing the products for all traits [45]. Principle components were then plotted for visualisation and canonical correlations used to calculate the eigenvalues and proportion of variance explained by each PC (Tables S4-S12 in File S1).
The importance of each morphological character in delineation between tetricus complex taxa was further investigated by Roy-Bargman step-down analysis [46], which has the advantage of retaining information on correlations between multivariate vari-ables compared with univariate F-tests. Following a significant result from GLM analysis morphological traits were ranked in theoretical order of importance by multiplying the first and second canonical loadings (CL1 and CL2) for each trait by the total variance explained by PC1 and PC2, respectively. The resulting values were added together, and traits displaying the highest joint CL were ranked as having the highest priority. Each trait was then investigated sequentially in order of descending ‘importance’ via regression analyses; in which location was a categorical predictor and MLd a co-variate (for size-correction) for all analyses. Higher priority traits were added as co-variates in each successive analysis.
Tukey’s post-hoc tests were performed for each significant
step-down analysis to determine differences in morphological traits among locations. Step-down analysis was continued until tests yielded an insignificant effect. Probability values were adjusted via the Bonferroni correction method to account for multiple testing. To further explore classification of tetricus populations into taxonomic groups, Discriminant Function Analysis (DFA) was performed. As DFA cannot incorporate co-variates, analyses were conducted on calculated principle component loadings for each sex. Principle components were used for DFAs as they were calculated from the original multivariate GLM, and were therefore size corrected. In addition, PCs are composite variables calculated for each individual, and consequently encompass any correlations between morphological traits [45]. For all DFAs, Jackknifed
correlation matrices were used as they are considered a more reliable estimator of group membership assignment [47].
Results
Molecular analyses
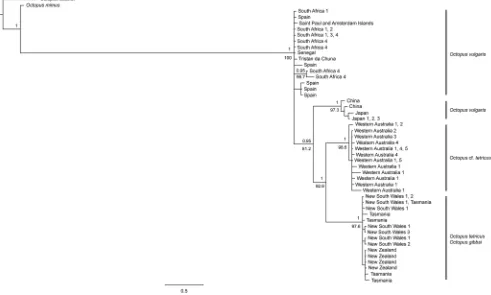
Phylogenetic analyses. The AIC indicated that TrN+G was the preferred evolutionary model for the concatenated alignment and this was utilised within ML and Bayesian phylogenetic analyses. Topologies resulting from ML and Bayesian analyses were identical, recovering a highly supported clade containing
Octopus tetricusfrom east Australia and Tasmania, as well asO. gibbsi
from New Zealand (bootstrap value [BS] = 97.6, posterior probability [PP] = 1; Figure 2). All individuals collected from Western Australia fell within a highly supported monophyletic clade (BS = 98.6, PP = 1). A sister-taxon relationship was supported between the Western Australian and east coast (east Australia, Tasmania and New Zealand) clades (BS = 92.6, PP = 1).
AllOctopus vulgarisindividuals collected from the waters off Japan
and China formed a highly supported monophyletic clade (BS =
97.3, PP = 1). The Japanese and Chinese O. vulgaris and the
tetricus complex were supported as a monophyletic clade (BS =
81.2, PP = 0.95). This clade fell within a larger clade containingO.
vulgarisindividuals from Spain (type location; Mediterranean Sea),
South Africa, St Paul and Amsterdam Islands, thereby rendering
theO. vulgarisclade to be paraphyletic.
Genetic distance. Octopus gibbsi was treated asO. tetricus in
genetic distance calculations onCOIsequence data based on high
support values of phylogenetic analyses previously described.
Comparisons of within species (i.e. withinO. cf.tetricusor withinO.
tetricus/O. gibbsi) and between species TrN genetic distance forO.
tetricus (including O. gibbsi) and O. cf. tetricus showed that mean
between species divergence (3.34%) was approximately 17.5 times greater than mean within species divergence (0.19%).
Timing of divergence. Based on TrN distances, a date of
divergence of ,3.2–6.9 million years ago (ma) was estimated
betweenOctopus tetricusfrom the east coast of Australia (inclusive of
O. gibbsi) andO.cf.tetricusfrom Western Australia (Table S13 in
File S1). Furthermore, the Australian tetricus complex clades and
the Japanese/Chinese O. vulgaris clade were estimated as being
separated by,5.4–11.6 million years (Table S14 in File S1).
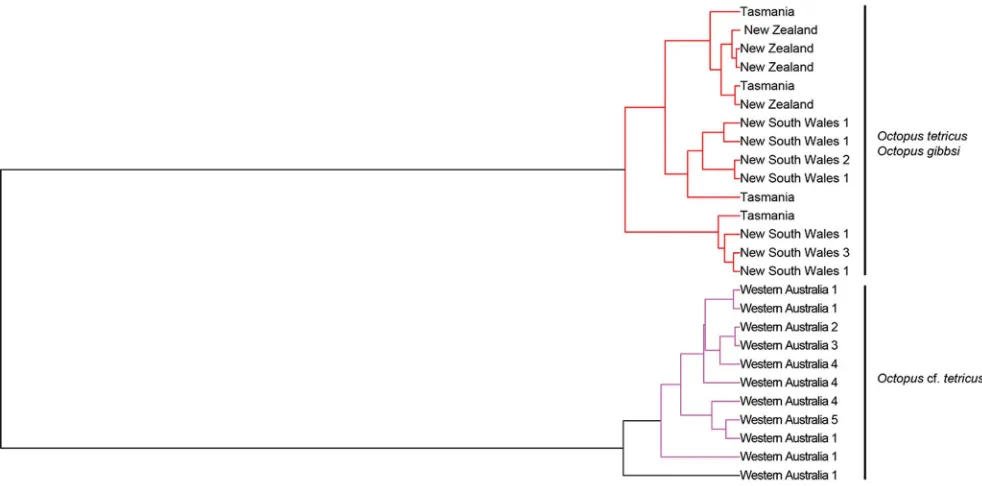
Coalescent delimitation. Two ML clusters and three entities (i.e. species) were supported via GMYC analysis (p = 0.01). All individuals from the east coast of Australia,
Tasmania (Octopus tetricus) and New Zealand (previouslyO. gibbsi)
comprised a single monophyletic clade, whilst the second monophyletic clade was comprised entirely of individuals from Western Australia (Figure 3). A third clade was supported by the GMYC analysis and comprised a single individual from Western Australia, although this clade was paraphyletic, forming a monophyletic clade with other Western Australian individuals.
Morphological analyses
Males. No strong interaction between the independent variable (coast) and the co-variate (MLd) was recorded (Pillai
Trace = 1.937, F = 1.709, df= 48,45, p = 0.04), therefore the
General Linear Model was run without the interaction. A significant difference was recorded among four coasts for the multivariate model based upon 16 morphological traits (and MLd as co-variate) measured from 36 mature male octopods (Pillai
Trace = 2.070, F = 2.503,df= 48,54, p = 0.001; Table 2).
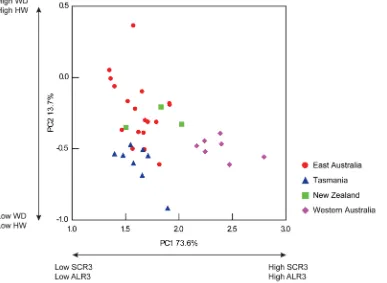
[image:4.612.62.298.88.299.2]Visual-isation of the male PC biplot showed individuals from the east coast of Australia, Tasmania and New Zealand could not be distinguished from one another, and were characterised by Table 1.Description of morphological measurements
recorded.
Abbreviations Description
MLd Dorsal mantle length
MW Greatest width of mantle
HW Greatest width of head at the level of eyes
AW Width of stoutest arm
SDn Diameter of largest non-enlarged sucker on any arm
WD Measurement of deepest web sector, from beak to midpoint of sector
ALL3/R3 Length from beak to tip of third left/right arm
SDeL2/R2* Largest enlarged sucker diameter on the second left/right arm
SDeL3/R3* Largest enlarged sucker diameter on the third left/right arm
SCL3/R3 Entire number of suckers along intact third left/right arm
LL* Length from distal most sucker to tip of hectocotylised arm
CL* Length from distal most sucker to tip of calamus
TOL* Length of male terminal organ
relatively small SCR3 and ALR3 (Figure 4). Western Australian individuals formed a distinct group separate from east coast individuals. Individuals from Western Australia were characterised as having greater SCR3 and ALR3 (PC1) in comparison to individuals from east Australia, Tasmania and New Zealand. No distinctions based upon WD and HW among locations were detected (PC2).
DFA showed a significant difference among individuals from east Australia, Tasmania, New Zealand and Western Australia
(Pillai Trace = 1.201, F = 16.020, df= 6, 64, p =,0.001). DFA
assigned 100% (n = 7) of male individuals from Western Australia to a single group comprised solely of Western Australian individuals (Table 3). DFA assigned 83% (n = 15) of east Australian individuals to the east Australian group, with 17% (n = 3) allocated to the Tasmanian group. Furthermore, 88% (n = 7) of Tasmanian individuals were assigned to the Tasmanian group, whilst 12% (n = 1) were grouped with east Australian individuals. All individuals from New Zealand (n = 3) were allocated into the east Australian group.
Ranking of CLs determined male SCR3 to be the most important variable in detecting variance among groups (Table S8 in File S1). Step-down analysis performed on male SCR3 showed
a significant difference among coasts (F = 41.775, df= 3, p =,
0.001). Tukey’spost-hoc analysis showed no significant difference
among east Australia, Tasmania and New Zealand (p =.0.6),
however Western Australia differed significantly from all three of
these locations (p =,0.001). Analysis of ALR3 (second highest
ranked variable) showed a significant difference among coast once
the co-variate and SCR3 were included in the model (F = 5.333,
df= 3, p = 0.01). Tukey’s post-hoc analysis showed no significant
difference between individuals from east Australia, Tasmania and
Western Australia (p =.0.1), whilst individuals from New
Zealand differed significantly from both eastern and Western Australia (p = 0.02 and 0.01 respectively). Analysis of SCL3 (third highest ranked trait) showed no significant difference among coasts once the co-variate, SCR3 and ALR3 were included in the model
(F = 0.410, df= 3, p = 0.7). Due to a non-significant result,
stepdown analysis was discontinued.
Females. No interaction between the independent variable (coast) and the co-variate (MLd) was recorded (Pillai Trace
= 1.083, F = 1.574,df= 18, 24, p =.0.1), therefore the model was
run without the interaction. No significant difference was recorded among three locations for the multivariate model based upon nine morphological traits (and MLd as co-variate) measured from 25
mature female octopods (Pillai Trace = 0.122, F = 1.989,df= 18,
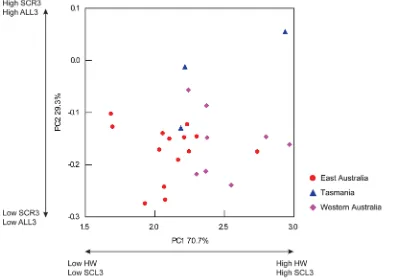
28, p = 0.05; Table 4). Visualisation of the female PC biplot showed overlap of individuals from east Australia, Tasmania and Western Australia along PC1 and PC2, which were primarily driven by HW/SCL3 and SCR3/ALL3 respectively (Figure 5). Although non-significant, female individuals from Western Aus-tralia generally possessed greater HW and SCL3 in relation to individuals from east Australia.
DFA showed a significant difference among individuals from east Australia, Tasmania and Western Australia (Pillai Trace =
0.678, F = 5.637, df= 4, 44, p =,0.01). DFA assigned 93%
[image:5.612.61.552.66.361.2]group, whilst 7% (n = 1) were placed into the Western Australian group (Table 5). 67% of individuals from Tasmania (n = 2) were placed into the correct group, whilst 33% (n = 1) were considered to belong to the east Australian group. 38% (n = 3) of female individuals from Western Australia were correctly assigned, whilst 50% (n = 4) and 12% (n = 1) were assigned to east Australian and Tasmanian groups respectively.
Discussion
Species level relationships
The main focus of this study was to resolve the taxonomic status of the Australasian tetricus complex. Molecular and morphological results are consistent with the hypothesis that disjunct populations
ofOctopus tetricusfrom Australia’s east coast (including Tasmania),
and from Western Australia are separate species. In addition,
findings of this study support the hypothesis thatO. gibbsiof New
Zealand is synonymous with east Australian O. tetricus [2].
Consequently, we propose that the species name O. gibbsi be
considered a junior synonym ofO. tetricusGould, 1852, and will
hereafter be included in reference toO. tetricus.
In the present study, interspecific variation of COI between
easternOctopus tetricusand westernO.cf.tetricuswas over one order
of magnitude (,18 times) greater than intraspecific variation
within each of these populations; a marked ‘barcoding gap’
consistent with the ‘ten times rule’ of Hebertet al., [48]. This study
estimated interspecific divergence of COIsequences between O.
tetricus and O. cf. tetricus to be 3.4%, similar to congeneric
differences previously reported for octopods [49,50]. For example, within the family Octopodidae interspecific variation was found to
be 1–2% and 2–3.3% for the octopod generaPareledone[51] and
Thaumeledone [49] respectively. The interspecific variation found
betweenO. tetricusandO.cf.tetricus(3.4%) displayed higher
species-level differentiation than the 1.3% divergence recommended by
Undheim et al., [50] for O. vulgaris. Low nucleotide sequence
divergence between octopod species in this and previous studies contrasts with higher levels recorded among moths, butterflies and birds, which range from 5.8–9.1% [48,52,53].
GMYC analysis suggested Western AustralianOctopuscf.tetricus
is a distinct species from O. tetricus, as well as supporting the
synonymy of O. gibbsiwithO. tetricus. However, GMYC analysis
detected a second cryptic Western Australian species, which conflicts with the phylogenetic and morphological results of this study (which show no such cryptic speciation). This may be due to gaps in knowledge (i.e. more species exist than is currently known), although more likely reflects the tendency for GMYC analyses to ‘over-split’ taxa [35].
Talaveraet al., [35] investigated the ability of GMYC analysis to
delineate species using the well resolved European butterflies. Their analysis revealed 16 unexpected cryptic species, which (although the authors acknowledged that at least some of these cryptic species may represent real entities) was considered to be a failure of the model due to the high levels of intraspecific variability recorded within butterflies. As interspecific variability
betweenOctopuscf.tetricusandO. tetricuswas far greater relative to
the low intraspecific variability within each individual group (see above), the discovery of a second cryptic Western Australian species is considered likely to be an artefact of ‘over-splitting’ by GMYC analysis.
Multivariate morphological analyses showed congruence in detecting significant differences between individuals from east Australia/New Zealand and Western Australia; although females appear to be a less reliable morphological discriminator of species identity. Male morphology was able to successfully discriminate
[image:6.612.60.551.60.303.2]betweenOctopus tetricusandO.cf.tetricus. Sucker numbers on the
Figure 3. Generalised Mixed Yule Coalescent (GMYC) Bayesian topology depicting the phylogenetic relationships of Octopus tetricus (east Australia and Tasmania),O. cf. tetricus (Western Australia) andO. gibbsi (New Zealand). Analysis is based on three concatenated partial mitochondrial genes (COI,COIIIandCytb). Three species clades were supported via GMYC analysis; East Australia and New Zealand (red) and Western Australia (purple and black). Node labels reflect locations represented by individuals contributing to node (Western Australia, 1 = Mandurah, 2 = Woodman’s Point, 3 = Albany, 4 = Cape Le Grand, 5 = Esperance; East Australia, 1 = Wallaga Lake, 2 = Port Stephens, 3 = Narooma).
males third right arm explained the most variation betweenO.
tetricus and O. cf. tetricus, with O. cf. tetricus having significantly
greater sucker numbers. Males third right arms (left in some species) possess the hectocotylus, a copulatory organ used to pass sperm to the female during mating. The hectocotylus is comprised of the ligula and calamus, which provide a limit to the emergence of new suckers at a relatively early stage of ontogeny [54]. Toll [54] investigated sucker counts on the males hectocotylised arm (HASC) among 12 species of the sub-family Octopodinae, and demonstrated its value in identification and delimitation of otherwise morphologically similar octopods. Toll [54] showed sucker numbers on the hectocotylised arm to be relatively fixed, with different species appearing to be characterised by a narrow range of values for HASC, which he proposed were genetically defined. This assumption appears to be supported by congruence between molecular and HASC data obtained in this study. Consistency of sucker counts despite fixation, preservation [54] or environmental influence further reinforces the usefulness of male HASC in cryptic cephalopod taxonomy.
Biogeographic factors
Speciation betweenOctopus tetricusandO.cf.tetricusis likely the
result of reproductive isolation due to allopatric eastern and
western distributions. Divergence of O. tetricus (east Australian,
Tasmania and New Zealand populations) andO.cf.tetricus(from
Western Australia) were estimated to have occurred somewhere within the last 3.2–6.9 million years. This coincides with cooling of the previously tropical Miocene seas along the southern Australian coastline and the rising of the Bassian Isthmus (a historic land-bridge joining Tasmania and mainland Australia) during the Pliocene era, potentially dividing populations of a common tetricus complex ancestor in two. Glacial-interglacial epochs during the early Pleistocene resulted in northward progression of cooler waters, initiating the retreat of numerous wide-spread subtropical species along the eastern and western coasts, isolating populations which allowed for genetic differentiation to commence [55].
More recently oceanographic, climatic and ecological factors have likely maintained contemporary disjunction following the final inundation of the Bassian Isthmus 14,000 years ago. For example, the southern coast of Australia possesses extensive expanses with limited reef habitat in the Great Australian Bight and east of Wilson’s Promontory in south-east Victoria. Limited reef habitat has been proposed as a factor in genetic divergence of populations and speciation events in other southern marine taxa such as decapods, echinoderms [56,57], and gastropods [58,59].
However studies conducted on O. gibbsi (treated as O. tetricus)
among reefs in Northern New Zealand found reef habitat was not
essential for successful settlement [17], andO. tetricus were often
found in lairs within sandy bottomed estuaries along the southern coast of New South Wales (M. Amor, personal observation). The Great Australian Bight is also associated with sharp drops in sea surface temperature (SST), which is a likely explanation for maintenance of allopatric distributions between east and west taxa. The absence of significant genetic differentiation between New
Zealand and east AustralianOctopus tetricus populations suggests
ongoing gene flow across the Tasman Sea; a 2000 km wide marine body separating the two landmasses. Due to the benthic
shallow-water habit ofOctopus tetricusadults [15], connectivity between New
Zealand and east Australian populations is likely attributable to trans-Tasman dispersal during the planktonic larval stage;
although adults of the genusOctopuscan raft on floating wood or
drifting macroalgae [60], which may function as a rare mode of passive trans-Tasman migration.
Table
2.
Cont.
Catalogue
#
Institution
Location
MLd
MW
HW
AW
SDn
WD
ALL3
ALR3
SDeL2
SDeL3
SDeR2
SDeR3
SCL3
SCR3
LL
CL
TOL
F200327
MV
Western
Australia
111.7
6
6.6
52.2
22.9
12.6
98
458
4
26
17.3
15.8
15.4
1
4.9
283
192
4.4
1.6
13.5
F200329
MV
Western
Australia
114.2
7
4.6
56.4
30.3
13.1
96
381
3
84
17.9
15.6
1
5
1
5.5
230
177
4.6
2.4
14.7
F200328
MV
Western
Australia
163.4
8
3.5
65.8
34.3
14.1
107
5
59
544
17.3
15.8
15.4
1
4.9
291
218
3.9
1.7
26.8
F200326a
M
V
Western
Australia
127
6
8
5
4
2
5.7
12.4
127
3
65
520
17.6
16.5
1
7
1
6.1
217
207
5
2.1
11.9
Missing
d
ata
(shown
in
bold)
has
b
een
replaced
by
the
global
m
ean
of
the
respective
trait.
Institutions
–
AM
=
Australian
Museum,
Sydney,
MV
=
Museum
V
ictoria.
doi:10.1371/journal.pone.
A number of other southern Australasian marine taxa display similar trans-Tasman genetic homogeneity, including the southern
rock lobster,Jasus edwardsii[61,62,63] and morwong
(cheilodacty-lid) fishes [64,65]. Planktonic larval durations (PLD) for the Octopodinae appear much shorter (35–60 days; reviewed in
Villanueva, [66]) than those of the lobsterJ. edwardsii(2 years [67])
and cheilodactylid fishes (1 year [68]).Octopusparalarvae appear to
be active and often constant swimmers [13,69], potentially facilitating dispersal within surface currents. However, simulation based oceanographic modelling studies suggests that in the absence of rafting, a period of several months is required for even a low probability of successful trans-Tasman dispersal [70]. Octopod paralarvae have been observed rafting on macroalgal and other drift debris [71], which may function as habitat for post-settlement juveniles until arrival at suitable shallow-water habitat. Additionally, paralarvae of some octopods can delay settlement in the absence of suitable habitat [72]. These ‘super-paralarvae’ obtain larger sizes and more developed swimming capabilities, while retaining paralarval morphological characters (reviewed in
Villanueva and Norman, [69]), and may facilitate trans-Tasman
dispersal for Octopus tetricus. Further investigation into
physiolog-ical, behavioural and ecological aspects of paralarval life histories
would further our understanding of the dispersive capabilities ofO.
tetricus.
Evidence of range shifts and implications of climate change
This study is the first to verify the presence ofOctopus tetricusin
the temperate waters off Flinders Island, Tasmania. This suggests
the southern distributional limit ofO. tetricusalong the Australian
mainland (currently recognised as Eden, New South Wales) is
underestimated and requires resurveying, in fact O. tetricus has
[image:9.612.63.450.65.348.2]been sighted as far south as Cape Conran, Victoria (M. Amor personal observation, 2013). Temperate coastal waters in eastern Tasmania appear to be warming at approximately four times the global ocean warming average due to climate change driven strengthening of the Eastern Australian Current [73]. This has Figure 4. Principal component biplot of male individuals of the tetricus complex. X axis represents PC1 (explaining 73.6% of total variation) and is driven primarily by the SCR3 and ALR3. Y axis represents PC2 (explaining 13.7% of total variation) and is driven primarily by WD and HW.
doi:10.1371/journal.pone.0098982.g004
Table 3.Male Discriminant Function Analysis: Jackknifed classification matrix.
East Australia Tasmania New Zealand Western Australia % correct
East Australia 15 0 3 0 83
Tasmania 3 0 0 0 0
New Zealand 1 0 7 0 88
Western Australia 0 0 0 7 100
[image:9.612.62.555.639.721.2]been linked to recent range expansions of a number of sub-tropical and tropical marine species in Tasmanian waters, including 22 fish species, eastern rock lobster, leatherback turtle and two species of box jellyfish [74]. Coastal warming in Tasmania may have resulted in current temperatures exceeding the lower thermal
limits of O. tetricus paralarvae, potentially allowing population
establishment outside of their previously known range, as has been
suggested for the sea urchin Centrostephanus rodgersii [75].
Investi-gation of the potential impacts of O.tetricus range expansion on
native ecosystems and commercial fisheries should be given high priority.
Broader phylogenetic relationships
Mitochondrial DNA analyses placed the Australasian tetricus complex within a monophyletic clade along with Japanese and
ChineseOctopus vulgaris, supporting previous speculations that these
taxa are closely related [76]. The current study estimated that the
tetricus complex and Japanese/Chinese O. vulgaris arose from a
common ancestor following an ‘anti-tropical’ divergence event
that took place between ,5.4–11.7 ma. This estimated time of
divergence is consistent with mid-Miocene climatic warming and
the emergence of intervening tropical waters at lower latitudes [77]; suggesting vicariant isolation of a once common subtropical ancestor into Northern and Southern Hemisphere populations. Warming of equatorial waters during the mid-Miocene has also been implicated in trans-equatorial divergences for a number of marine taxa, especially reef fishes [78,79,80]. In addition, anti-tropical affinities between other subanti-tropical
Australasian-Japa-nese/Asian octopods have been noted. For example,Amphioctopus
kagoshimensis Ortmann, 1888 from subtropical Japan and the
morphologically indistinguishable taxon Amphioctopus cf.
kagoshi-mensisrecently discovered at similar latitudes in Australasian waters
are predicted to represent closely related relicts of a wider distributed ancestry [76]. The ability of molecular analyses to detect cryptic species suggests that future molecular work would clarify the taxonomic, phylogenetic and palaeogeographical relationships between seemingly cryptic anti-tropical cephalopod species pairs.
Paraphyletic relationships within the vulgaris complex revealed in this study directly question the purported cosmopolitan
distribution ofOctopus vulgaris,and supports hypotheses regarding
[image:11.612.57.451.63.343.2]the existence of numerous cryptic vulgaris-like species [2,76,81]. Figure 5. Principal component biplot of female individuals of the tetricus complex.X axis represents PC1 (explaining 70.7% of total variation) and is driven primarily by HW and SCL3. Y axis represents PC2 (explaining 29.3% of total variation) and is driven primarily by SCR3 and ALL3. doi:10.1371/journal.pone.0098982.g005
Table 5.Female Discriminant Function Analysis: Jackknifed classification matrix.
East Australia Tasmania Western Australia % correct
East Australia 13 0 1 93
Tasmania 1 2 0 67
Western Australia 4 1 3 38
[image:11.612.65.554.652.721.2]Norman and Kubodera [76] previously suggested the possibility of an Asian vulgaris-like species ranging from Taiwan to Japan that
was distinctly separate from genuine O. vulgaris, originally
described from the Mediterranean Sea and Atlantic Ocean. Findings of this study support this theory of speciation between Atlantic and Pacific vulgaris-like species. However, the results of this study were based on samples from extremes in the distribution
ofO. vulgaris. Future work aimed at resolving the taxonomy of this
species complex should include individuals from a representative
range of the entireO. vulgarisdistribution.
Conclusions and future directions
This study is the first attempt to resolve the taxonomy of the
Australasian Octopus tetricus species complex. Molecular and
morphological results support east Australian Octopus tetricusas a
distinct species from Western Australian O. cf. tetricus, which
requires future formal taxonomic description. Additionally, New
Zealand’s O. gibbsi was found to be synonymous with east
Australian and Tasmanian O. tetricus. Paraphyletic relationships
within the Octopus vulgaris complex revealed in this study adds
support to hypotheses regarding the existence of numerous cryptic
vulgaris-like species, warranting taxonomic revision of the O.
vulgaris species complex to aid in the management of this
significant global marine resource.
Supporting Information
File S1 Supporting tables.Table S1, Specimen information for individuals of which molecular sequencing was undertaken during the present study. Table S2, Specimen information for individuals accessed via GenBank for use in the present study. Table S3, Specimen information for individuals of which morphological traits were recorded during the present study. Table S4, Canonical correlation (CC) output for male octopod multivariate analysis. Table S5, Canonical loadings (CL) output for male octopod multivariate analysis. Table S6, Principal components (PC) calculated from canonical correlation and canonical loading outputs from male octopod multivariate
analysis. Table S7, Eigenvalues and principal component (PC) variance contribution outputs from male octopod multivariate analysis. Table S8, Ranked canonical loadings (CL) from male octopod multivariate analysis; based upon contribution to principal components (PC). Table S9, Canonical correlation (CC) output for female octopod multivariate analysis. Table S10, Canonical loadings (CL) output for female octopod multivariate analysis. Table S11, Principal components (PC) calculated from canonical correlation and canonical loading outputs from female octopod multivariate analysis. Table S12, Eigenvalues and principal component (PC) variance contribution outputs from female octopod multivariate analysis. Table S13, Timing of
divergence estimates (Tamura-Nei genetic distance) for Octopus
tetricus(East Australia and New Zealand) andO.cf.tetricus(Western
Australia). Table S14, Timing of divergence estimates (Tamura-Nei genetic distance) for the Australasian tetricus complex and
Japanese/Chinese representatives of theOctopus vulgarisgroup.
(DOCX)
Acknowledgments
We thank Michelle Guzik (University of Adelaide, South Australia), Stephen Leporati (Fisheries and Marine Research Laboratories, Western Australia) and Alvaro Roura (Institute of Marine Research, Spain) for providing tissue samples. We thank Jorge Ramos Castillejos (University of Tasmania) for providing tissue samples and whole specimens. We thank Julian Finn (Museum Victoria) for historical collection of samples and project support, and Dave Staples and Chris Rowley (Museum Victoria) for their valued assistance in working with the museum’s cephalopod collection. We thank Ira Cooke (La Trobe University, Victoria) and Keyne Monro (Monash University, Victoria) for their assistance with statistical analyses. The quality of this manuscript was greatly improved by the comments and suggestions of two anonymous reviewers.
Author Contributions
Conceived and designed the experiments: JS MA MN. Performed the experiments: MA HC. Analyzed the data: MA HC. Contributed reagents/ materials/analysis tools: JS MA MN. Wrote the paper: MA HC JS MN. Morphological data collection: MA HC.
References
1. Carlini DB, Young RE, Vecchione M (2001) A Molecular Phylogeny of the Octopoda (Mollusca: Cephalopoda) Evaluated in Light of Morphological Evidence. Mol Phylogen Evol 21: 388–397.
2. Norman M, Hochberg G (2005) The current state of octopus taxonomy. Proceedings of the International Workshop and Symposium of Cephalopod International Advisory Council, Phuket, 2003 Phuket Marine Biological Center Special Publication 66: 127–154.
3. Guzik MT, Norman MD, Crozier RH (2005) Molecular phylogeny of the benthic shallow-water octopuses (Cephalopoda: Octopodinae). Mol Phylogen Evol 37: 235–248.
4. FAO (2009) Global Production Statistics 2007. Available: http://www.fao.org/ figis/servlet/TabSelector.
5. Acosta-Jofre MS, Sahade R, Laudien J, Chiappero MB (2012) A contribution to the understanding of phylogenetic relationships among species of the genus Octopus (Octopodidae: Cephalopoda). Scientia Marina 76: 311–318. 6. Edgar G (2000) Australian Marine Life: The Plants and Animals of Temperate
Waters (Revised Edition). Sydney, Australia: Reed New Holland. 544 p. 7. Nottage JD, West RJ, Montgomery SS, Graham K (2007) Cephalopod diversity
in commercial fisheries landings of New South Wales, Australia. Rev Fish Biol Fish 17: 271–281.
8. Norman MD, Finn JK, Hochberg FG (2014) Family Octopodidae. In P. Jereb, C.F.E. Roper, M.D. Norman & J.K. Finn eds. Cephalopods of the world. An annotated and illustrated catalogue of cephalopod species known to date. Volume 3. Octopods and Vampire Squids. FAO Species Catalogue for Fishery Purposes. No. 4, Vol. 3. Rome, FAO. pp. 36–215.
9. REDMAP (2011). Available: http://www.redmap.org.au/species/view/267/ gloomy-octopus/.REDMAP. Accessed 2012 February 28.
10. Roper CFE, Sweeney MJ, Nauen CE (1984) FAO Species Catalogue. Volume 3. Cephalopods of the World: An Annotated and Illustrated Catalogue of Species of Interest to Fisheries. FAO Fisheries Synopsis. 3: 1–277.
11. Joll LM, editor (1983)Octopus tetricus. New York: Academic Press. 325–334 p.
12. Joll LM (1976) Mating, egg-laying and hatching ofOctopus tetricus(Mollusca, Cephalopoda) in laboratory. Mar Biol 36: 327–333.
13. Joll LM (1977) Growth and food intake ofOctopus tetricus(Mollusca, Cephalopoda in aquaria. Australian Journal of Marine and Freshwater Research 28: 45–56. 14. Joll LM (1978) Observations on embryonic development of Octopus tetricus
(Mollusca, Cephalopoda). Australian Journal of Marine and Freshwater Research 29: 19–30.
15. Norman MD (2000) Cephalopods: A World Guide. Hackenheim, Germany: ConchBooks. 318 p.
16. O’Shea S (1999) The Marine Fauna of New Zealand: Octopoda (Mollusca: Cephalopoda): NIWA Biodiversity Memoir. 280 p.
17. Anderson TJ (1997) Habitat selection and shelter use byOctopus tetricus. Mar Ecol Prog Ser 150: 137–148.
18. Donnan Laboratories (2001) Extraction of DNA from tissue: High salt method. Version 1.0. School of Biological Sciences, University of Liverpool, L69 7ZD. UK. Available: http://www,genomics.liv.ac.uk/animal/research/isolation.pdf. Accessed 2011 January 25.
19. Simon C, Paabo S, Kocher TD, Wilson AC (1990) Evolution of mitochondrial ribosomal-RNA in insects as shown by the polymerase chain-reaction. Molecular Evolution 122: 235–244.
20. Folmer O, Black M, Hoeh W, Lutz R, Vrijenhoek R (1994) DNA primers for amplification of mitochondrial Cytochrome C Oxidase subunit from diverse metazoan invertebrates. Mol Mar Biol Biotechnol 3: 294–299.
21. Allcock AL, Strugnell J, Johnson M (2008) How useful are the recommended counts and indices in the systematics of the Octopodidae (Mollusca: Cephalopoda). Biol J Linn Soc 95: 205–218.
23. Larkin MA, Blackshields G, Brown NP, Chenna R, McGettigan PA, et al. (2007) Clustal W and Clustal X version 2.0. Bioinformatics 23: 2947–2948. 24. Posada D (2008) jModelTest: Phylogenetic model averaging. Mol Biol Evol 25:
1253–1256.
25. Akaike H (1974) A new look at the statistical model identification. IEEE Transactions on Automatic Control 19: 716–723.
26. Guindon S, Dufayard JF, Lefort V, Anisimova M, Hordijk W, et al. (2010) New algorithms and methods to estimate Maximum-Likelihood phylogenies: Assessing the performance of PhyML 3.0. Syst Biol 59: 307–321.
27. Ronquist F, Huelsenbeck JP (2003) MrBayes 3: Bayesian phylogenetic inference under mixed models. Bioinformatics 19: 1572–1574.
28. Rambaut A, Drummond AJ (2003) Tracer 1.3 Oxford University. Available: http://tree.bio.ed.ac.uk/software/tracer.
29. Tamura K, Peterson D, Peterson N, Stecher G, Nei M, et al. (2011) MEGA5: Molecular Evolutionary Genetics Analysis using Maximum Likelihood, Evolutionary Distance, and Maximum Parsimony Methods. Mol Biol Evol 28. 30. Tamura K, Nei M (1993) Estimation of the number of nucleotide substitutions in the control region of mitochondrial DNA in humans and chimpanzees. Mol Biol Evol: 512–526.
31. Strugnell JM, Watts PC, Smith PJ, Allcock AL (2012) Persistent genetic signatures of historic climatic events in an Antarctic octopus. Mol Ecol 21: 2775– 2787.
32. Pons J, Barraclough TG, Gomez-Zurita J, Cardoso A, Duran DP, et al. (2006) Sequence-Based Species Delimitation for the DNA Taxonomy of Undescribed Insects. Syst Biol 55: 595–609.
33. Drummond A, Suchard M, Xie D, Rambaut A (2012) Bayesian phylogenetics with BEAUti and the BEAST 1.7. Mol Biol Evol 29: 1969–1973.
34. Monaghan MT, Wild R, Elliot M, Fujisawa T, Balke M, et al. (2009) Accelerated Species Inventory on Madagascar Using Coalescent-Based Models of Species Delineation. Syst Biol 58: 298–311.
35. Talavera G, Dinca˘ V, Vila R (2013) Factors affecting species delimitations with the GMYC model: insights from a butterfly survey. Methods in Ecology and Evolution: n/a-n/a.
36. Ezard T, Fujisawa T, Barraclough T (2009) Splits: Species’ Limits by Threshold Statistics. R package version 1.0. Available: http://R-Forge.R-project.org/ projects/splits/.
37. Team RDC (2008) R: A language and environment for statistical computing. R Foundation for Statistical Computing. Vienna, Austria. ISBN 3-900051-07-0. Available: http://www.R-project.org.
38. Voight JR (1995) Sexual dimorphism and niche divergence in a mid-water octopod (Cephalopoda: Bolitaenidae). Biological Bulletin 189: 113–119. 39. Voight JR (1991) Enlarged suckers as an indicator of male maturity in octopus.
Bull Mar Sci 49: 98–106.
40. Iribarne OO (1991) Life history and distribution of the small south-western Atlantic octopus,Octopus tehuelchus. J Zool 223: 549–565.
41. Norman MD, Sweeney MJ (1997) The shallow-water octopuses (Cephalopoda: Octopodidae) of the Philippines. Invertebr Taxon 11: 89–140.
42. Systat Software, Inc. (2009) Systat, Version 13. Available: www.systat.com. 43. Berner D (2011) Size correction in biology: how reliable are approaches based
on (common) principal component analysis? Oecologia 166: 961–971. 44. Voight JR (1991) Morphological variation in octopod specimens - reassessing the
assumption of preservation-induced deformation. Malacologia 33: 241–253. 45. Quinn G, Keough M (2002) Introduction to Multivariate Analyses. In:
Experimental Design and Analysis for Biologists. New York: Cambridge University Press.
46. Roy SN, Bargmann RE (1958) Tests of multiple independence and the associated confidence bounds. The Annals of Mathematical Statistics: 491–503. 47. Quinn G, Keough M (2002) Experimental Design and Analysis for Biologists.
New York: Cambridge University Press. 557 p.
48. Hebert PDN, Stoeckle MY, Zemlak TS, Francis CM (2004) Identification of birds through DNA barcodes. PLoS Biol 2: e312.
49. Strugnell JM, Collins MA, Allcock AL (2008) Molecular evolutionary relationships of the octopodid genusThaumeledone(Cephalopoda: Octopodidae) from the Southern Ocean. Antarct Sci 20: 245–251.
50. Undheim EAB, Norman JA, Thoen HH, Fry BG (2010) Genetic identification of Southern Ocean octopod samples using mtCOI. C R Biol 333: 395–404. 51. Allcock AL, Strugnell JM, Prodohl P, Piatkowski U, Vecchione M (2007) A new
species of Pareledone (Cephalopoda: Octopodidae) from Antarctic Peninsula Waters. Polar Biol 30: 883–893.
52. Hebert PDN, Cywinska A, Ball SL, DeWaard JR (2003) Biological identifica-tions through DNA barcodes. Proceedings of the Royal Society of London Series B-Biological Sciences 270: 313–321.
53. Moore WS (1995) Inferring phylogenies from mtDNA variation - mitochondrial-gene trees versus nuclear-mitochondrial-gene trees. Evolution 49: 718–726.
54. Toll R (1988) The use of arm sucker number in Octopodid systematics (Cephalopoda: Octopoda). Am Malacol Bull 6: 207–211.
55. Wilson B, Allen G (1987) Major components and distribution of marine fauna. pp 43–68in: Dyne, G.R. & Walton, D.W. (eds.)Fauna of Australia: Volume 1A: General articles. Canberra: Australian Government Publishing Service. 56. O’Hara TD, Poore GCB (2000) Patterns of distribution of southern Australian
marine echinoderms and decapods. J Biogeogr 27: 1321–1335.
57. O’Loughlin P, Waters JM, Roy MS (2003) A molecular and morphological of the asterinid,Patiriella gunnii(Gray) (Echinodermata: Asteroidea). Mem Mus Vic 60: 181–195.
58. Dartnall A (1974) Littoral biogeography:Biogeography and ecology in Tasmania(ed. by W.D. Williams). The Hague: Dr. Junk.
59. Waters JM, King TM, O’Loughlin PM, Spencer HG (2005) Phylogeographical disjunction in abundant high-dispersal littoral gastropods. Mol Ecol 14: 2789– 2802.
60. Thiel M, Gutow L (2005) The ecology of rafting in the marine environment. II. The rafting organisms and community. Oceanography and Marine Biology an Annual Review 43: 279–418.
61. Brasher DJ, Ovenden JR, Booth JD, White RWG (1992) Genetic subdivision of Australian and New Zealand populations of Jasus verreauxi (Decapoda, Palinuridae) - Preliminary evidence from the mitochondrial genome. N Z J Mar Freshwat Res 26: 53–58.
62. Ovenden JR, Brasher DJ, White RWG (1992) Mitochondrial DNA analyses of the red rock lobsterJasus edwardsiisupports an apparent absence of population subdivision throughout Australasia. Mar Biol 112: 319–326.
63. Booth JD, Ovenden JR (2000) Distribution ofJasus spp. (Decapoda: Palinuridae) phyllosomas in southern waters: implications for larval recruitment. Mar Ecol Prog Ser 200: 241–255.
64. Grewe PM, Smolenski AJ, Ward RD (1994) Mitochondrial DNA diversity in jackass morwong (Nemadactylus macropterus: Teleostei) from Australian and New Zealand waters. Can J Fish Aquat Sci 51: 1101–1109.
65. Burridge CP, Smolenski AJ (2003) Lack of genetic divergence found with microsatellite DNA markers in the tarakihiNemadactylus macropterus. N Z J Mar Freshwat Res 37: 223–230.
66. Villanueva R (1995) Experimental rearing and growth of planktonic Octopus vulgaris from hatching to settlement. Can J Fish Aquat Sci 52: 2639–2650. 67. Booth JD, Phillips BF (1994) Early life history of spiny lobster. Crustaceana 66:
271–294.
68. Burridge CP (1999) Molecular Phylogeny of Nemadactylus and Acantholatris (Perciformes: Cirrhitoidea: Cheilodactylidae), with Implications for Taxonomy and Biogeography. Mol Phylogen Evol 13: 93–109.
69. Villanueva R, Norman MD (2008) Biology of the planktonic stages of benthic octopuses. Oceanography and Marine Biology: An Annual Review, Vol 46. Boca Raton: Crc Press-Taylor & Francis Group. pp. 105-+.
70. Chiswell SM, Wilkin J, Booth JD, Stanton B (2003) Trans-Tasman Sea larval transport: Is Australia a source for New Zealand rock lobsters? Mar Ecol Prog Ser 247: 173–182.
71. Smale MJ, Buchan PR (1981) Biology ofOctopus vulgarisoff the east coast of South Africa. Mar Biol 65: 1–12.
72. Strugnell J, Norman M, Drummond A, Cooper A (2004) Neotenous origins for pelagic octopuses. Curr Biol 14: R300–R301.
73. Ridgway KR (2007) Long-term trend and decadal variability of the southward penetration of the East Australian Current. Geophys Res Lett 34: L13613. 74. REDMAP (2013). Available: http://www.redmap.org.au/region/tas/sightings/
latest/.REDMAP. Accessed 2013 February 26.
75. Ling SD, Johnson CR, Frusher SD, Ridgway KR (2009) Overfishing reduces resilience of kelp beds to climate-driven catastrophic phase shift. Proceedings of the National Academy of Sciences.
76. Norman M, Kubodera T (2006) Taxonomy and biogeography of an Australian subtropical octopus with Japanese affinities.Proceedings of the 7th and 8th symposia on collection building and natural history studies in Asia and the Pacific Rim1: 171–189. 77. Frakes I, McGowran B, Bowler J (1987) Evolution of Australian environments.
pp 1–16in: Dyne, G.R. & Walton, D.W. (eds.)Fauna of Australia: Volume 1A: General articles. Canberra: Australian Government Publishing Service. 78. Burridge CP, White RWG (2000) Molecular phylogeny of the antitropical
subgenus Goniistius(Perciformes: Cheilodactylidae:Cheilodactylus): evidence for multiple transequatorial divergences and non-monophyly. Biol J Linn Soc 70: 435–458.
79. Valentine JW (1984) Neogene marine climate trends - Implications for biogeography and evolution of the shallow-sea biota. Geology 12: 647–650. 80. White BN (1986) The isthmian link, antitropicality and american biogeography
-distributional history of the Atherinopsinae (Pisces, Atherinidae). Systematic Zoology 35: 176–194.