Assessing the Economic Impacts of the
Higher Education Innovation Fund: a
Mixed-Method Quantitative Assessment
Report for HEFCE
October 2015
About the Author
Tomas Coates Ulrichsen is a Research Associate at the Centre for Science, Technology and Innovation Policy (CSTI) at the University of Cambridge. His core research interests lie in understanding how a nation’s university base, through its linkages and partnerships with industry, can drive technological innovation, economic development and support industrial transformation.
In addition to this research, Tomas undertakes advisory work for key UK
Executive Summary
Given the fiscal pressures on government budgets, the need to demonstrate the value for money of funding programmes has never been more acute. This paper seeks to contribute to the evidence for policymakers on the economic impacts arising through the Higher Education Funding Council for England’s Higher Education Innovation Fund (HEIF) which supports university knowledge exchange.
Knowledge-based linkages that form between higher education institutions (HEIs) and private, public and third sector organisations in the wider economy and society provide an important mechanism for ensuring that investments made in the HE sector can be fully exploited. However, a range of market and system failures are known to hinder the ability of academics and their HEIs more widely to develop appropriate linkages with external users. HEIF has been shown in past evaluations to be a successful funding stream for addressing some of these failures. It importantly provides the resources and a strategic agenda to support HEIs in building the necessary capabilities and capacity to engage. Its success has partly driven the increases in knowledge exchange over the past decade, with income from such activity within English HEIs now reaching £3.13 billion (in constant 2013 prices). A trends analysis in this paper reveals that much of the recent growth in this income has been through private sector activity, with public/third sector income stagnating. This likely reflects the ongoing and intensifying programme of austerity pursued by the previous and current
governments coupled with increased opportunities emerging within industry for external knowledge partners to contribute to their innovative activities.
To assess the economic impacts arising from HEIF, the paper presents a mixed-method quantitative assessment drawing on different sources of evidence. These methods aim to explore the extent to which HEIF has led to additional KE impacts that would not have been realised in its absence. The paper builds on previous assessments of this type and uses KE income as a proxy for economic impacts arising through KE activities. Organisations in both the public and private sectors are increasingly focusing on the value of the investments they make. Therefore, assuming that organisations are not awash with spare budgets for external knowledge-based services, their expenditure at minimum represents the belief that the services being acquired will generate at least that much value to their organisation (direct, intangible, strategic etc.).
deliver higher return from HEIF investments. However, it should be noted that driving excellence in a range of KE areas that may emerge from different types of universities is recognised as important in a healthy innovation system.
The econometric model developed in this paper also allows for the exploration of the marginal effects of the funding – i.e. what a 1% increase in HEIF would deliver in terms of KE income. Using 2009-14 data and evaluated at the mean, the model suggests that an additional £1 in funding would generate an additional £7.9 in KE income. In other words, it suggests that future increases in HEIF would deliver strong value for money in terms of additional KE outcomes realised.
The model also suggests that a number of other internal and external factors play an important role in explaining the level of KE income per academic generate by HEIs through their KE activities. Key internal factors include HEIs’ research capabilities (combined quality and intensity) and the strength of incentives for KE engagement. In addition, the model also finds evidence of path dependency, with the level of activity in the previous period partly explaining current levels. The model also finds that the local industrial context within which the HEI is situated can partly explain the current level of KE income per academic generated. This is consistent with wider academic research that finds that the structure and strength of the local economy affects how an HEI contributes not least through the creation of different types of viable opportunities for engagement.
A common criticism of this method is that income is a poor proxy for impact and less research intensive HEIs are more likely to undertake KE activity which generates little or no income (and hence would not be captured by the current metrics). However, a recent evaluation of the ‘non-monetary’ impacts arising from HEIF funding1 found that high research intensive HEIs are just as
likely to engage in such activities as their less research intensive counterparts. As such, capturing additional ‘non-monetary’ KE activities would likely not significantly change the rankings of HEIs using KE income as a proxy for impact. This paper exploits the evidence provided in this recent evaluation to attempt to capture the impacts arising from KE activity for which some engagements involve monetary transactions while others do not. It exploits information about the average price paid for the former and applies it to the latter, in effect becoming a quasi ‘shadow price’. This suggests that an additional £2.6 KE income is attributable to HEIF, assessed in the year 2014.
Lastly, the models developed in this paper say less about the links between KE and teaching. This is in part due to much more data being available to distinguish research-related capabilities between different HEIs compared to teaching. Research has shown that KE can have important effects on teaching, not least through the way it influences the curriculum, enriches courses with real-world insights, and provides student opportunities. In addition, there are likely to be important synergies between teaching, research and KE, with each having effects on the other. These influences are much harder to capture through the secondary databases available.
In conclusion, through a variety of different quantitative analyses drawing on different sources of evidence, this paper has shown that HEIF funding plays a valuable and vital role in underpinning the knowledge exchange performance of the English higher education sector.
Contents
About the Author ... 2
Executive Summary ... 3
1 Introduction ... 6
2 Methodology and Data ... 7
2.1 Measuring Gross Impacts ... 8
2.1.1 Knowledge exchange income as a proxy for economic impacts ... 8
2.1.2 Capturing non-transactional knowledge exchange activity ... 9
2.2 Exploring the counterfactual ... 9
2.3 Different types of HEIs ... 10
2.4 About the data ... 10
2.4.1 Capturing knowledge exchange activity ... 10
2.4.2 Incorporating a university’s internal characteristics and resources ... 11
2.4.3 Incorporating a university’s local context ... 11
3 Trends in Knowledge Exchange in the English Higher Education Sector ... 12
3.1 Aggregate trends in knowledge exchange ... 13
3.2 Variation in knowledge exchange patterns between HEIs ... 15
4 Assessing the Impact of HEIF ... 17
4.1 Estimating additional impacts through expert judgement ... 17
4.1.1 Gross additional impacts ... 18
4.1.2 Towards measuring the efficiency of HEFCE knowledge exchange funding ... 19
4.1.3 A comment on net additionality ... 22
4.2 Estimating the impacts of HEIF using econometric modelling ... 23
4.2.1 An econometric model for explaining KE performance and the role of HEIF ... 23
4.2.2 Conceptual and econometric challenges ... 25
4.2.3 Variables, data, sample and robustness checks... 26
4.2.4 Regressions results ... 28
4.2.5 The scale of the effect of HEIF funding on KE income ... 33
4.2.6 Caveats on the econometric findings ... 34
4.3 Exploring the impacts of HEIF using a quasi-control group analysis... 35
4.4 Capturing the Impacts of Non-Transactional Knowledge Exchange Activities ... 36
4.4.1 Estimating the monetary value of non-transactional KE activities ... 36
4.4.2 Patterns of non-transactional KE and transactional KE ... 38
5 Conclusions ... 40
References ... 42
1
Introduction
This paper aims to assess the economic impacts of the Higher Education Innovation Fund (HEIF) run by the Higher Education Funding Council for England (HEFCE) arising through the knowledge exchange (KE) activities of English higher education institutions (HEIs). The paper follows previous studies in using KE income as a proxy for the economic value of KE activity. This is based on the assumption that it represents at minimum the willingness to pay by the user and a belief that that the KE service will deliver at least some value to their organisation. However, given recent criticisms of this approach, the paper explores the extent to which income is can provide a good proxy for revealing differences in KE performance between HEIs. It also attempts to capture and monetise additional benefits arising from KE activity for which there is no monetary transaction.
To achieve these aims, the paper draws on the latest available evidence to undertake a quantitative assessment of the impact of HEIF funding using three different methods: exploiting expert testimony on attribution; developing an econometric model and using this to estimate the additional impacts; and exploiting recent changes to HEIF to construct a quasi-control group analysis.
The objective of the paper is to contribute to the evidence base available to policymakers on the value of HEIF. Given that the latest, fifth round of HEIF was maintained in cash terms at
approximately £150 million over the period 2011/12 – 2014/15 – a period of significant fiscal tightening – understanding the impact of HEIF has become particularly acute2.
HEIF funding is provided to HEIs to “to support and develop a broad range of knowledge-based interactions between universities and colleges and the wider world, which result in economic and social benefit to the UK”3. These ‘knowledge exchange’ interactions go beyond traditional academic
activities and act to more directly link the academic base to potential users of knowledge in the economy and society. HEIF funding is one of the UK government’s core funding streams supporting KE within English HEIs. Since 2008/09 it has been allocated entirely by formula and for increasing periods of time, providing greater stability and flexibility of funding to HEIs (Coates Ulrichsen, 2014).
The allocation mechanism in the most recent round of HEIF (2011/12-2014/15) involved a number of important changes compared with the previous round (2008/09-2011/12). Key changes were driven by government priorities to focus on rewarding performance, and reflecting the decade of
opportunities for HEIs to experiment and learn. These changes included:
- Formula based entirely on KE income performance, removing the previous capacity element - Raising the maximum funding awarded to any HEI from £1.9 million to £2.85 million
- Raising the minimum threshold KE income which an individual HEI must earn before being allocated any HEIF
- Maximum and minimum change from previous round capped at 50 percent
The paper is structured as follows. Section 2 presents the overall methodology and datasets used. Section 3 summarises some key trends in knowledge exchange, highlighting recent developments. Section 4 presents the key findings from the different analyses of the impacts of HEIF. Section 5 concludes.
2 An additional £10 million was distributed to the top performing HEIs for the years 2013, 2014 and 2015.
2
Methodology and Data
[image:7.595.72.524.325.736.2]At the heart of any policy impact evaluation is an assessment of the additional impacts arising from the public investment. Evaluation logic frameworks have been developed to help provide a frame for capturing the different stages from investment to impact. These also guide the adjustments necessary to move from ‘gross impacts’ (the total amount of impact realised) to ‘gross additional impacts’ (adjusting for the counterfactual of what would have happened anyway in the absence of HEIF) and finally to ‘net additional impacts’ (adjusting for any displacing effects of the policy on private sector activity). A logic framework developed for HEIF (PACEC/CBR, 2009) is outlined in Figure 1. An important role of science and innovation-related policies targeting the interface between universities and the wider economy and society is bridging the cultural, organisational and behavioural gaps between academics/academic institutions and users (including firms, government agencies and other local, national and sectoral stakeholders) which result in important systems failures (Hughes et al., 2011). This issue was confronted in detail in the major 2009 evaluation of HEIF (PACEC/CBR, 2009) and is not revisited here. The paper focuses primarily on updating and improving our assessment of the additional impacts arising from HEIF.
Figure 1 Evaluation logic framework
RESOURCES /
INPUTS ACTIVITIES OUTPUTS GROSS IMPACTS
Certain resources are needed to operate your programme
If you have access to them, then you can use them to accomplish your planned activities
If you accomplish your planned activities, then you will hopefully deliver the amount of product or service that you intended
If these benefits to participants are achieved, then certain changes in organisations, communities, or systems might be expected to occur
WHAT WOULD HAVE HAPPENED ANYWAY –
DISPLACEMENT OF OUTPUTS –
NET ADDITIONAL IMPACT
=
GROSS ADDITIONAL IMPACTS
=
SUBSTITUTION OF INPUTS –
WHAT WOULD HAVE HAPPENED ANYWAY –
GROSS BEHAVIOURAL ADDITIONALITY
=
BEHAVIOURAL CHANGE
INTERMEDIATE OUTCOMES
If you accomplish your planned activities to the extent you intended, then your participants will benefit in certain ways
An important part of estimating the impacts attributable to HEIF is a monetary assessment of the scale of gross impacts, and an assessment of the extent to which these impacts are attributable in some way to HEIF (i.e. the counterfactual). Both of these tasks present significant challenges (Hughes et al., 2011, PACEC/CBR, 2009). Core to the first of these challenges is both in
[image:8.595.72.527.286.510.2]understanding the nature of the impacts arising on different groups (including internally within the HEI, and externally on the economy and society) and in estimating the monetary value of these impacts to allow for comparison and aggregation between and across impact types and HEIs. Core to the second of these challenges is findings ways to assess what would have happened in the absence of the policy investments. Again, this presents particular challenges in the case of KE funding, not least because there are no natural ‘control groups’ against which to compare a ‘target’ group for the policy investments; and limited data available in the pre-policy investment period. The paper has thus deployed multiple methods to triangulate towards a robust assessment of the impact of HEIF. The different methods are shown in Figure 2.
Figure 2 Mixed method approach for exploring the impacts of HEIF
Capturing the scale of gross impacts
Assessing the counterfactual Expert judgement on
attribution
Econometric modelling
Quasi-control groups Income as a proxy for
economic impact
Shadow prices to capture additional ‘hard to monetise’ impacts from
non-transactional KE Assessment of
the impact of HEIF funding
2.1
Measuring Gross Impacts
2.1.1 Knowledge exchange income as a proxy for economic impacts
This paper follows previous studies and uses the KE income generated by HEIs as a proxy for the gross economic impacts derived by users from their KE engagements with those institutions. It has not yet been possible to construct a robust, comparable, readily available annual measure of the economic and social impact derived from the KE activities of HEIs with external organisations. The diversity of effects on firm innovation activity has been highlighted in recent studies (e.g.
Given these challenges, the best alternative proxy indicator currently available is the amount of income received by HEIs through their KE activities. The primary assumption made here is that reasonably well governed and accountable organisations in the private, public and third sectors willing to pay for a service (here KE-related) must believe that they are deriving value from it in some way. At minimum, KE income represents implied demand for the capabilities and expertise available within universities. Standard economic theories of the firm would go further and suggest that the price paid for the service reflects the marginal contribution of that service to their organisation. Alternative theories of the firm reveal other pricing approaches which weaken this assumption somewhat. Given the complexities of spillovers, multiplier effects, supply chain effects, unexpected benefits being realised and other reasons, it is likely that KE income represents a minimum bound on the monetary value of the KE activity on the organisation. Importantly, assuming that the extent to which the price paid for different types of KE is at least proportional to its economic value (if not reflective of it), KE income can be aggregated across different mechanisms and, importantly, compared across institutions. The extent to which this assumption holds will be explored later in this paper.
2.1.2 Capturing non-transactional knowledge exchange activity
It is clear from previous work that HEIF funding supports a wide variety of KE activities, some of which are valuable but generate little direct income to the institution, or may generate benefits over the long run. As such, questions have been raised as to the extent to which the income metrics available (in the Higher Education Business and Community Interaction (HEBCI) survey) capture the breadth of KE activities, and whether the price reflected in the income secured reflects the economic value to the user, let alone the wider value to the economy and society.
This paper attempts to confront this issue by exploiting the latest evidence on the non-monetary impacts arising from HEIF-funded KE activities emerging from a recent evaluation of HEIF
(PACEC/CB2, 2015). It develops a first approximation of the monetary value of these activities using a quasi ‘shadow price’, focusing on those activities for which there is a monetary transaction in some instances and not in others. The paper also examines the extent to which the patterns of KE
engagement in ‘non-monetary’ KE activity vary between different types of HEIs. This is crucial for judging whether the amount of KE income generated by HEIs provides a good proxy for revealing differences in the scale of activity between HEIs, and hence its suitability for allocating funding.
2.2
Exploring the counterfactual
Estimating the counterfactual represents a core part of any evaluation. This paper takes as its starting point the mixed-methods approach developed in Hughes et al. (2011) for evaluating HEIF, which deploy a combination of descriptive data analysis, quasi-control groups, expert testimony, and regression analyses. This is necessary because data limitations prevent straight forward
The study deliberately draws only on secondary data to explore the key research questions. A separate case study-based evaluation of those impacts that are hard to capture and monetise arising from HEIF4 was simultaneously commissioned by HEFCE and complements this work.
2.3
Different types of HEIs
The English HE sector is characterised by a diversity of HEIs with different scales, research intensities, and disciplinary and KE specialisations. An analysis undertaken by PACEC/CBR (2009) as part of their evaluation of HEIF clustered HEIs into five groups based on a principal components analysis of a range of characteristics. A key differentiating characteristic of the different clusters is their research intensity. In addition, the specialist arts institutions were separated out as a distinct group. These clusters have been used for a number of policy studies and this study adopts this approach for consistency.
2.4
About the data
A critical part of the study was the building of a detailed, institution-level dataset bringing together a wide range characteristics on internal capabilities, resources and KE performance, and the external context within which HEIs are situated. Where possible, data was collected at the discipline level.
All income metrics in the database have been adjusted for inflation using the GDP deflator provided by HM Treasury and presented in ‘real’ terms (at constant 2013 prices). In addition, the database also adjusts for HEI mergers over time.
2.4.1 Capturing knowledge exchange activity
The primary source of data is a longitudinal dataset derived from Higher Education Business and Community Interaction (HEBCI) survey. This provides detailed, institution-level data on KE activities, strategic priorities, infrastructure, outputs, outcomes and performance. It covers key knowledge diffusion channels beyond scholarly publication and the movement of undergraduate students to include: contract and collaborative research; consultancy; provision of facilities and equipment services; provision of continuing professional development; delivery of regeneration and
development programmes; technology licensing; and new venture formation. It goes well beyond what other countries collect in this area (Coates Ulrichsen et al., 2014) and captures many of the mechanisms which involve some monetary transaction. However, many other, often non-transactional and informal KE channels are not well covered.
These different KE mechanisms can usefully be categorised into the following, based on the type of knowledge they embody:
- Research-related KE (collaborative research, contract research and technology licensing): focuses on generating new knowledge and exploiting novel technologies arising from research
- Consultancy: focuses on the exploitation and recombination of existing knowledge and know-how to address specific user needs
- Wider capability building KE (CPD, facilities & equipment, regeneration & development): focuses on building capability and capacity within users in the private, public and charitable sectors through a range of other KE mechanisms
In addition, the HEBCI survey provides other, more qualitative information on different areas of KE strategy and support infrastructure. These have been included in the database.
2.4.2 Incorporating a university’s internal characteristics and resources
This dataset has been linked to data derived from the Higher Education Statistics Agency (HESA) to provide a detailed characterisation of the scale, capabilities and resources of HEIs. Where
appropriate and feasible, this information was gathered at the discipline level. This included data on the quality and scale of research activity within different disciplines; the scale of institutions and the breakdown by different disciplines; the scale and focus of education activity (including at different undergraduate and postgraduate levels) and the types of labour produced; the scale of capital investments by the HEI; the movement of individuals between academia and industry (on a
permanent basis, not for short periods of time); and KE funding and other resources devoted to KE, research and teaching;
2.4.3 Incorporating a university’s local context
The dataset was further linked to data characterising the local economy in which the HEI is based. The ‘travel to work area’ (TTWA) was used as the geographical proxy for the local economy around an HEI. The TTWA represents the spatial area within which “at least 75% of an area's resident workforce work in the area and at least 75% of the people who work in the area also live in the area”5. The paper focuses primarily on the local industrial structure (sectors and size), with data
gathered under licence from the Office of National Statistics Business Register Employment Survey (BRES). Standard Industrial Classification (SIC) 2007 codes were aggregated into the following groups based on the European Commission’s Eurostat definition of manufacturing and services sectors:
- High technology manufacturing
- Medium-high-technology manufacturing - Medium-low-technology manufacturing - Low-technology manufacturing
- High-tech knowledge-intensive services - Knowledge intensive financial services - Other knowledge intensive services - Less knowledge intensive services - Utilities & construction
- Agriculture, forestry & fishing; mining & quarrying
5 Definition obtained from:
Key measures calculated included:
- Scale of employment by sector and size class
- Concentration of firms (based on the location quotient, horizontal cluster coefficient, and market share) by sector and size class
- Growth in employment and market share by sector and size class
[image:12.595.74.524.294.609.2]In addition, the quality of the local area was included in the database using the latest available indices of deprivation provided by the Department of Communities and Local Government. The building of the dataset is outlined in Figure 3. Finally, a proxy measuring a university’s access to global markets was estimated using the distance to major international airports. As well as use for this study, further work using this database will aim at developing more detailed clusters of HEIs that could inform future evaluations of HEIF and the creation of groups of comparable institutions for benchmarking performance.
Figure 3 Building the database
HEI Database with
local economic
characteristics
HE internal characteristics
Campus location (postcode)
TTWA Local economic
characteristics Industrial structure
Access to global markets
Wider economic / social context HE staff & students
HE knowledge exchange & economic initiatives HE research & infra
HESA Staff & students HESA DLHE
HESA FSR HEFCE REF2014 HESA Estates
HESA HEBCI Airports: websites
ONS: Distance matrix DCLG
ONS BRES / ABI
HEFCE / websites ONS HEI-Local Context Matching
HEI codes TTWA
3
Trends in Knowledge Exchange in the English Higher Education Sector
The assessment of the economic impacts emerging from HEIF funding begins with an initial
nature and scale of KE income secured, this section also establishes a useful proxy for the gross economic impacts arising through KE activities, or at least provides a minimum bound.
3.1
Aggregate trends in knowledge exchange
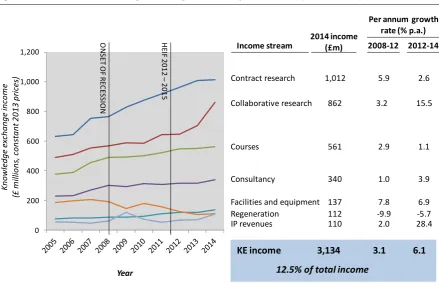
Knowledge exchange income generated by English HEIs continues to grow, increasing to £3.134 billion in 2014 (in constant 2013 prices) (Figure 4)6. This represents a growth of 8.9% in real terms
[image:13.595.76.516.239.522.2]compared with the previous year. Indeed, growth has begun to accelerate following the recession, with annualised growth over the period 2012-14 reaching 6.1% compared to 3.1% during 2008-12. KE income now constitutes 12.5% of total income to the HE sector.
Figure 4 Trends in knowledge exchange income, by mechanism (2005 – 2014)
Contract research
Collaborative research
Courses
Consultancy
Facilities and equipment
IP revenues 1,012 862 561 340 137 110 Regeneration 112 0 200 400 600 800 1,000 1,200 K n o wl ed g e ex ch a n g e in co m e (£ m ill io n s, c o n sta n t 2 0 1 3 p ri ces ) Year
Income stream 2014 income(£m)
12.5% of total income
2.6 15.5 1.1 3.9 6.9 28.4 -5.7 O N SE T O F R EC ES SIO N
Per annum growth rate (% p.a.) 2008-12 2012-14 5.9 3.2 2.9 1.0 7.8 2.0 -9.9
KE income 3,134 3.1 6.1
H EIF 2 0 1 2 – 2015
Source: HESA HEBCI surveys, author’s analysis
Annual income from contract research has topped £1 billion, albeit with growth slowing in recent years, while collaborative research increased sharply to £862 million. This perhaps reflects the growing pressures on firm R&D budgets resulting in increasing preferences for collaborative work with greater leverage of funds from each contributor. Income from the provision of continuing professional development and continuing education courses increased to £561 million, with growth slowing to 1.1% over the period 2012-14. Consultancy income grew faster in the most recent period (3.9%) compared with 2008-12 (1.0%), reaching £340 million. Income from the provision of facilities and equipment services continues to grow steadily at around 7% per annum, reaching £137 million. Lastly, income from intellectual property (IP) (including both from royalties arising from licensing of IP and from the sale of equity shares in spin-offs) rose sharply over the period 2012-14 to £110 million.
6 Note that the paper refers to the period 2011/12 as 2012; 2012/13 as 2013; 2013/14 as 2014 etc. for
The trend analysis also suggests a continuing rebalancing of KE activity from the public/charitable sectors to the private sector. This likely reflects the continuing programme of fiscal austerity imposed by the previous Coalition government restricting demand for KE from public sector
[image:14.595.75.515.203.474.2]organisations and agencies. Figure 5 presents the trends in KE income secured from different types of users. It is clear that the majority of the growth in recent years has come from the private sector, growing at over 6% per annum in the period 2012-14. This compares with just 0.3% growth in income from the public and charitable sectors.
Figure 5 Trends in knowledge exchange income, by user type (2005 – 2014)
Public/charitable sectors Collaborative research Large companies SMEs 1,129 862 626 156 0 200 400 600 800 1,000 1,200 K n o wl ed g e ex ch a n g e in co m e (£ m ill io n s, c o n sta n t 2 0 1 3 p ri ces ) Year Partner type 2014 income (£m) 0.3 15.5 6.6 6.2 O N SE T O F R E C E SS IO N 6.8 3.2 0.6 -1.5
Per annum growth rate (% p.a.)
2008-12 2012-14 HE IF 2012 – 2015
Source: HESA HEBCI surveys, author’s analysis
Figure 6 Trends in core technology transfer metrics (2005 – 2014)
0 50 100 150 200 250 0 500 1,000 1,500 2,000 2,500 3,000 3,500 4,000 4,500 5,000
IP income (excluding sale of shares) Software licences N u m b er o f lic en ces Year Variable 7.5 23.3 7.4 31.1
Per annum growth rate (% p.a.)
2008-12 2012-14 Non-software licences Software licences IP income (excluding sale of shares) IP In
co m e: £ m ill io n s, c o n sta n t 2 0 1 3 p ri ces Sp in -o ff s: n u m b
er £65 million 4,488 Value in 2014 Non-software licences -2.1 15.0 3,305
Spin-offs 107 -0.2 -12.9
Spin-offs ONSET OF RECESSION
[image:14.595.75.520.510.762.2]Source: HESA HEBCI surveys, author’s analysis
The trend analysis also points to challenges in commercialising IP, particularly through spin-offs and non-software licensing (Figure 6). The number of spin-offs generated per annum since 2010 has fallen sharply back to below the 2005 level, while the number of non-software licenses being signed has plateaued. This could be in part due to the challenges in sourcing financing for the
commercialisation of technologies during the recession and the strains on firm budgets for R&D. Software licences continue to grow, perhaps reflecting the lower costs of exploitation involved compared to non-software licenses and the high risks associated with IP-based spin-offs. Interestingly IP income from licence royalties (i.e. excluding the sale of equity shares) has grown steadily at around 7.5% per annum since 2008, reaching £65 million. While this represents a fraction of the income universities secure from other forms of KE, it does provide important evidence that university-based IP is being exploited and deployed, generating economic value in the marketplace.
3.2
Variation in knowledge exchange patterns between HEIs
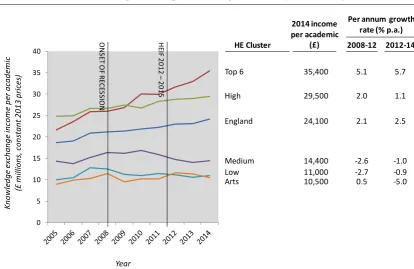
[image:15.595.86.501.447.716.2]There is important variation in KE income trends for different HEI groups. Using the PACEC/CBR KE clusters, (which are largely focused on research as the predominant differentiator), the analysis reveals the continued rapid growth in KE income per academic full time equivalent staff generated by the top 6 research intensive HEIs in England. In addition, KE income per academic generated by the high research intensive cluster continues to grow, albeit at a slower rate than the top 6. The less research intensive clusters experienced a marked slowdown during the period 2008-12 with their income per academic continuing to reduce, albeit at a slower rate. All of this points to a growing divergence in performance between the top 6 and the other HE groups.
Figure 7 Trends in knowledge exchange income, by HE cluster (2005 – 2014)
Top 6 High Medium Low Arts 35,400 29,500 14,400 11,000 10,500 0 5 10 15 20 25 30 35 40 K n o wl ed g e ex ch a n g e in co m e p er a ca d em ic (£ m ill io n s, c o n sta n t 2 0 1 3 p ri ces ) Year HE Cluster 2014 income per academic (£) 5.7 1.1 -1.0 -0.9 -5.0 O N SE T O F R EC ES SIO N
Per annum growth rate (% p.a.)
2008-12 2012-14 5.1 2.0 -2.6 -2.7 0.5 H EIF 2012 – 2015
England 24,100 2.1 2.5
However, the above analysis of aggregate KE income per academic masks important differences for different KE mechanisms (Table 1). While the research intensive HEIs – unsurprisingly – generate by far the most KE income per academic for the research-related KE mechanisms (contract and
[image:16.595.74.541.211.395.2]collaborative research and licensing activity), those in the less research intensive groups generate higher than average income for CPD. The amount of income per academic secured through the provision of consultancy services, facilities and equipment services and support for regeneration is more evenly spread across HEI groups.
Table 1 Level of KE income per academic by mechanism for each HEI cluster, 2014
KE mechanism All Research intensity cluster
Top 6 High Medium Low Arts
Contract research 7.8 16.1 9.8 2.0 1.2 0.2
Collaborative research 6.6 10.6 9.4 2.7 1.2 0.7
CPD and CE 4.3 3.3 3.6 5.3 4.9 6.0
Consultancy 2.6 2.3 3.3 2.5 1.7 1.4
Facilities and equipment related services 1.1 0.9 1.5 0.6 0.9 1.0
Regeneration and development
programmes 0.9 0.0 1.0 1.2 1.0 1.1
IP (including sale of shares) 0.8 2.2 0.8 0.2 0.0 0.1
Total 24.1 35.4 29.5 14.4 11.0 10.5
Number of academics, 2014 992 4,760 1,449 949 530 170
Constant 2013 prices
Source: HESA HEBCI surveys, author’s analysis
In addition, it is instructive to explore the ‘specialisation’ of HEIs in different types of KE. Figure 8 shows the ‘footprint’ of KE activity for the different HE groups (based on the percentage each mechanism contributes to total KE income). This emphasises the importance of CPD for medium and low research intensive HEIs as well as for the arts specialists, while research-related activity dominates income for the top 6 and high groups. This diversity of focus and specialisation in different types of KE reflects the different types of HEIs in the innovation system. Indeed it is increasingly well recognised that a healthy innovation system requires a diversity of HEIs
Figure 8 Knowledge exchange ‘footprints’ for different types of HEIs, 2014
0.0 10.0 20.0 30.0 40.0 50.0 60.0
Contract research
Collaborative research
CPD and CE
Consultancy Facilities and
equipment related services Regeneration and
development programmes
IP (including sale of shares)
1Top6 2Hi 3Med 4Low 5Arts
Scale: Proportion of KE income from each mechanism in total KE income for that cluster of HEIs Source: HESA HEBCI surveys, author’s analysis
4
Assessing the Impact of HEIF
The paper now turns to addressing its core research question, namely assessing the economic impacts arising from HEIF funding. Core to the assessment of the impact of HEIF is an estimation of the scale of the gross impacts on the target community and the counterfactual: the extent to which the impacts would have arisen in the absence of the policy investment. The previous section explored how KE income – the proxy used here for gross economic impacts from KE activity – has changed over time. This section now turns to presenting the key findings from assessing the counterfactual and hence the impact of HEIF on the realisation of these gross impacts.
4.1
Estimating additional impacts through expert judgement
The first method for estimating the additional impacts generated by HEIF exploits expert judgement provided by senior KE professionals on the attribution of different types of KE income to HEIF
4.1.1 Gross additional impacts
The above evidence allows us to estimate the overall proportion of KE income attributable to the funding across different types of KE activity and for different types of HEIs7,8. This provides an
estimate of the averagegross additional impacts arising from HEIF.
The analysis shows that approximately 33% of KE income is attributable to HEFCE KE funding (Table 2). The extent of attribution varies by type of KE activity. KE leaders believed approximately 38% of IP revenues would not have materialised in the absence of HEIF. Thirty-eight per cent of income from collaborative research, 37% from consultancy, and 35% from contract research were thought to be attributable to the funding. CPD and facilities and equipment services appear to have lower levels of attribution.
Consistent with the relatively high attribution of IP revenues to HEIF is the belief that the funding has also played a similarly important role in driving gross additional commercialisation-related activities such as disclosures, patents and licensing activity and spin-outs/start-ups. HEIs also believe that HEFCE KE funding has had a particular impact on spin-offs and start-ups.
Interestingly, the average attribution of income to HEIF funding varies to some extent between the HEI clusters. The higher research intensive institutions report approximately a third of income being attributable to the funding, while the lower research intensive group reports just over a quarter. The highest attribution is within the medium research intensity cluster, at 40%.
7 Note that those HEIs that clearly made the estimation based on the share of inputs allocated to a particular
activity were excluded from the analysis. This assumes that £1 of HEIF funding is exactly the same as £1 from any other source, which PACEC/CBR (2009) and PACEC (2012) have argued strongly is likely not to be the case.
8 The method also assumes that the attribution of income to HEIF funding remains constant over the period
Table 2 Attribution of KE income to HEIF funding, by KE mechanism and HE cluster analysed over the period 2006-14
KE mechanisms
Attribution to HEIF (% of KE income or number, as relevant)
Total Research intensity cluster
Top 6 High Medium Low Arts
Income-based metrics
Collaborative research 38 37 36 48 36 32
Contract research 35 31 35 52 30 31
Consultancy 37 39 31 49 26 35
CPD 22 24 18 25 23 22
IP revenues 38 34 42 42 41 27
Facilities and
equipment-related services 26 24 29 26 20 20
Regeneration and
development programmes 36 29 31 43 32 27
KE income 33 33 32 40 26 27
Non-monetary metrics
Disclosures 40 27 46 48 40 39
Patent applications 43 34 46 51 45 39
Licenses 37 38 46 31 42 37
Formal (HEI’s IP-based)
spin-offs 43 31 41 53 47 33
Start-ups (new enterprises
not based on formal IP) 39 59 34 42 23 n/a
Graduate start-ups 40 59 36 39 45 36
Number of HEIs 99 6 32 33 22 6
Source: HEFCE, HEBCI, HESA, author’s analysis
4.1.2 Towards measuring the efficiency of HEFCE knowledge exchange funding
Taking the above estimates then allows us to construct a measure of the efficiency of HEIF funding. Efficiency can be thought of as the amount of output generated for a given amount of input. In the case of HEIF, this can be thought of as the amount of KE outputs generated that are attributable to HEIF per £1 of funding input. Accepting that KE income can be used as a proxy for the impact of KE activity on the user (acknowledging the caveats outlined earlier), then a measure of the efficiency is the amount of additional KE income generated relative to the investments made through the funding.
Figure 9 Gross additionality of HEIF: a cost benefit balance sheet
HEIF funding, 2006-14: £1,219 million
Other projects & initiatives Dedicated KE Staff
54%
Academic Staff
19% 28%
Allocated to (in HEIF2011-15):
KE outputs from HEIF recipients, 2006-14
Total income (£m)
Contract research Consultancy
Facilities / equipment services CPD
Regeneration / development IP revenues
Licenses
HEI and formal spin-offs Staff start-ups Graduate start-ups KE income Disclosures Patent applications In co m e m e tr ic s N o n -i n co m e m e tr ic s
Gross additionality (%)*
Total number Collaborative research 5,665
7,767 2,696 921 4,512 1,425 653 23,638 37 34 37 25 22 35 37 33 29,656 14,113 43,467 1,421 434 19,874 39 41 37 41 39 39
Gross additionality (%)*
6.4
* Based on weighted average of HEI responses to HEIF2011-15 strategies excluding those estimating additionality based on the share of inputs formed by HEIF.
Gross additional KE income per £ HEFCE KE funding, 2006-14: E&E training Research exploitation 53% Skills dev
14% 10% 10% 7% 6%
Diffusion Civic Phys. assets
Source: HEFCE, HEBCI, HESA, author’s analysis
Figure 9 updates the cost-benefit balance sheet method developed for the evaluation of HEIF funding (PACEC/CBR, 2009). Previous updates can be found in PACEC (2012) and Coates Ulrichsen (2014). It shows the range of gross KE outputs generated over the period 2006-2014, the extent of attribution of these to HEFCE KE funding, and the funding inputs provided by HEFCE during this period.
wider “non-monetised” impacts have been explored in a recent commission by HEFCE (PACEC, 2015).
[image:21.595.68.523.363.438.2]When the analysis is broken down by the different HE clusters, we find that the ratio of cumulative gross additional KE income over the period 2006-2014 to HEIF over the same period increases with research intensity. The ratio for the top 6 research intensive HEIs is 16.1; for the high research intensive cluster it is 7.0; for the medium cluster, 4.4; and for the low research intensive HEIs, it is 2.5. This finding is similar to that produced in PACEC (2012) and in the evaluation of HEFCE KE funding by PACEC/CBR (2009). Given that the attribution of KE income to HEIF funding does not vary significantly between clusters, this result is driven by the large differences in KE income generated by the research intensives compared with their relative allocation of HEIF funding. In particular, the top 6 research intensives generate over 30% of the KE income within the English HE sector, yet receive just 13% of the funding. By contrast, the high research intensity cluster generates 45% of the income and receives 46% of funding; while the medium research intensity cluster generates 14% of the income and receives 27% of the funding (this is offset by the high attribution of income to funding).
Table 3 Attribution (%) and ratio of gross additional KE income to HEFCE KE funding for the
period 2006-2014
Total Research intensity cluster
Top 6 High Medium Low Arts
Gross additionality (%) 33 30 33 39 28 24
Gross additional KE income per £ HEFCE
KE funding, 2006-2014 6.4 16.1 7.0 4.4 2.5 1.7
Source: HEFCE, HEBCI, HESA, author’s analysis
Given the large differences in efficiency between clusters, it is prudent to question whether these are the result of the method and indicators rather than underlying performance differences. As discussed throughout this paper, KE income is an imperfect measure of impact and is likely to underestimate the full economic and societal benefits arising from HEIF-funded KE (particularly for examples such as SME engagement where the ability to finance links with universities is a well recognised market failure). In addition, there are a number of KE mechanisms which do not involve monetary transactions yet lead to valuable economic and societal outcomes (student
entrepreneurship, and civic and community engagement). Data quality also likely varies across the KE mechanisms. A recent report exploring this issue at a major research university suggests that national estimates of consultancy could be underreported by as much as a factor of two (Perkmann et al., 2015). However, it is not obvious whether the above issues are ones that would
disproportionately affect one group of HEIs over another. This is explored more fully later in this paper.
Table 4 Short term estimates of gross efficiency of HEIF funding over different time periods
Time period Total
Research intensity cluster
Top 6 High Mediu
m Low Arts
Gross additional KE income per £ HEFCE KE funding
2005-07 5.8 10.2 6.5 4.5 2.9 1.7
2007-09 6.5 13.9 7.5 4.7 2.9 1.9
2009-11 6.4 19.1 7.8 4.2 2.2 1.7
2011-13 5.9 16.1 6.3 3.9 2.3 1.5
2013-14 6.4 17.1 6.5 4.1 2.5 1.5
2014 6.8 18.6 6.8 4.3 2.6 1.4
Source: HEFCE, HEBCI, HESA, author’s analysis
Two important trends emerge from Table 4. First, that the gross efficiency of HEIF funding (given the caveats noted earlier in this section) has remained relatively stable over time, with the exception of a dip during the period 2011-13. This could be due to effects of the slowdown of public and charitable sector demand for KE and the time it takes to adjust to a new demand landscape. Conducting the analysis for the most recent year suggests that a rise in gross efficiency, although one should be cautious of this result.
4.1.3 A comment on net additionality
It is important that evaluations of the impact of policies attempt to move beyond gross additionality to assess the effects on substitution and displacement of private sector activity – i.e. net
[image:22.595.107.480.458.709.2]additionality.
Figure 10 Degree of substitutability of KE activities
Contract research (original research)
Collaborative research (original research) Courses (based on original research)
Courses (training/other based on existing works)
Consultancy (deriving from original research)
Regeneration & development
Facilities and equipment services (non-specialist)
IP/licensing/patents
Spin-outs – non-codifiable knowledge Spin-outs –codifiable knowledge
Events
Facilities and equipment services (specialist)
Degree of substitutability
Low
Low Low
High
Low
High
High
Mid
Low Mid
High Low
Consultancy (based on existing methods/knowledge) High
Share of total KE income (%)
32
27
18
11
4
3
n/a n/a
n/a 4 Type of KE
Source: adapted and updated from Hughes et al. (2011)
this research, it is unlikely that the private sector would be able to easily replicate the cumulative knowledge that underpinned the research in the first place. Figure 10 shows that such activities are likely to constitute the bulk of KE activity (based on income). This follows arguments set out in Hughes et al. (2011) building on the evidence gathered in the PACEC/CBR (2009) evaluation of HEIF.
4.2
Estimating the impacts of HEIF using econometric modelling
The second approach to estimating the economic impact of HEIF funding is through the multivariate econometric modelling. This approach allows us to explore and isolate how different factors – policy-related, internal and external – influence KE performance. Through such techniques it is also possible to estimate the marginal effects of a change in policy on KE performance (proxied here by KE income), controlling for wider explanatory and contextual factors. Importantly, it also provides a useful method for exploring the counterfactual by predicting KE performance in the presence of, and the absence of, policy.
4.2.1 An econometric model for explaining KE performance and the role of HEIF
The model developed in this section focuses on attempting to determine the influence of HEIF funding in explaining differences in the economic impact arising from KE activities at different HEIs, controlling for a wide range of internal and external factors.
The current model updates and extends previous work undertaken by Coates Ulrichsen (2014) and introduces a more detailed internal characterisation of HEIs as well as exploring the influence of the local economic context within which HEIs find themselves. The model is based on the view that the potential for an HEI to contribute to the economy through KE depends critically on its internal capabilities and available resources, its strategic ambitions and culture, and viable external
opportunities. Research by Lester (2005) and others (e.g. Huggins et al., 2012) have also shown that the local economic context plays an important role in shaping the KE activities of HEIs. The following function thus guides the building of the econometric model:
Following the arguments made in this paper (and elsewhere e.g. PACEC/CBR, 2014), the key proxy for economic impact adopted in the econometric model – and hence the dependent variable – is the income secured by HEIs through their range of KE activities.
Prior work has also suggested a wide range of factors that are likely to explain differences in KE income. The policy and internal factors were discussed at length in Coates Ulrichsen (2014) and will not be repeated here. The current model builds on this in the following ways:
- More detailed characterisation of research capabilities;
- Separation of prior experience into components including scale of prior work with large companies, SMEs and public/charitable sectors;
- Separation of scale variable into different disciplines, including clinical medicine, non-clinical medicine, health and dentistry; STEM, and non-STEM;
- Inclusion of the scale of recruitment of individuals from industry, reflecting the value that industrial experience has on engagement, both in terms of engagement processes as well as social networks within industry;
- Inclusion of the scale of academics moving into industrial jobs, reflecting the potential this creates for stronger linkages into industry that could lead to additional KE activity;
- Inclusion of the scale of management functions within the HEI, to explore whether additional management functions may be required as the scale of KE activity increases
The model also explores whether the scale of different disciplines within an institution affects the economic impacts realised by HEIs through their KE activities. Many econometric models in this space normalise KE income by the number academic full time equivalent (FTE) staff, reflecting the vastly different size HEIs in the system. With much of KE output driven by academics (with support of KE professionals and others within the HEI), this measure can be thought of as the KE-related productivity of the institution. In making this transformation, studies typically then exclude scale (proxied by the number of academic FTEs at an HEI) as a potential explanatory variable. However prior work has shown that scale has an effect on both the level of KE income realised and the amount generated per academic (Coates Ulrichsen, 2014). Conceptually, one might expect such a result due to economies of scale in supporting KE e.g. large fixed costs associated with the necessary supporting KE infrastructure. In addition, network effects could be important, for example, as the number of academics engaging in KE increases, it may become easier to convince the additional academics that it is of value. There may also be informal learning effects and mentoring through larger numbers of academics engaging, which lead to increases in KE income per academic. Critical mass effects may also emerge with the larger and more valuable partnerships seeking out larger university partners that can meet a wider range of knowledge needs (e.g. because of the diversity of disciplines or types of research and training available). This would then imply that there may a scale threshold above which universities enjoy higher levels of KE income per academic.
This study also incorporates the local context within which the HEI is situated. The analysis here centres on whether the local industrial structure and the quality of the local area have any effect on the economic impacts arising through KE (i.e. the amount of KE income generated).
The following functional specification of the model thus emerges:
This leads to the general regression equation:
where is the dependent variable capturing the impacts arising from KE activity (proxied here by KE income); captures the prior experience of the HEI working with different types of organisations and is measured in the previous period; captures the policy
investment in KE; captures the scale and quality of research capabilities of the HEI;
captures the degree to which HEIs specialise in particular mechanisms of KE; captures the local industrial structure focusing on whether the HEI is located in clusters of different types of industries; and measures the quality of the local area as captured by the index of multiple deprivation. Further details on the measures used and data sources are provided in Table 5.
The general model was run for KE activity in aggregate as well as for different types of KE (both by mechanism and with different user types). The dependent variable is the relevant KE income secured per academic FTE through different KE mechanisms (research-related, consultancy, other) and with different types of users (large companies, SMEs, public/charitable organisations).
4.2.2 Conceptual and econometric challenges
There are a number of conceptual and econometric challenges that need to be addressed in the econometric modelling of the economic impacts of HEIF funding (PACEC/CBR, 2014; Coates Ulrichsen, 2014). Firstly, the dependent variable (KE income) and a number of the key explanatory variables (in particular research capabilities) are heavily skewed, with a small number of HEIs securing large proportions of the total HE system share. To overcome this, the model follows standard practice and transforms the data into logarithms. This transformation has the additional benefit as it leads to a convenient interpretation of the regression coefficients. The coefficients provide an assessment of the proportionate change in the dependent variable (e.g. KE income) as a result of a 1% change in the independent variable (e.g. HEIF funding), i.e. the elasticity of KE income on HEIF funding.
Secondly, the English HE system is characterised by HEIs of vastly different scales. To control for this, the model normalises key variables by the scale of the institution (proxied here by the number of academic FTEs at that institution). The key performance indicator (dependent variable) thus becomes KE income per academic. Importantly, the model retains the scale variables in the regression to test the effects of scale on productivity.
The third key challenge relates to the time lags associated with the economic impacts arising from KE. It is well known that a key challenge associated with assessments of the value of public R&D (and KE investments) is the long time lags involved between the creation and dissemination of knowledge and its deployment in the marketplace (Hughes and Martin, 2012). To overcome this, the model focuses on the cumulative period 2009-14. KE income, policy investments and the scale of research investments are all cumulated over this period. This helps to internalise the time lags involved. However it is inevitable that some impacts will take longer to materialise than others, particularly for more fundamental research outputs. In addition, the use of KE income as a proxy for economic impact also helps to overcome some time lag issues. Because firms (and other users) are paying for the service in advance of its deployment, it reflects a perceived impact rather than a realised impact. The one exception here is income from licensing royalties which are secured based on sales.
Another challenge for econometric analyses is coping with outliers. This is particularly relevant here as the English HE sector is diverse (heterogeneous). Some key sources of this heterogeneity are the breadth of disciplines, the type of research activity (from fundamental to more applied; from
in this dataset) in different HEIs. In exploring the data one sharp distinction quickly emerges between broad-based HEIs and specialists in particular disciplines. An exploration of outliers in initial regressions revealed that the majority were specialists in areas such as arts, agriculture, music and education. Interestingly, the nature of research and teaching/the curriculum in these areas is naturally closely engaged with the related professions and likely quite different from other
disciplines. There are econometric techniques to control for outliers such as robust regression which dampens the effects of extreme values. It is prudent to run both standard regressions and robust regressions and compare the coefficients. If outliers do not affect the model, the coefficients should be similar.
A fifth key challenge revolves around collinearity amongst the explanatory variables. Many variables of particular interest ‘move’ closely together. This can make detailed characterisation of internal and external factors difficult, while their omission can be conceptually questionable. To partly overcome this, the model uses principal components analysis (PCA) to transform and combine possibly correlated variables into a smaller set that are linearly uncorrelated while preserving a significant proportion of the overall variance (and hence effect on the dependent variable). The downside of this approach is that it can make it hard to extract out the effects of individual
explanatory factors on the dependent variable. As such, the model leaves the policy variable (HEIF) and carries out PCA on different groups of variables.
Lastly, previous work highlights the existence of heteroskedasticity in the data – i.e. non-constant variances in the error term of the regressions. While the presence of heteroskedasticity will not lead to biases in the coefficient of the variable, it will lead to biases in the variance. This will cause problems in interpreting whether or not the coefficient is truly statistically significant or not.
4.2.3 Variables, data, sample and robustness checks
[image:26.595.67.561.503.773.2]Table 5 presents the variables, their definitions and data sources used in the econometric model.
Table 5 Variable definitions and data sources
Variable category Definition Variable name Data source
KE performance (dependent variable)
Natural log of
- Cumulative KE income secured over the period 2009-14 - Cumulative research-related KE income secured over
the period 2009-14
- Cumulative consultancy KE income secured over the period 2009-14
- Cumulative wider capability-building KE income secured over the period 2009-14
- Cumulative KE income secured from large companies over the period 2009-14
- Cumulative KE income secured from SMEs over the period 2009-14
- Cumulative KE income secured from public/charitable sectors over the period 2009-14
LnKEIncome200914Ac LnKEResInc200914Ac LnKEConsultInc200914Ac LnKEWiderKEInc200914Ac LnKELarge200914Ac LnKESME200914Ac LnKEPublic200914Ac
HEBCI (HESA)
HEIF funding Natural log of cumulative funding distributed by HEFCE through the HEIF , 2009-14
LnHEIFFund200914Ac HEFCE
Prior experience Natural log of KE income secured in the previous period 2005-08
LnKEIncome200508Ac HEBCI (HESA)
Research capability
Two composite variables derived from a PCA on the following underlying variables:
- Natural log of cumulative quality-related research funding received by the HEI over the period 2009-14
resQualScale capturing the quality and scale of research
resQualBreadth capturing
- Natural log of cumulative research grants and contracts secured by the HEI over the period 2009-14
- Natural log of number of academic FTEs securing REF 4* outputs in 2014 (note that REF2014 covered the period 2008-14)
- Natural log of number of academic FTEs securing REF 4* impacts in 2014 (note that REF2014 covered the period 2008-14)
- Number of REF units of assessment within the HEI in the national top 10 for that discipline based on 4* scores
- Natural log of number of postgraduate research students
the disciplinary breadth of research excellence
People mobility Natural log of average number of staff from UK industry taking academic positions during the period 2009-13 as a proportion of total academic FTEs
LnStaffRecPracAvgAc20091 3
HESA
Natural log of average number of academics leaving to join UK industry during the period 2009-13 as a proportion of total academic FTEs
LnStaffLeavePractAvgAc200 913
HESA
Scale Two composite variables derived from a PCA on the following underlying variables:
- Natural log of number of academic staff FTEs in clinical medicine
- Natural log of number of academic staff FTEs in other medical, dentistry and health
- Natural log of number of academic staff FTEs in STEM - Natural log of number of academic staff FTEs in
non-STEM
StaffOther (non-STEM & other medicine/health) StaffMedSTEM (clinical medicine & STEM)
HESA
Incentives Strength of incentives for KE engagement as self-reported by the HEI
Incent52013 HEBCI (HESA)
Breadth of KE Concentration of KE activity in particular mechanisms. Measured by the Herfindahl-Hirschman Index (HHI) based on KE income secured through different mechanisms over the period 2009-14. HHI of 1 implies all activity takes place through one mechanism only (complete specialisation). The lower the HHI, the broader the activity of that HEI.
LnConcMechanisms200914 HEBCI (HESA)
Local industrial structure: sectoral composition
Dummy variable taking value of 1 if the local economy within which the HEI is situated is an industrial cluster for the particular industry (high/med technology manufacturing; high-tech knowledge-intensive services; financial
knowledge-intensive services; other knowledge-intensive services).
An area is defined here as a cluster if it has a location quotient (measure of relative concentration) greater than 1.5 and a significant proportion (top quartile) of the national employment in that sector. In addition, those areas with more than 3% of the national employment in that sector are also considered to be clusters of activity.
The local economy is defined by the travel-to-work area within which the HEI is situated.
ClustHTMedTManuf2013 (high/med technology manufacturing) ClustHTKIS2013 (high-tech knowledge-intensive services) ClustFinKIS2013 (financial knowledge-intensive services) ClustOtherKIS2013 (other knowledge-intensive services) Employment by sector provided by ONS BRES Definition of sectors provided by Eurostat Local industrial structure: firm size
Dummy variable taking value of 1 if the local economy within which the HEI is situated has at least a location quotient of at least 1.1 for SME (large) firm employment in high/med tech manufacturing and knowledge intensive sectors and has a significant proportion (top quartile) of total national SME (large) firm employment in those sectors.
In addition, those areas with more than 3% of the national employment are also considered to be clusters of activity.
ClustSMEHTMedMKIS (SME employment in key sectors) ClustLargeHTMedMKIS (large firm employment in key sectors) Employment by sector provided by ONS BRES Definition of sectors provided by Eurostat Quality of the
local area
Proportion of local area units in the bottom 10% nationally based on their index of multiple deprivation 2012
The initial regressions revealed that many outliers are specialist institutions in the arts, music, agriculture and social sciences. To strengthen the power of the model, these have been excluded with the analysis. This resulted in 99 institutions being included in the model. A full list of HEIs included and excluded in the model is provided in the appendix.
A number of diagnostic tests were undertaken on each regression to test their robustness. This included tests for heteroskedasticity (White’s general test for heteroskedasticity); collinearity
(variance inflation factors); model mis-specification (linktest); omitted variables (Ramsey RESET test); normality (Shapiro-Wilk test); and outliers (interquartile ranges).
4.2.4 Regressions results
The regression model was run using both Ordinary Least Squares (OLS) with robust standard errors to correct for heteroskedasticity and robust regression techniques. Given differences emerging in the coefficients between the two methods suggesting the ongoing influence of outliers, the robust regression results were preferred and are the focus of this discussion. The findings from the standard OLS regressions are provided in the appendix.
The primary model studied here focuses on the economic impacts arising from HEIF funding where the impacts are proxied by KE income per academic (Model 2.1). Variants of this model were run exploring different types of KE mechanism (research-related, consultancy, and wider capability building KE) (Models 2.2-2.4) and with different types of users (large companies, SMEs and public/charitable organisations) (Models 2.5-2.7). The results are presented in Table 6.
A number of diagnostic tests were performed on the models when run using OLS with robust