INTRODUCTION
No-take marine reserves, or areas protected from all fishing and collecting, are widely advocated and increasingly established with the goal of protecting or restoring biodiversity (Wood et al. 2008), or en -hancing fishery sustainability and yields (Pauly et al. 2002, Lubchenco et al. 2003, Mora et al. 2006). Most studies have demonstrated that effectively enforced reserves result in greater biomass of adults of exploited species inside reserves compared to similar areas open to fishing (e.g. Halpern & Warner 2002,
Watson & Munro 2004, Williamson et al. 2004, Russ et al. 2008). Commonly, the fishery-targeted species whose abundances are in creasing in reserves are carnivorous and piscivorous fishes (Roberts & Pol-unin 1991, 1993). Their increased abundance and biomass in side reserves has been shown to have cas-cading effects on the abundance, demography and behaviour of their prey (Connell 1998a, Graham et al. 2003, Ruttenberg et al. 2011), and predator recruit-ment inside reserves may be lower (Ayling et al. 1992). However, few studies have focused on the ecology of juvenile stages of these predators (but see
© Inter-Research 2012 · www.int-res.com *Email: colin.wen@my.jcu.edu.au
Evaluating the effects of marine reserves
on diet, prey availability and prey selection by
juvenile predatory fishes
Colin K. Wen
1,*, Glenn R. Almany
2, David H. Williamson
2,
Morgan S. Pratchett
2, Geoffrey P. Jones
1, 21School of Marine and Tropical Biology, James Cook University, Townsville, Queensland 4811, Australia 2ARC Centre of Excellence for Coral Reef Studies, James Cook University, Townsville, Queensland 4811, Australia
ABSTRACT: Implementation of effective no-take marine reserves almost universally results in an increase in the abundance of adult stages of exploited predatory fishes. However, the effects of reserves on the ecology of the juvenile stages of predators are unknown. Increased predation pressure from adults in reserves may not only reduce juvenile recruitment directly, but as a result of non-consumptive effects, may impact on critical aspects of their foraging behaviour, including diet and prey selection. In general, the feeding ecology of juvenile stages of large predators is poorly understood due to their relatively low abundance and cryptic behaviour. Here, we exam-ined differences between reserves and fished areas in recruit abundance, diet, prey availability, and prey selection indices for recruits and juveniles of 3 predatory fishes: Plectropomus macula-tus, Lutjanus carponotatusand Epinephelus quoyanus. Recruit abundance was similar between reserves and open areas. The diets of the 3 study species did not differ between reserves and open areas, with variation in diets largely explained by fish species and body size. At small sizes, all species consumed high numbers of shrimp, but diets diverged with growth. Overall, our results provide little evidence that more abundant predators inside reserves influence juvenile feeding ecology.
KEY WORDS: Coral reef · Predator–prey relationships · Non-consumptive effect · Marine reserves · Serranidae · Lutjanidae · Great Barrier Reef · Recruitment
Sweatman 1993, Light & Jones 1997, Kingsford 2009), and the effect of no-take reserves on the abun-dance and feeding ecology of juveniles is poorly known.
While contact between adults and juveniles may be reduced by ontogenetic shifts in habitat use that are common in predatory fishes (Ferreira & Russ 1992, Dahlgren & Eggleston 2000), adults often range across habitats and thus may still interact with juve-niles. Greater predator abundance inside no-take reserves may influence the ecology of juvenile pred-ators in a variety of ways. For example, large preda-tors may decrease juvenile abundance via direct con-sumption. Alternatively, juveniles may be indirectly influenced via nonconsumptive effects (sensu Blau -stein 1997, Lima 1998) as a result of the influence of large predators on juvenile foraging behaviour or top-down effects that ultimately affect prey availabil-ity for juvenile predators. Increased pressure from large predators has been shown to influence the for-aging behaviour of small predatory fishes (Milinski & Heller 1978, Madin et al. 2010, McCauley et al. 2010). Indirect effects may also arise as increases in herbivorous fishes alter the structure of the benthic habitat and therefore habitat availability for small fishes and invertebrates that are the prey of juvenile predators (McClanahan et al. 2000, McClanahan & Arthur 2001, O’Leary et al. 2012). In addition, the presence of large predators may influence the diets of juvenile predators and alter the timing of ontoge-netic changes in diet and behaviour (e.g. Preisser et al. 2005, Schellekens et al. 2010). As a consequence of these factors, an increase in the abundance of large predators inside reserves could produce a range of differences in prey availability and juvenile diets compared to areas outside reserves. Most stud-ies examining the diets of exploited coral reef fishes have focused on the adult stage (e.g. St John et al. 2001, Kulbicki et al. 2005), and the foraging ecology and prey consumption patterns of juveniles have re -ceived little attention (but see Kingsford 1992, Con-nell 1998b, St John 1999).
The goal of this study was to examine the effects of reserves on the foraging ecology of juvenile pre -dators, including prey availability, diets and prey selection. We focused on 3 predatory fish species —
Plectropomus maculatus (Bloch, 1790), Lutjanus carpo notatus (Richardson, 1842) and Epinephelus quoyanus (Valenciennes, 1830) — that have ex -hibited dra matic increases in adult numbers and biomass inside no-take reserves on the inner Great Barrier Reef (Williamson et al. 2004). We tested 3 hypotheses: as a result of greater predator
abun-dance inside reserves, (1) recruit abunabun-dance of the 3 study species is lower inside reserves (direct effect); (2) juveniles of the 3 species consume less prey (gut fullness) and a greater proportion of cryptic prey inside reserves (indirect effect); and (3) ontogenetic diet shifts from cryptic prey to mobile prey occur at larger sizes in reserves (indirect effect).
MATERIALS AND METHODS
Study sites and species
Sampling was conducted during the peak recruit-ment season (February to April) in 2008 and 2009 at 6 sites in the Keppel Islands region (23° 10’ S, 150° 57’ E) of the Great Barrier Reef Marine Park. Two sites were located in no-take reserves, Clam Bay (122.5 ha, protected since 2004) and Middle Island (165.5 ha, protected since 1988), and 4 sites were open to fishing (North Keppel Island, Miall Island, Humpy Island and Halfway Island). No-take reserves in the Keppel Islands region support approximately twice the density of large predatory fishes as adja-cent fished areas, and the 3 study species are the most abundant predators in this area (see Harrison et al. 2012). On the Great Barrier Reef, Plectropomus maculatus and Lutjanus carponotatus are primary targets of both recreational and commercial fisheries, whereas Epinephelus quoyanus is an incidental catch (Williams & Russ 1994). All 3 species are tar-geted in other parts of the Indo-West Pacific by recre-ational, commercial, artisanal and subsistence fishers (Sadovy 2001, Evans & Russ 2004).
The 6 sites were selected for this study based on the abundance of suitable habitat in nearshore, back-reef areas where pilot study surveys had revealed that recruits (young-of-the-year) and older juveniles of the 3 study species were most abundant. Recruits of each species were identified based on size (mm total length, TL) with reference to previous studies examining length−age relationships based on otolith analysis (Ferreira & Russ 1992, Newman et al. 2000, Mannering 2008, D. H. Williamson et al. unpubl.). For Plectropomus maculatus and Lutjanus carpono-tatus, recruits were <150 mm TL, whereas for Epi-nephelus quoyanus, recruits were <120 mm TL.
Recruit abundance
recruitment habitat at each of the 6 sites in 2009 before collecting recruits and juveniles for gut con-tent analyses. An unbalanced sampling design was used due to a limited number of no-take reserves with suitable recruitment habitat. A single observer (C.K.W.) surveyed each transect to minimize ob -server bias, and all individuals classified as recruits in surveys were much smaller than the size cutoffs re ported in the previous subsection. Adults of all 3 species were frequently observed in nearshore recruitment areas during surveys, which confirms that adults are capable of influencing juveniles. We compared only recruit abundance among reserves and open areas as we considered these individuals to be those most likely to be directly consumed by large predators. Data were Box-Cox transformed to meet the assumptions of parametric statistical tests due to the presence of zero-data on some transects (Akritas 1990). A 2-way nested ANOVA was used to test for differences in abundance be tween zones (reserve and open, fixed factor) and site (nested within Zone, random factor).
Diet
Recruits and juveniles of the 3 study species were collected from the 2 reserve sites and 2 open sites (North Keppel Island and Halfway Island) in 2008 and 2009. The 2 other open sites (Miall Island and Humpy Island) were excluded from further analyses on prey availability, diet and prey selection as sam-ple sizes from these locations were small due to the smaller areas of suitable recruitment habitat. Juve-niles were collected by divers using SCUBA, spear guns, barrier nets, hand nets and a 10:1 solution of ethanol and clove oil as anesthetic. The length of each individual was measured to the nearest mil-limeter. Sampled fishes were stored on ice for trans-port to the laboratory to minimize decomposition of gut contents, and were dissected on the day of collec-tion. The entire stomach was removed and stored in individual 10 ml containers filled with 10% seawater-buffered formalin solution to fix and preserve gut contents. Gut contents from a total of 527 Plectropo-mus maculatus, 483 Lutjanus carponotatus and 676
Epinephelus quoyanus were examined. Many of these individuals had empty guts and some had guts that contained unidentifiable prey items. Those indi-viduals that contained identifiable prey items were included in the analysis (Table 1).
Prey items from gut contents were identified visu-ally using a dissecting microscope (10×
magnifica-tion) when from small predators (< 50 mm TL) and with the unaided eye for larger predators. Taxonomic identifications of prey were made using 2 standard field guides (Gosliner et al. 1996, Allen et al. 2003). Fish prey were identified to the Family level and included the following categories: Gobiidae (gobies), Blenniidae (blennies), Pomacentridae (damselfishes), Tripterygiidae (triplefins), Serranidae (sea basses), Labridae (wrasses), Pseudochromidae (dottybacks), Scaridae (parrotfishes), Chaetodontidae (butterfly-fishes) and unidentified fish larvae. Invertebrates were identified to the Family or Order level and included the following categories: Caridea (shrimp), Brachyura (crabs), Galatheidae (squat lobsters), Alpheidae (snapping shrimp), Stomatopoda (mantis shrimp), Other Small Crustaceans (includes Isopoda, Copepoda and Amphipoda), Cephalopoda (squid and relatives), Palaemonoidea (prawns), and other invertebrates (unidentified). The numbers of each prey category were recorded from each gut content sample. Where possible, partial or half-digested prey items were identified using key morphological
fea-Preditor size Clam Middle Halfway North
(mm TL) Bay Island Island Keppel
(reserve) (reserve) (open) (open)
P. maculatus
< 50 2
50−99 2 4 24 10
100−149 18 5 17 12
150−199 4 8 5
200−249 13 2 10 8
250−299 3 5 7
>=300
L. carponotatus
< 50 2
50−99 6 7 9 7
100−149 9 9 15 9
150−199 11 4 5
200−249 3
250−299 >=300
E. quoyanus
< 50 4 2 9 4
50−99 19 13 7 6
100−149 83 19 10 19
150−199 12 6 4 5
200−249 3 2 2
250−299 2 3
[image:3.612.309.536.428.725.2]>=300 2 2
tures (i.e. head or claw). Other fragments that could not be identified were recorded as unidentified prey. We used the number of prey items rather than other metrics (e.g. proportion, volume) to facilitate direct comparisons with prey availability surveys.
We compared the proportion of samples from each site with empty guts as a measure of ‘hunger,’ which has been used to estimate levels of stress and non-consumptive effects in fishes (Arrington et al. 2002). For each study species at each site, we calculated this metric as:
(1)
and compared the results between reserves and non-reserves using one-way ANOVA.
We analysed the effects of 5 factors on the diet of the 3 species: Year (2008 and 2009), Zone (reserve and open), Site (nested within Zone; 6 sites: 2 reserve and 2 open), Species (the 3 study species) and Size (TL of each individual). The estimate of variance between years was non-significant (p = 0.34), so data were pooled across years to increase sample size and statistical power, and Year was excluded from the model (Fletcher & Underwood 2002). Each gut content sample was considered as an independent replicate. For each species, individ-uals were grouped into 3 arbitrary size classes based on the availability of sufficient samples for analysis: Plectropomus maculatus (0−99; 100−199; 200−300 mm TL), Lutjanus carponotatus (0–99; 100–149; 150−250 mm TL), Epinephelus quoyanus
(0−99; 100−199; 200−300 mm TL).
In the 4-factor model, TL (in mm) of each individual was used as a covariate following Anderson et al. (2008). We used permutational multivariate analysis of variance (PERMANOVA) to test for differences in the timing of ontogenetic diet shifts in the 3 study species. Homogeneity of multivariate variance was verified for all 4 model terms using PERMDISP (p > 0.05). The Bray-Curtis coefficient was selected to construct the similarity matrix after data were 4th root transformed. Due to the unbalanced sampling design and small sample sizes in certain size classes, Type I (sequential) sums of squares and Monte Carlo randomization were used to meet the assumptions of PERMANOVA.
To simplify the analysis and provide insights into how the types and foraging modes of consumed prey varied with predator size, we reclassified each of the prey categories enumerated above into 1 of 4 cate-gories: mobile vertebrate, cryptic vertebrate, mobile invertebrate, and cryptic invertebrate. Assignment
into each category was based on prey behaviour and habitat use. For example, small fishes in the Families Gobiidae, Blenniidae and Tripterygiidae typically remain motionless and in close contact with benthic substrates, and were therefore classified as cryptic vertebrates, whereas fishes in the Families Pomacen-tridae, Labridae and Scaridae are more active, and were thus classified as mobile vertebrates. We used PERMANOVA as above to test whether the 3 study species selected prey based on prey behaviour, and whether such patterns differed among zones, as a test of the influence of large predators on foraging by juvenile predators.
Prey availability
Prey availability was quantified at each of the 4 sites in April 2009. Based on the gut contents of the 3 study species, we surveyed the abundance of all prey taxa and defined prey as any organisms < 30 mm TL. To quantify the abundance of cryptic prey, we conducted underwater visual census (UVC) surveys along 4 replicate 50 ×1 m transects at each of the 4 sites. A single observer (C.K.W.) re cor -ded prey abundance along each transect to reduce observer bias. The prey observed and quantified dur-ing UVC were primarily non-cryptic fishes and crus-taceans, identified to the Family and Order level, respectively. To quantify the abundance of cryptic prey, we used a dilute solution of ethanol and clove (10:1) as an anesthetic to sample 5 replicate 50 × 50 cm quadrats at each site at randomly selected points along the same transects established for UVC surveys. Two divers applied the clove oil solution to benthic substrates, waited approximately 3 min, and collected all anesthetized individuals for identifica-tion to the same taxonomic level used in visual sur-veys. Visual transects and clove oil surveys were con-ducted in the same locations before collecting recruit and juvenile predators for gut content analysis.
We tested for effects of 2 factors on prey availabil-ity: Zone (fixed effect: reserve and open) and Sam-pling Method (fixed effect: UVC transect and clove oil quadrat). Preliminary analysis using PERM-ANOVA revealed that variation among sites was non-significant (p > 0.05), and data from visual tran-sects (mobile prey) and clove oil quadrats (cryptic prey) were standardized and pooled within each site to represent the total prey community following Fletcher & Underwood (2002). We used PERM-ANOVA to test for effects of Zone and Sampling Method on prey availability. Homogeneity of multi-Gut fullness index = 1−no. ind. with empty stoomachs
variate variance was confirmed for both factors using PERMDISP (p > 0.05). Due to the occurrence of 0 val-ues for some prey items, data were log(x + 1) trans-formed before constructing the similarity matrix. Bray-Curtis dissimilarity was used as the metric of comparison. Type I (sequential) sums of squares was used to meet the assumptions of PERMANOVA. Monte Carlo randomization was used to randomly sample data repeatedly and generate a probability distribution to calculate a p-value (pMC) for each fac-tor. Similarity percentage (SIMPER) analysis was used to evaluate the contribution of prey categories to variation between zones. The pattern of variation in prey availability between zones and sampling methods was visualized using Principal Coordinates Analysis (PCO; Anderson & Willis 2003).
Prey selection
Strauss’s linear index of selectivity (L)was calcu-lated using data from prey availability surveys and gut content analyses to quantify food preferences for each of the 3 predator size classes outlined in the diet analysis (Manly et al. 2002). Values of Lrange between +1 and –1. Positive values indicate selec-tion for that prey category greater than expected based on its availability (selection), a value near 0 indicates that prey was selected as expected based on availability (neither selection or avoidance), and negative values indicate that prey category was selected less often than expected based on its avail-ability (avoidance).
Multifactorial PERMANOVA was used to test for differences in prey selectivity using 3 explanatory variables: Zone (reserve and open), Species (the 3 study species) and Size (3 levels; the 3 size categories reported above in ‘Diet’ for each species). Lfor each prey category and predator size category was used as the response variable. Because L can range from –1 to +1, we used the Euclidean distance simi-larity index to construct the matrix, and Type I (sequential) sums of squares and Monte Carlo ran-domization were used to meet the assumptions of PERMANOVA due to the unbalanced sample sizes.
RESULTS
Recruit abundance
For all 3 study species, there was no significant dif-ference in recruit abundance between reserves and
open areas (Fig. 1, Table 2). Abundance of Plectropo-mus maculatusrecruits was greater at sites open to fishing, but this effect was not significant. With the exception of Lutjanus carponotatus, there was also no difference in recruit abundance among sampling sites (Table 2). However, we note that variability in recruit abundance among zones and sites was high, and thus our power to detect differences was low.
Diet
For each study species, nearly half of all individuals collected had empty guts. The mean (± SD) percent-ages of samples across the 4 sampling sites in 2 yr with empty stomachs were as follows: Plectropomus
(58.5 ± 16.7%), Lutjanus carponotatus (57.2 ± 16.3%) and Epinephelus quoyanus (44.5 ± 15.6%). There was no significant difference in the proportion of empty guts between reserves and open areas (F = 4.068, p = 0.1308), suggesting that hunger level between zones was similar.
Species
P. maculatus L. carponotatus E. quoyanus
Density (number per 250 m
2)
0 1 2 3 4 5
[image:5.612.316.529.376.532.2]Open Reserve
Fig. 1. Plectropomus maculatus, Lutjanus carponotatus, and
Epinephelus quoyanus.Relationship between mean (+ SD) recruit abundance of the 3 study species and zone (open
or reserves)
Zone Site(Zone)
F p F p
P. maculatus 3.253 0.078 2.074 0.101
L. carponotatus 0.255 0.608 3.109 0.025*
E. quoyanus 1.9 0.171 1.6 0.204
Table 2. Plectropomus maculatus, Lutjanus carponotatus, and Epinephelus quoyanus. Results of a 2-way nested ANOVA testing the effects of Zone (reserve & open) and Sampling Site (nested in Zone) on recruit abundance of
[image:5.612.307.538.649.720.2]There was no evidence that the diet of recruits or ju veniles differed between re serves and open areas. PERMANOVA analyses (Table 3) showed significant differences in diet among species and among predator size categories within a species, but there were no differences between zones (re serves and open areas) or sites within zones. The smallest individuals of both Plectropomus macu-latus and Lutjanus carponotatus con-sumed a high proportion of cryptic invertebrates (shrimps and crabs), and the proportion of vertebrate prey in their diet increased in both species with size. In general, vertebrate prey items made up a grea ter proportion of the diet in
P. maculatus than in L. carponotatus
(Fig. 2); however, vertebrate prey spe-cies composition differed be tween the 2 predators: P. maculatusconsumed cryp-tic gobies at smaller sizes and shifted to mobile damselfishes and wrasse at larger sizes, whereas L. carponotatus
consumed small cryptic gobies (primar-ily Eviota spp.) when small and shifted to larger gobies (e.g. Asterropteryxspp. and Istigobius spp.) at larger sizes. In contrast, Epinephelus quoyanus pre-dominantly consumed cryp tic inverte-brates, exclusively at larger sizes, but with occasional mobile and cryptic invertebrates included in the diet of smaller individuals. Each of the 3 study species exhibited ontogenetic diet shifts, but the size at which these shifts occurred were similar between reserve and open areas (Fig. 2).
Prey availability
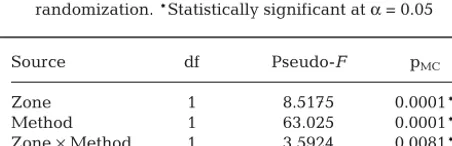
As expected, prey availability data from visual transects and clove oil quadrats differed significantly (Table 4) as they sampled different types of prey (i.e. mobile versus cryptic). PCO illustrated a clear sepa-ration between the 2 sampling methods (Fig. 3). The composition of mobile prey (visual transects) was similar between reserves and open areas; however, the composition of cryptic prey (clove oil transects) differed between reserves and open areas. This resulted in a significant interaction between Zone and Sampling Method (Table 4).
Source
df
Pseudo-F
pMC [image:6.612.245.538.76.441.2]
Size
1
27.02
0.0001* Zone
1
1.1706
0.3561 Species
2
27.792
0.0001* Site(Zone)
4
1.062
0.3633 Total
607
Table 3. Results of a multifactorial PERMANOVA testing effects of 4 factors on the composition of gut contents of the 3 study species: Zone (reserve and open), Species (3 preda-tor species: Plectropomus maculatus, Lutjanus carponotatus, and Epinephelus quoyanus), Site (nested within zone; 4 sites per zone), and Size (total lenght). pMC: p-values calculated
using Monte Carlo randomization. *Statistically significant at α= 0.05
0 20 40 60 80 100
c
Diet (%)
0 20 40 60 80 100
b
a
0 20 40 60 80 100
Vertebrate (mobile) Vertebrate (cryptic) Invertebrate (cryptic) Invertebrate (mobile)
Reserves Open
0 50 100 150 200 250 300 0 50 100 150 200 250 300
[image:6.612.308.538.637.719.2]Size (mm TL)
Fig. 2. Ontogenetic changes in diet composition for individuals collected from no-take reserves (left panels) and open areas (right panels) for (a) P. maculatus, (b) L. carponotatusand (c) E. quoyanus. Prey categories used to describe prey availability were reclassified into 4 general categories for this graph: mobile vertebrates, cryptic vertebrates, mobile invertebrates and
SIMPER analysis revealed that reserves had a great -er abundance of Galatheidae (contribution: 19.1%), Palaemonoidea (14.06%), and Gobiidae (7.9%) than open areas, but had less Caridea (shrimp) (10.98%). These 4 prey categories accoun ted for 81% of the dif-ference in prey availability between reserves and open areas.
Prey selection
Prey selection indices calculated from diet analysis and prey availability confirmed that prey selectivity shifted as predators grew larger (Fig. 4). PERM-ANOVA analysis revealed that all 3 factors — Spe-cies, Zone and Size — had a significant influence on
prey selection (Table 5). As expected based on diet analysis, the 3 species differed in the prey selected. The significant effect of Zone (reserve versus open areas) on prey selection reflects the differences in prey availability observed between zones rather than actual differences in prey consumed by a given species in different zones. The significant effect of predator size on prey selection is reflected in clear ontogenetic shifts for all 3 species (Fig. 4). Small Plec-tropomus maculatus (< 99 mm TL) preferentially se -lected shrimp (Caridea) in reserves and open areas whereas large P. maculatus(> 200 mm TL) avoided shrimp and predominantly consumed damselfishes in both reserves and open areas. As Lutjanus carponotatus increased in size, their preference for gobies increased while consumption of Galatheidae and shrimps decreased in both reserves and open areas. Similarly, Epinephelus quoyanus showed a preference for crabs (Brachyura) that increased as the size of the former increased, and a consistent avoidance of Galatheidae across all size classes.
DISCUSSION
Overall, we found little evidence that increases in the abundance of large predatory fishes inside no-take reserves on the Great Barrier Reef influence the abundance or feeding behaviour of recruits and juve-niles. We found no support for the hypotheses that no-take reserves with a greater abundance of large predators influence recruitment, diet, or the timing of ontogenetic diet shifts in juvenile predators. There were some unexplained differences in prey availabil-ity between reserves and areas open to fishing, which resulted in slight differences in the magnitude of prey selection indices for some taxa. However, overall the key trends in diet and prey selection were accounted for body size. Re cruits and juveniles of each of the 3 study species are found in the same nearshore habitat and have similar diets at small size classes, but their diets and prey preferences diverged as they increased in size.
Recruit abundance
Greater predator abundance inside reserves has been associated with decreased prey abundance and shifts in prey composition (Beets 1997, Stewart & Jones 2001, Graham et al. 2003), and we therefore hypothesized that recruit abundance of predatory fishes would be lower inside reserves. We found no
Source df Pseudo-F pMC
Zone 1 8.5175 0.0001*
Method 1 63.025 0.0001*
Zone ×Method 1 3.5924 0.0081*
[image:7.612.47.293.301.488.2]Total 46
Table 4. Multifactorial PERMANOVA testing for effects of 3 factors on prey availability: Zone (reserve and open), Sam-pling Method (underwater visual census and a clove oil quadrat), and interaction between Zone and Sampling Method. pMC: p-values calculated using Monte Carlo
[image:7.612.61.287.647.720.2]randomization. *Statistically significant at α= 0.05 Fig. 3. Principal Coordinates Analysis (PCO) plot of prey availability at 2 no-take reserves (grey solid symbols) and 2 nearby areas open to fishing (open symbols). Each data point represents a single underwater visual census (UVC) transect or a clove oil quadrat. UVC transects are grouped together
evidence to support this hypothesis, but our power to de tect differences was low due to high variability. Nev-ertheless, one likely ex planation for this result is that in our study system recruits and juveniles of the 3 study species are most abundant in shallow nearshore reef habitats, whereas adults are most abundant on reef flats and slopes. As a result, encounter rates between adults and recruits/ juveniles may be reduced, although we frequently observed adults in nearshore habitats. Quantifying en -counter rates between adults and juveniles in different habitats (e.g. nearshore areas where juveniles are more abundant and reef slope habi-tats where adults are more abundant) would be useful to understand how juvenile predation risk varies across habitats. Predation risk for recruits and juveniles may also be lower for the 3 study species because at small sizes they are relatively cryptic and less abundant compared to other potential prey species, and may therefore only be opportunistic tar-gets of large predators.
Diet
There was no evidence of a differ-ence in the proportion of empty guts or in the diets of the recruits and juveniles of the 3 species between reserves and open areas. This find-ing was consistent across all sizes of recruits and juveniles, and suggests that their foraging behav-iour was not influenced by the greater abundance of large predators inside reserves. The proportion of empty guts has been used as a basic metric of feeding rate in animals (Huey et al. 2001). Pre vious work demonstrates that fishes in higher trophic levels feeding on energy-rich food resources often have a higher proportion of empty guts (Arrington et al. 2002), but the relationship between fre-quency of empty guts and feeding ecology is still unclear (e.g. Gill & Hart 1994, Vinson & Angradi 2011). The proportions of empty guts in our sam-ples were similar for the recruits and juveniles of all 3 spe cies across all sampling sites (means
vary-Source
df
Pseudo-F
p(perm) [image:8.612.46.348.79.452.2]
Species
2
20.697
0.0001* Zone
1
34.782
0.0001* Size
5
15.134
0.0001* Total
233
Table 5. Results of a multifactorial PERMANOVA testing ef-fects of 3 factors on prey selection in the 3 study species: Zone (reserve and open), Species (3 predator species: Plectropomus maculatus, Lutjanus carponotatus, and Epinephelus quoy-anus), and Size (total length). *Statistically significant at
α= 0.05
Fig. 4. (a) Plectropomus maculatus, (b) Lutjanus carponotatus and (c)
Epinephelus quoyanus: ontogenetic changes in prey selectivity of the 3 study species inside no-take reserves (left panels) and areas open to fish-ing (right panels). L: Strauss’s linear selection index (see ‘Materials and
[image:8.612.60.286.647.719.2]ing from 44.5 to 58.5 %), and greater than has been described for P. leopardus (30 to 40 %, St John 1999, St John et al. 2001). However, the size range of sam pled of Plectropomus maculatusin the pres-ent study (23 to 329 mm TL) was considerably smaller than that of P. leopardus (47 to 573 mm fork length, St John 1999; 130 to 585 mm fork length, St John et al. 2001), which could account for differences between the 2 studies. Furthermore, the higher proportion of empty guts in the present study may in part be an artifact of our sampling design; samples were collected throughout the day rather than focusing on the peak crepuscular feed-ing periods of predatory fishes (i.e. dawn and dusk, St John 1999).
Although there was no effect of Zone on the diets of recruits and juveniles, we found clear evidence of diet differences among species and ontogenetic diet shifts within species. At small sizes, Plectropomus maculatus and Lutjanus carponotatus consumed a higher proportion of fish prey than Epinephelus quoyanus. As they increased in size, juvenile
P. maculatus and L. carponotatus diets diverged:
P. maculatus switched to a diet dominated by fish prey, whereas L. carponotatusconsumed a mix of fish and crustaceans. In contrast, E. quoyanusconsumed mostly crustaceans, and this remained relatively stable throughout ontogeny. These patterns suggest that food competition between the 3 species, all of which occur in the same habitat, is relatively low (Root 1967).
Previous studies have documented similar onto -genetic diet shifts in predatory fishes. For example,
Plectropomus leopardus on the Great Barrier Reef exhibit a similar shift in diet with growth as we observed in P. maculatus, from crustaceans at small sizes to mobile fishes at larger sizes, including poma-centrids (damselfish) and labrids (wrasse) (St John 1999). However, large P. leopardusin New Caledo-nia include invertebrates (crustaceans and molluscs) in their diet (Kulbicki et al. 2005), suggesting that diet varies regionally. Further evidence of a regional effect on diet comes from a comparison of the only published study we know of on diets of Lutjanus car-ponotatusand Epinephelus quoyanusand the results of the present study. We found that L. carponotatus
fed on large numbers of blennies, and E. quoyanus
consumed a high proportion of crustaceans at the inshore Keppel Islands, whereas Connell (1998b) found that L. carponotatus consumed gobies, and
E. quoyanusconsumed relatively more fishes at the offshore Capricorn-Bunker reefs, which are approxi-mately 70 km from our study site.
Prey availability
Why abundances of Palaemonoidea, Galatheidae, Gobiidae and Caridea would differ between re serves and open areas is unclear, but several possible expla-nations exist. For example, most Pa lae monoids we surveyed were from the genus Coral liocaris, which is strongly associated with live Acroporacorals (Stella et al. 2011). Similarly, most gobies were from the genus Gobiodon, which is also strongly associated with live Acroporacorals (Munday et al. 1997). In a related study, we documented higher cover of live
Acroporainside reserves in the Keppel Islands (Wen et al. in press), which likely explains the greater abundance of Palaemonoids and gobies inside reserves. Furthermore, although not explicitly tested in this study, the removal of large predators can have cascading effects on both the structure of microhabi-tats and abundance of organisms in lower trophic levels (e.g. McClanahan et al. 2000, Hughes et al. 2007, Mumby et al. 2007), which could explain differ-ences in the abundance of Caridea and Ga latheidae between reserves and open areas. However, the spe-cific trophic relationships between large individuals of the 3 predatory species in this study — which were significantly more abundant inside Keppel Island reserves — and lower trophic levels remain unclear and warrant further study (e.g. Kramer et al. 2012).
Prey selection
in predation risk that allows juveniles to forage far-ther from shelter and pursue mobile prey. In contrast, shifts in diet with size of the strongly benthic-associ-ated E. quoyanuslikely re flect the greater ability of larger individuals to handle large prey (e.g. larger gape and increased muscle development). At small sizes, Epinephelus quoyanus selected small shrimp and crustaceans, which have relatively thin shells, whereas larger E. quoyanusswitched to consuming large crabs that have harder shells and higher pro-tein content.
Although we did detect some minor differences in prey selection among the 3 species in reserves and open areas, these were most likely due to the as yet unexplained differences in the abundance of a few categories of cryptic prey between reserves and open areas. The Galatheidae and Palaemonoidea, which differed in abundance between reserves and fished areas, were largely avoided by all size classes of the 3 study species. In contrast, shrimp (Caridea), which were positively selected as prey by the smaller size classes of all 3 study species, were less abundant inside reserves, despite a similar abundance of recruits of the 3 study species in reserve and open.
CONCLUSIONS
In the present study we examined prey availability inside and outside reserves and evaluated the diets and patterns of prey selection of recruits and juve-niles of 3 predatory fish species that are important fishery targets on IndoPacific coral reefs. We hypo -thesized that the greater abundance of large preda-tors inside no-take reserves might influence the abundance of recruits and the diets and patterns of prey selection in recruits and juveniles. We found lit-tle evidence to support these hypotheses. Recruit abundances between reserves and open areas were similar for all species, and each species exhibited similar diets, patterns of prey selection, and ontoge-netic diet shifts in reserves and open areas. Apart from providing some of the first quantitative data on juvenile dietary patterns for fishery species, this study demonstrates that there is little effect of a greater abundance of large predators inside reserves on the juvenile stages of these same predators. How-ever, we note that similar studies should be con-ducted on other predator species, and in locations where differences in predator biomass between reserves and open areas are greater, to determine whether our conclusions are broadly applicable.
Acknowledgements. We are grateful to the many people who assisted in field and laboratory work, particularly R. Evans, T. Mannering, M. Srinivasan and S. Golderberg. Funding was provided by the Marine and Tropical Sciences Research Facility (MTSRF), Great Barrier Reef Marine Park Authority (GBRMPA) and the Australian Research Council Centre of Excellence for Coral Reef Studies at James Cook University.
LITERATURE CITED
Akritas MG (1990) The rank transform method in some two-factor designs. J Am Stat Assoc 85: 73−78
Allen G, Steene R, Humann P, DeLoach N (2003) Reef fish identification: tropical Pacific. New World Publications, Jacksonville, FL
Anderson MJ, Willis TJ (2003) Canonical analysis of princi-pal coordinates: a useful method of constrained ordina-tion for ecology. Ecology 84: 511−525
Anderson MJ, Gorley R, Clarke K (2008) PERMANOVA+ for PRIMER: guide to software and statistical methods. PRIMER-E, Plymouth
Arrington DA, Winemiller KO, Loftus WF, Akin S (2002) How often do fishes ‘run on empty’? Ecology 83: 2145−2151
Ayling AM, Ayling AL, Mapstone BD (1992) Possible effects of protection from fishing pressure on recruitment rates of the coral trout (Plectropomus leopardus: Serranidae). Proceedings of the 1991 Recruitment Workshop of the Australian Society for Fish Biology. Bureau of Rural Resources Proceedings No. 16, Australian Government Publishing Service, Canberra, p 210−215
Beets J (1997) Effects of a predatory fish on the recruitment and abundance of Caribbean coral reef fishes. Mar Ecol Prog Ser 148: 11−21
Blaustein L (1997) Non-consumptive effects of larval Sala-mandraon crustacean prey: Can eggs detect predators? Oecologia 110: 212−217
Connell SD (1998a) Effects of predators on growth, mortality and abundance of a juvenile reef-fish: evidence from manipulations of predator and prey abundance. Mar Ecol Prog Ser 169: 251−261
Connell SD (1998b) Patterns of piscivory by resident preda-tory reef fish at One Tree Reef, Great Barrier Reef. Mar Freshw Res 49: 25−30
Dahlgren CP, Eggleston DB (2000) Ecological processes underlying ontogenetic habitat shifts in a coral reef fish. Ecology 81: 2227−2240
Evans RD, Russ GR (2004) Larger biomass of targeted reef fish in no-take marine reserves on the Great Barrier Reef, Australia. Aquat Conserv 14: 505−519
Ferreira BP, Russ GR (1992) Age, growth and mortality of the inshore coral trout Plectropomus maculatus(Pisces: Ser-ranidae) from the Central Great Barrier Reef, Australia. Aust J Mar Freshw Res 43: 1301−1312
Fletcher DJ, Underwood AJ (2002) How to cope with nega-tive estimates of components of variance in ecological field studies. J Exp Mar Biol Ecol 273: 89−95
Gill AB, Hart PJB (1994) Feeding behaviour and prey choice of the three spine stickleback: the interacting effects of prey size, fish size and stomach fullness. Anim Behav 47: 921−932
Gosliner TM, Behrens DW, Williams GC (1996) Coral reef animals of the Indo-Pacific: animal life from Africa to
➤
➤
➤
➤
➤
➤
➤
➤
➤
➤
Hawaii exclusive of the vertebrates. Sea Challengers, Monterey, CA
Graham NAJ, Evans RD, Russ GR (2003) The effects of mar-ine reserve protection on the trophic relationships of reef fishes on the Great Barrier Reef. Environ Conserv 30: 200−208
Guillaume J, Kaushik S, Bergot P, Métailler R (eds) (2001) Nutrition and feeding of fish and crustaceans. Springer, London
Halpern BS, Warner RR (2002) Marine reserves have rapid and lasting effects. Ecol Lett 5: 361−366
Harrison HB, Williamson DH, Evans RD, Almany GR and others (2012) Larval export from marine reserves and the recruitment benefit for fish and fisheries. Curr Biol 22: 1023−1028
Huey RB, Pianka ER, Vitt LJ (2001) How often do lizards ‘run on empty’? Ecology 82: 1−7
Hughes TP, Bellwood DR, Folke CS, McCook LJ, Pandolfi JM (2007) No-take areas, herbivory and coral reef resili-ence. Trends Ecol Evol 22: 1−3
Kingsford MJ (1992) Spatial and temporal variation in pre-dation on reef fishes by coral trout (Plectropomus leopar-dus, Serranidae). Coral Reefs 11: 193−198
Kingsford MJ (2009) Contrasting patterns of reef utilization and recruitment of coral trout (Plectropomus leopardus)
and snapper (Lutjanus carponotatus)at One Tree Island, southern Great Barrier Reef. Coral Reefs 28: 251−264 Kramer M, Bellwood D, Bellwood O (2012) Cryptofauna
of the epilithic algal matrix on an inshore coral reef, Great Barrier Reef. Coral Reefs 31: 1007–1015
Kulbicki M, Bozec YM, Labrosse P, Letourneur Y, Mou-Tham G, Wantiez L (2005) Diet composition of carnivo-rous fishes from coral reef lagoons of New Caledonia. Aquat Living Resour 18: 231−250
Light PR, Jones GP (1997) Habitat preference in newly settled coral trout (Plectropomus leopardus, Serranidae). Coral Reefs 16: 117−126
Lima SL (1998) Nonlethal effects in the ecology of preda-tor–prey interactions. BioScience 48: 25–34
Lubchenco J, Palumbi SR, Gaines SD, Andelman S (2003) Plugging a hole in the ocean: the emerging science of marine reserves. Ecol Appl 13: 3−7
Madin EMP, Gaines SD, Warner RR (2010) Field evidence for pervasive indirect effects of fishing on prey foraging behavior. Ecology 91: 3563−3571
Manly BFJ, McDonald LL, Thomas DL, McDonald TL, Erick-son WP (2002) Resource selection by animals: statistical analysis and design for field studies. Kluwer, Boston, MA, USA
Mannering TD (2008) Benefits of marine protected areas beyond boundaries: an evaluation for two coral reef fishes. MSc thesis, James Cook University, Townsville, QLD
McCauley DJ, Micheli F, Young HS, Tittensor DP and others (2010) Acute effects of removing large fish from a near-pristine coral reef. Mar Biol 157: 2739−2750
McClanahan TR, Arthur R (2001) The effect of marine reserves and habitat on populations of East African coral reef fishes. Ecol Appl 11: 559−569
McClanahan TR, Bergman K, Huitric M, McField M, Elfwing T, Nystrom M, Nordemar I (2000) Response of fishes to algae reduction on Glovers Reef, Belize. Mar Ecol Prog Ser 206: 273−282
Milinski M, Heller R (1978) Influence of a predator on the optimal foraging behaviour of sticklebacks (Gasterosteus
aculeatusL.). Nature 275: 642−644
Mora C, Andrèfouët S, Costello MJ, Kranenburg C and oth-ers (2006) Coral reefs and the global network of marine protected areas. Science 312: 1750−1751
Mumby PJ, Harborne AR, Williams J, Kappel CV and others (2007) Trophic cascade facilitates coral recruitment in a marine reserve. Proc Natl Acad Sci USA 104: 8362−8367 Munday PL, Jones GP, Caley MJ (1997) Habitat specialisa-tion and the distribuspecialisa-tion and abundance of coral-dwelling gobies. Mar Ecol Prog Ser 152: 227−239 Newman SJ, Cappo M, Williams DMB (2000) Age, growth
and mortality of the stripey, Lutjanus carponotatus
(Richardson) and the brown-stripe snapper, L. vitta
(Quoy and Gaimard) from the central Great Barrier Reef, Australia. Fish Res 48: 263−275
O’Leary J, Potts D, Braga J, McClanahan T (2012) Indirect consequences of fishing: reduction of coralline algae suppresses juvenile coral abundance. Coral Reefs 31: 547−559
Pauly D, Christensen V, Guénette S, Pitcher TJ and others (2002) Towards sustainability in world fisheries. Nature 418: 689−695
Preisser EL, Bolnick DI, Benard MF (2005) Scared to death? The effects of intimidation and consumption in preda-tor–prey interactions. Ecology 86: 501−509
Roberts CM, Polunin NVC (1991) Are marine reserves effec-tive in management of reef fisheries? Rev Fish Biol Fish 1: 65−91
Roberts CM, Polunin NVC (1993) Marine reserves: simple solutions to managing complex fisheries? Ambio 22: 363−368
Root RB (1967) The niche exploitation pattern of the blue-gray gnatcatcher. Ecol Monogr 37: 317−350
Russ GR, Cheal AJ, Dolman AM, Emslie MJ and others (2008) Rapid increase in fish numbers follows creation of world’s largest marine reserve network. Curr Biol 18: R514−R515
Ruttenberg BI, Hamilton SL, Walsh SM, Donovan MK and others (2011) Predator-induced demographic shifts in coral reef fish assemblages. PLoS ONE 6: e21062 Sadovy Y (2001) Summary of regional survey of
fry/finger-ling supply for grouper mariculture in Southeast Asia. SPC Live Reef Fish Inf Bull 8: 22–29
Schellekens T, de Roos AM, Persson L (2010) Ontogenetic diet shifts result in niche partitioning between two con-sumer species irrespective of competitive abilities. Am Nat 176: 625−637
St John J (1999) Ontogenetic changes in the diet of the coral reef grouper Plectropomus leopardus(Serranidae): pat-terns in taxa, size and habitat of prey. Mar Ecol Prog Ser 180: 233−246
St John J, Russ GR, Brown IW, Squire LC (2001) The diet of the large coral reef serranid Plectropomus leopardusin two fishing zones on the Great Barrier Reef, Australia. Fish Bull 99: 180−192
Stella JS, Pratchett MS, Hutchings PA, Jones GP (2011) Coralassociated invertebrates: diversity, ecological im -portance and vulnerability to disturbance. Oceanogr Mar Biol Annu Rev 49: 43−104
Stewart BD, Jones GP (2001) Associations between the abundance of piscivorous fishes and their prey on coral reefs: implications for prey-fish mortality. Mar Biol 138: 383−397
Sweatman HPA (1993) Tropical snapper (Lutjanidae) that is piscivorous at settlement. Copeia 1993: 1137−1139
Vinson MR, Angradi TR (2011) Stomach emptiness in fishes: sources of variation and study design implications. Rev Fish Sci 19: 63−73
Watson M, Munro JL (2004) Settlement and recruitment of coral reef fishes in moderately exploited and over -exploited Caribbean ecosystems: implications for marine protected areas. Fish Res 69: 415−425
Wen C, Pratchett MS, Almany G, Jones GP (in press) Pat-terns of recruitment and microhabitat associations for three predatory coral reef fishes on the southern Great Barrier Reef, Australia. Coral Reefs doi:10.1007/s00338-012-0985-x
Williams DMB, Russ GR (1994) Review of data on fishes of commercial and recreational fishing interest in the Great Barrier Reef: a report to the Great Barrier Reef Marine Park Authority. Report No. 9780642173 881. Great Barrier Reef Marine Park Authority, Towns ville, QLD Williamson DH, Russ GR, Ayling AM (2004) No-take marine
reserves increase abundance and biomass of reef fish on inshore fringing reefs of the Great Barrier Reef. Environ Conserv 31: 149−159
Wood LJ, Fish L, Laughren J, Pauly D (2008) Assessing progress towards global marine protection targets: short-falls in information and action. Oryx 42: 340−351
Editorial responsibility: Tim McClanahan, Mombasa, Kenya
Submitted: May 23, 2012; Accepted: July 17, 2012 Proofs received from author(s): November 11, 2012
➤
➤
➤